Washington's Liquor Outlets Quadrupled by 2013, and Its Spirits Prices Rose Faster Than Idaho's and Oregon's Through 2016

Independently fact-checked against primary sources (last audited November 10, 2026). · 23 primary sources cited on this page. How we verify our legal content
On June 1, 2012, the first day private stores could sell hard liquor in Washington, only 36 of the state's own liquor stores were scheduled to be open, the Federal Way Mirror reported. The others had closed in the days before. The Washington State Liquor Control Board (WSLCB), the agency that had run the stores, later called that fiscal year "the greatest change in operations for the WSLCB in its 78 year history."
"About five times as many stores will now sell hard liquor," KNKX reported that day, and shoppers could buy vodka or rum at the supermarket. At a Fred Meyer in Issaquah, the Issaquah Reporter worked out, a 750-milliliter bottle of Captain Morgan rum would cost about $20.90 after taxes, against $19.95 at a state store. A bottle of Ketel One vodka would cost about 50 cents less than before.
Whether private stores would charge more or less than the state was the question Washington had argued about for two years. Voters had ended the state's liquor monopoly in November 2011 with Initiative 1183, after a campaign Costco paid for almost alone. News reports put Costco's commitment at $22 million to $22.5 million. State Public Disclosure Commission records show about $19.9 million in Costco contributions to the Yes committee.
The official argument for the measure promised competition, convenience and "hundreds of millions of dollars in new revenues." Opponents warned of "a new 27 percent tax passed on to consumers" and "more than four times as many liquor outlets." What did Washington get when it gave up its liquor stores, and how close did each side come?
The number of places selling spirits rose about fourfold, as opponents had warned and almost exactly as the state's budget office had forecast. In two store-price studies, prices for 750-milliliter bottles then rose faster in Washington than in neighboring Idaho and Oregon.
Sales inside Washington jumped in the first full year. Most of the measures researchers used for how much residents drank barely moved, and one study found more injury hospitalizations in urban counties. Fourteen years on, Washington's spirits excise rate is still the highest in the country by the Tax Foundation's count. A 2025 bill to study the state's alcohol taxes got no further after January 2026.
More than four times the stores
The first answer the initiative could give was the store count, and it came in where the state said it would.
Before the vote, the state budget office, the Office of Financial Management, put its assumption in writing. Its fiscal impact statement assumed "1,428 licensed liquor retailers," up from 328 state and contract stores by the state's count. The 2019 study in the table below counted 333 stores before privatization.
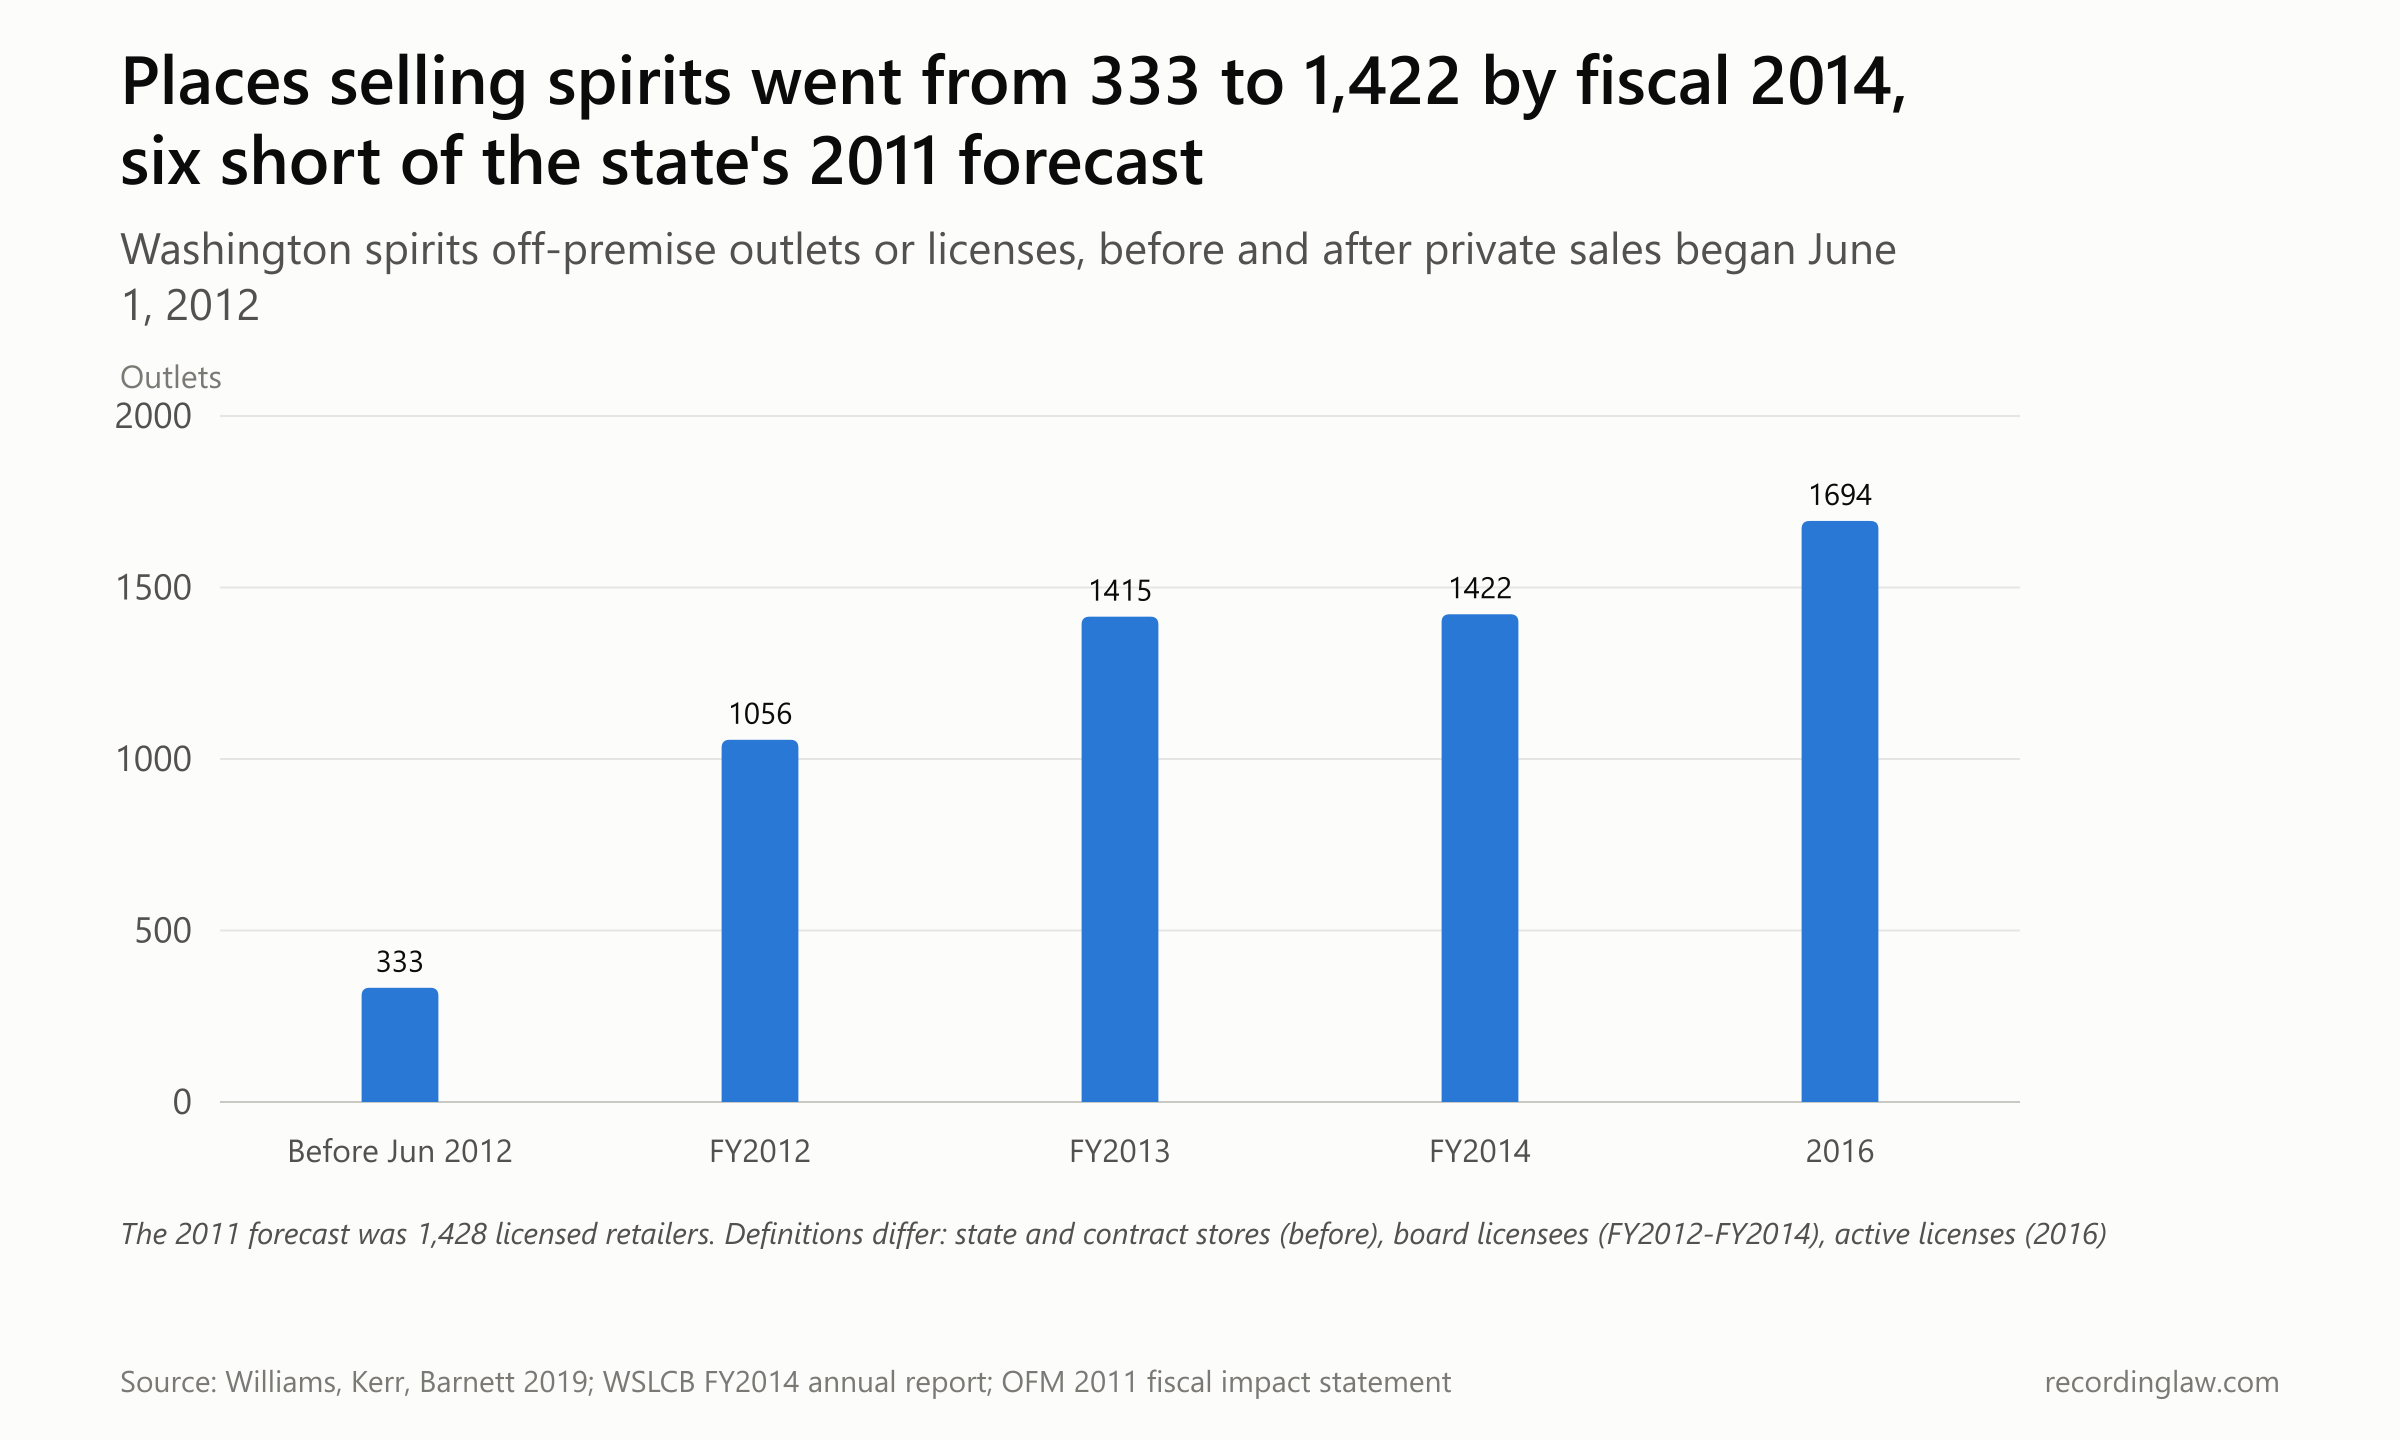
Sources: Williams, Kerr and Barnett 2019 (2011 and 2016); Washington State Liquor Control Board FY2014 annual report (FY2012 to FY2014); Office of Financial Management 2011 fiscal impact statement (forecast). Definitions differ by column.
| Period | Spirits off-premise outlets | Source and definition |
|---|---|---|
| Before June 2012 | 333 | 167 state stores and 166 contract stores (Williams 2019) |
| FY2012 | 1,056 | LCB spirits off-premise licensees |
| FY2013 | 1,415 | LCB spirits off-premise licensees |
| FY2014 | 1,422 | LCB spirits off-premise licensees |
| 2016 | 1,694 | Active spirits licenses (Williams 2019) |
| 2011 forecast | 1,428 | OFM fiscal impact assumption |
Within two years the state had more than four times as many places selling spirits. The Liquor Control Board counted 1,422 spirits off-premise licensees in fiscal 2014, the year that ended June 30, 2014. That was six fewer than the 1,428 the budget office had assumed in 2011. By 2016 there were 1,694 active licenses, about five times the old store count.
The budget office's 2015 evaluation counted about 1,406 retail outlets, "a 327 percent increase from pre-privatization." A 327 percent increase means about 4.3 times as many.
The growth was not even across the state. Most counties gained stores, three gained none, and one, Garfield County, lost its only one.
On the count, the opponents' "more than four times as many" warning matched what happened. The harder question was what the new stores charged, and price was where Costco's campaign for private liquor had started.
Costco's first try
Costco had made the case for private liquor sales once before. In 2010 it backed Initiative 1100, and that campaign was about price. The Yes on 1100 campaign said, as the Federal Way Mirror summarized its claims, that "The state’s Liquor Control Board marks up the price of alcohol by 51.9 percent. Private sector competition will drive prices down." Joel Benoliel, a Costco senior vice president, told NPR in October 2010, as the Federal Way Mirror reported: "Part of what we are known for is being pro-consumer, and when we identify places where they are being gouged, we think it’s incumbent on us to stand up for our consumers."
Beer and wine distributors saw a different future. "There will be an explosion of stores," said John Guadnola, executive director of the Washington Beer and Wine Wholesalers Association. "Consumption will go up and problems will go up."
On November 2, 2010, voters said no to both liquor measures on the ballot. Initiative 1100 got 46.57%, or 1,175,302 yes votes. A rival distributor-backed measure, Initiative 1105, got 34.96%.
Costco had given $4.72 million to the Yes on 1100 committee, according to state disclosure records. After both failed, Gov. Chris Gregoire directed the Liquor Control Board to survey what residents thought of the state system. A year later Costco came back with a different pitch.
What voters were told in 2011
Costco's second campaign made a different promise. The 2011 argument for Initiative 1183 in the state Voters' Pamphlet was signed by leaders of the Washington Restaurant Association, the Northwest Grocery Association and Family Wineries of Washington State, a former State Patrol captain, a former president of the Association of Washington Cities and former Gov. Daniel J. Evans. It said the measure "ends Washington's outdated state liquor store monopoly" and "prevents liquor sales at gas stations and convenience stores."
It promised money. Retailers and distributors would pay license fees, "generating hundreds of millions of dollars in new revenues for state and local services like education, health care and public safety." Its rebuttal added that the measure would do so "without raising taxes."
The argument's only promise about price was for wine. Removing old distribution rules, it said, would "lead to better selections and more competitive wine prices for consumers." It did not say liquor would get cheaper.
The Attorney General's neutral explanatory statement described the money side in plainer terms. "Initiative 1183 would not change the existing taxes on spirits," it said. Instead, retail stores would pay a license fee of 17% of gross spirits sales, and distributors 10% for their first two years, then 5%.
Opponents, organized as Protect Our Communities, read those fees as a tax. Their argument was signed by leaders of the Washington Association for Substance Abuse and Violence Prevention, the Faith Action Network, the Washington State Council of Firefighters and others. The sponsors, it said, "do it by creating a new 27 percent tax passed on to consumers." "Ask yourself: when was the last time a big corporation spent millions, twice, to try and save us money?"
They also warned about access. "1183 allows more than four times as many liquor outlets," the argument said, and it cited the federal government: "The Centers for Disease Control recently came out against privatization because it leads to a 48 percent or more increase in problem drinking." It closed: "It's too risky, and too high a price to pay for a little convenience."
The lineup was mostly businesses on both sides. Seattle Business magazine listed Costco, Safeway, the Washington Restaurant Association and the Association of Washington Business as supporters. Opponents included the Washington Beer and Wine Wholesalers, the Washington Food Industry Association and the United Food and Commercial Workers union, which represented state store clerks. The largest opposition donor was the national distributors' group, the Wine & Spirits Wholesalers of America, which gave $9.4 million, according to disclosure records.
In October 2011 Costco wrote one check for $8.9 million. "In Washington initiative politics, $1 million checks from deep-pocketed interests are fairly common. But an $8.9 million single contribution? Now that's historic," KNKX reported.
The state's own forecast
The most specific predictions came from the budget office, whose store forecast would land within six licensees of the fiscal 2014 count. Its assumption for sales was this: "Retail liquor liter sales are estimated to grow 5 percent from increased access to liquor."
On price, the budget office assumed shoppers would end up paying the new fees. It added them to its markup assumptions and wrote that "academic research supports an assumption that, in the aggregate statewide, the value of the new liquor distributor and retailer license fees will be passed on to the consumer in the private market markup."
On revenue, it said the total "cannot be precisely estimated because the private market will determine bottle cost and markup for spirits." Its range was an increase of $216 million to $253 million for the state General Fund. For local governments, it was an increase of $186 million to $227 million. Both ranges were "over six fiscal years."
Not everyone expected much change in access. The Washington Policy Center, a Seattle free-market think tank, wrote before the vote that even with the initiative, Washington "would still rank among the top five states for restrictive access to liquor sales." Stateline noted that "West Virginia was the last state to privatize its retail liquor business, and that happened 20 years ago."
On November 8, 2011, the measure passed. The certified count was 1,128,904 to 793,026, or 58.74%.
The Associated Press wrote that night that "It's not clear whether the measure will lead to lower liquor prices." A combined markup of about 25% by distributors and retailers would keep prices where they were, it reported. The AP added: "The state projects that markups could be as high as 45 percent while initiative supporters believe that is unrealistic because of the competition the measure will create."
Gregoire and other leading Democrats had opposed the measure. "We remain concerned about the initiative's consequences on public safety," Protect Our Communities said that night. Benoliel said, "The voters overwhelmingly demonstrated that facts trump scare tactics." In a Wine Spectator story published two days later, he said, "By doing away with the state monopoly and inefficiencies, I think the initiative is going to modestly lower prices for consumers."
The last months of the state stores
The state then had seven months to get out of the business. It auctioned the right to sell liquor at its 167 store locations. In that auction, 554 bidders placed 14,627 bids, and the winning bids totaled $30.7 million.
Some winners defaulted, and two live auctions followed. The final total, with the buyer's premium, was $31.9 million. The agency's human resources office delivered about 902 layoff notices over eight months.
A legal challenge ran to the last week. In the final days of May 2012, the state Supreme Court upheld the initiative. Attorney General Rob McKenna said, "Our office argued, and the Court ruled, that all the provisions of Initiative 1183 were related to its single subject, liquor, and that the subject was appropriately disclosed in the ballot title."
The agency would not predict a price. "No one knows what the actual prices are going to be," said Brian Smith, the Liquor Control Board's spokesman. "The marketplace is going to set that."
Neither side changed its price forecast. Benoliel told the AP, "Costco is determined we will be competitive, maybe a little lower, than the state was," while noting, in the AP's paraphrase, that nobody should expect California prices because of Washington's taxes and fees. Jan Gee, president of the Washington Food Industry Association, which had opposed the measure, said, "None of the retail and consumer prices ever reduce."
The AP worked through one bottle. A 750-milliliter Absolut Citron cost $22.95 at a state store, all taxes included. Starting from the distributor's case price and adding an industry-average 20% retail markup, the 17% fee, the 20.5% sales tax and the liter tax, the AP arrived at $33.74. Retailers would set their own markups, so that was one illustration, not a forecast.
Buyers also moved their purchases around the switch. Bars and restaurants stocked up in May, the Spokesman-Review reported, and "Sales dropped about 9 percent in June." In the first weeks, some chains posted shelf prices before tax and some after. "The alcohol and liter-quantity taxes can add $5-$15 per bottle," MyNorthwest reported in July.
What happened to the price of a bottle?
The first state figures showed shoppers paying more on average. The Department of Revenue reported that "The average retail price of a liter of spirits, including taxes, was $24.09 in September, compared to $21.58 at state liquor stores a year earlier," the AP wrote in December 2012. That is about $2 more for a 750-milliliter bottle. The Reason Foundation, a libertarian think tank, calculated the rise as 11.6%.
An average across every bottle sold can move because shoppers buy a different mix of bottles, not only because prices change. Researchers at the Alcohol Research Group, part of the Public Health Institute, held the brands fixed.
Kerr, Williams and Greenfield priced a set of popular brands in 33 Washington stores in late 2013 and early 2014. They compared those prices with state-store prices from early 2012. Washington prices rose 15.5% for 750-milliliter bottles and 4.7% for 1.75-liter bottles, "while only small changes were seen in the bordering states of Oregon and Idaho," whose comparison prices came from state stores.
The larger bottle was the exception. Prices at Oregon's state stores rose 5.5% over the same period, and the authors wrote that Washington's 1.75-liter increase "is similar to the increase in Oregon control system stores suggesting little impact of privatization."
Where you shopped mattered. "Liquor Superstores had a non-significant 3.9% increase in prices while the largest increase is found among smaller Liquor Stores at 27.2%," the authors wrote.
Did prices settle back as competition matured? A follow-up by Williams, Kerr and Barnett went back to Washington stores in 2016.
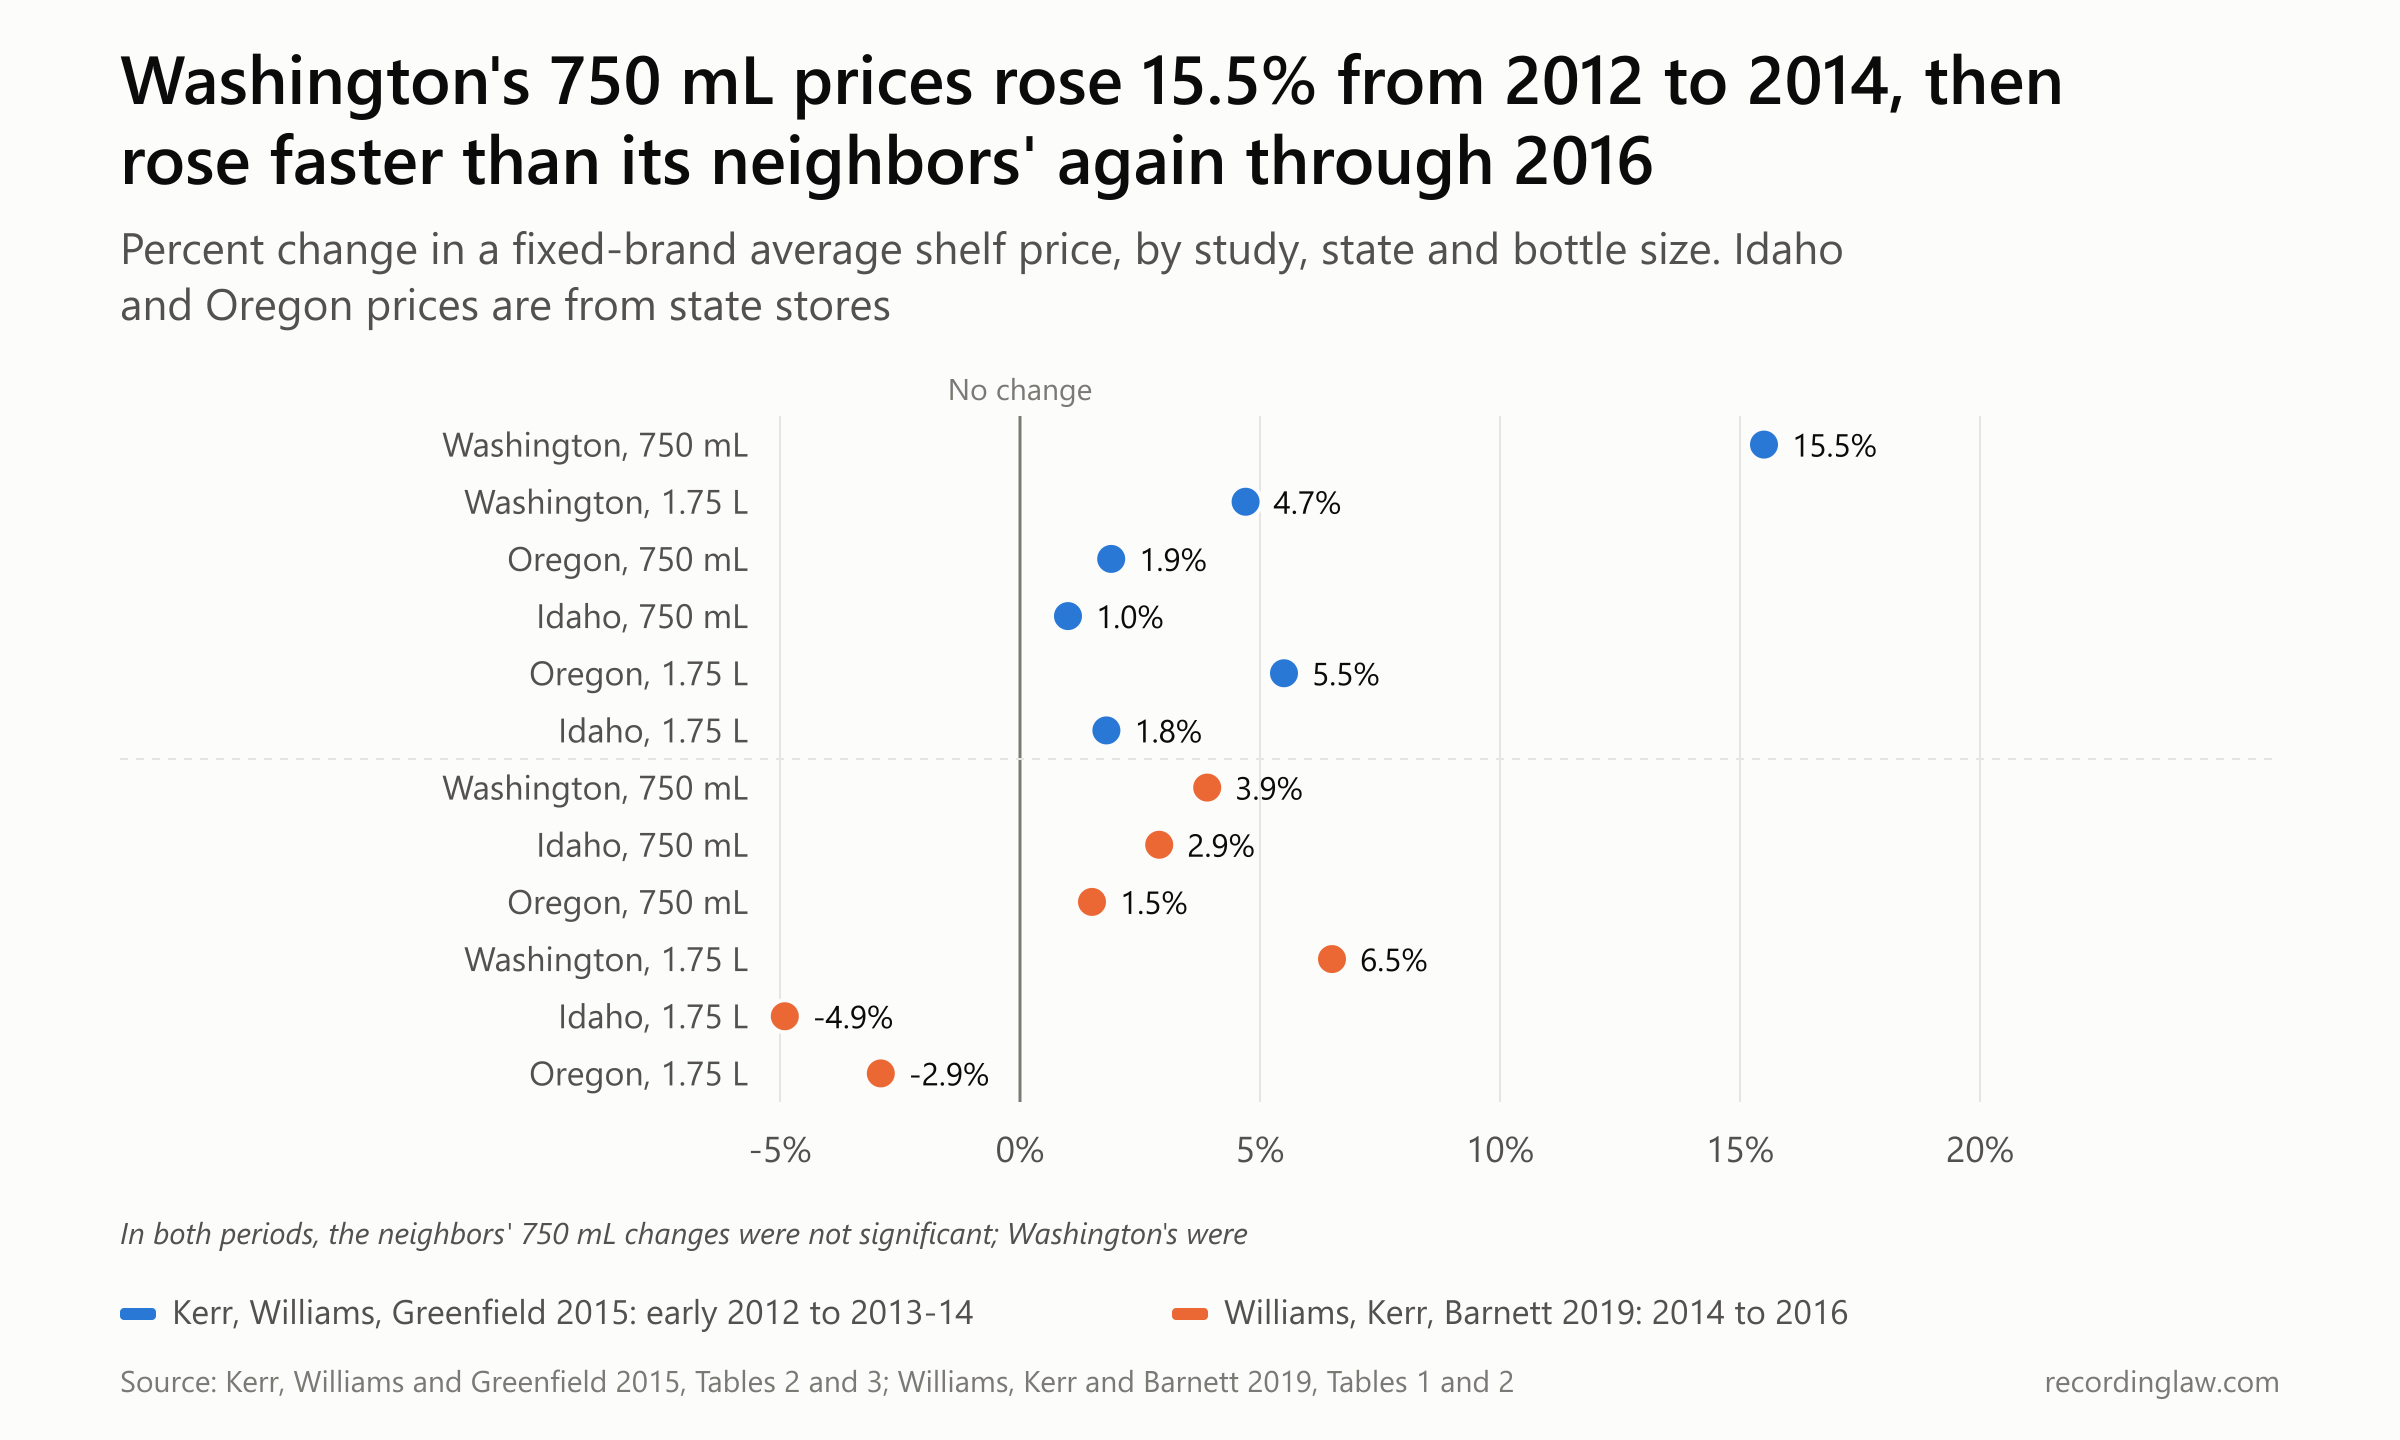
Sources: Kerr, Williams and Greenfield 2015 (Tables 2 and 3); Williams, Kerr and Barnett, Alcoholism: Clinical and Experimental Research, 2019, Tables 1 and 2. Idaho and Oregon prices are from state stores.
| Study and period | State | 750 mL | 1.75 L |
|---|---|---|---|
| Kerr, Williams, Greenfield 2015: early 2012 to 2013-14 | Washington | +15.5% | +4.7% |
| Kerr, Williams, Greenfield 2015: early 2012 to 2013-14 | Oregon | +1.9% | +5.5% |
| Kerr, Williams, Greenfield 2015: early 2012 to 2013-14 | Idaho | +1.0% | +1.8% |
| Williams, Kerr, Barnett 2019: 2014 to 2016 | Washington | +3.9% | +6.5% |
| Williams, Kerr, Barnett 2019: 2014 to 2016 | Idaho | +2.9% | -4.9% |
| Williams, Kerr, Barnett 2019: 2014 to 2016 | Oregon | +1.5% | -2.9% |
From 2014 to 2016, Washington prices rose faster than its neighbors' for both bottle sizes. For 750-milliliter bottles, only Washington's change was statistically significant. In these studies a change is called statistically significant, meaning by the study's own test, chance alone would rarely produce a result this far from no difference if there were truly none; it does not measure size or importance.
Before the switch, from January to May 2012, Washington state stores had averaged $20.81 for a 750-milliliter bottle, about $2 to $3 more than Idaho ($17.85) and Oregon ($18.76). By 2016 the gap was $6 to $7 for a 750-milliliter bottle and $8 to $12 for a 1.75-liter one.
These studies were funded by the National Institute on Alcohol Abuse and Alcoholism. The authors also disclosed "funding through contracts and travel support from the National Alcohol Beverage Control Association," the association of states that still control liquor sales. Their samples came from stores in western Washington counties.
Taxes are a large part of the shelf price. Washington's spirits excise rate was estimated at $33.54 a gallon in 2016, the highest in the country, according to a Tax Foundation figure cited in the 2019 study. In 2012 David Ozgo of the Distilled Spirits Council, the distillers' trade group, told the Tax Foundation that "the total tax burden will approach the equivalent of a 100 percent sales tax" on many products.
By early 2013 Costco described the campaign's promise differently. "The initiative made liquor, on average, 13 to 14 percent pricier," Spokane's Inlander wrote, without naming the source of that figure. Benoliel told the paper that "the proponents of the initiative never claimed it would reduce prices."
The pamphlet argument had made no price promise for liquor. Benoliel's own forecast, two days after the vote, had been for modestly lower prices. If bottles cost more, did Washington buy and drink less?
Did Washington drink more?
Prices rose, and so did sales inside the state. The budget office counted 26.1 million liters sold at retail in fiscal 2011, the last full year of state stores.
Retail liters rose 6.6% in fiscal 2012, which included the first private month. They rose another 13.6% in fiscal 2013, the first full private year, to 31.6 million. The 2011 statement had assumed 5% growth from easier access, on top of the normal 3% growth already in its forecast and less a decrease it expected from higher prices.
The budget office's 2015 evaluation found the jump statistically significant and offered an explanation: "The demand shift is probably related to the lower transaction cost of shopping for retail alcohol -- consumers experience lower travel costs, lower search costs and, in general, an increase in convenience." It also named a confounder, "the ending of the Great Recession," and added, "We do not have sufficient data to fully test the transaction cost hypothesis." The budget office was naming a confounder, something other than the law that differs between the groups compared, or changed around the same time, and could explain some or all of the difference.
Some of the buying had moved across the state lines. Ye and Kerr, of the Alcohol Research Group, found liquor sales rose 10.4% in Oregon counties on the Washington border and 11.7% in Idaho's, against 2.3% and 3.4% in counties away from the border. Counting those trips, they estimated, per capita spirits sales to Washington residents did not change in the first year and fell slightly in the second. "This shows that the effects of increased prices and availability, working in opposite directions, appear to have been of about the same magnitude in the years following privatization," Kerr said.
The federal government's long-running consumption series shows a similar shape. Did Washington's per-person spirits drinking break from its neighbors' after June 2012?
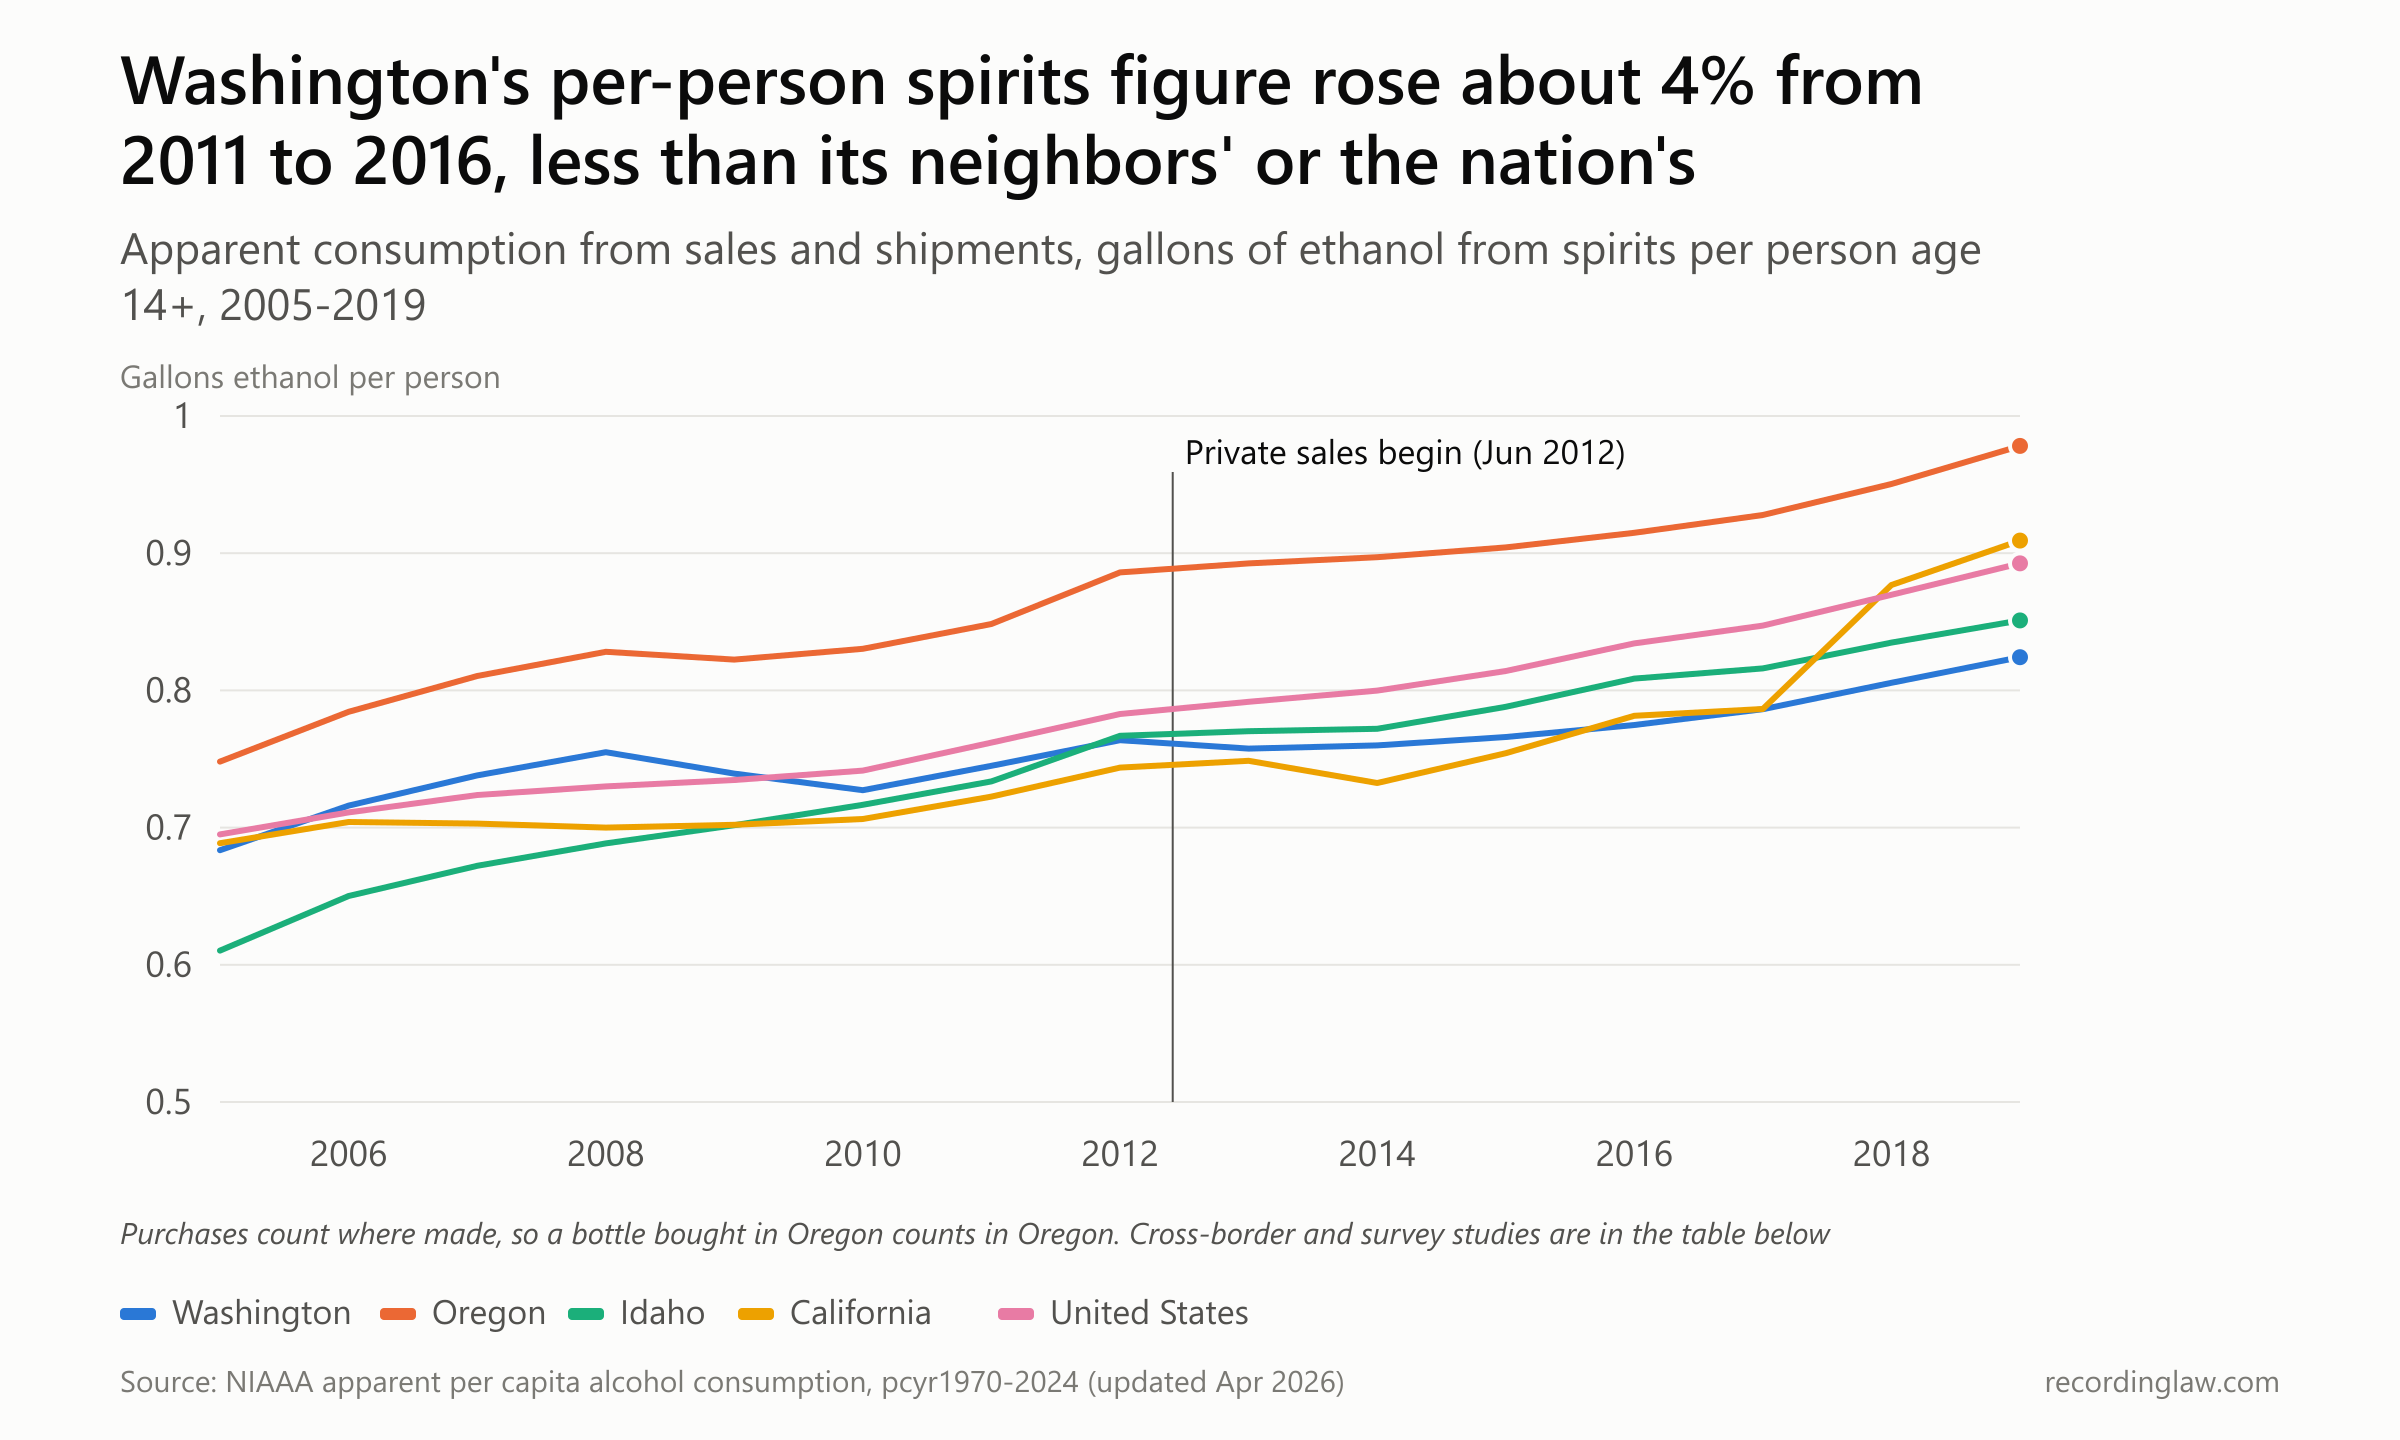
Source: National Institute on Alcohol Abuse and Alcoholism, apparent per capita alcohol consumption file pcyr1970-2024 (updated April 2026).
| Spirits ethanol per person 14+ (gallons) | 2011 | 2012 | 2016 | 2019 | Change 2011 to 2016 |
|---|---|---|---|---|---|
| Washington | 0.7451 | 0.7637 | 0.7748 | 0.8242 | +4.0% |
| Oregon | 0.8484 | 0.8860 | 0.9149 | 0.9782 | +7.8% |
| Idaho | 0.7337 | 0.7669 | 0.8086 | 0.8510 | +10.2% |
| California | 0.7226 | 0.7438 | 0.7815 | 0.9092 | +8.2% |
| United States | 0.7619 | 0.7828 | 0.8342 | 0.8926 | +9.5% |
It did not rise faster. Washington's spirits figure rose about 4% from 2011 to 2016, less than Oregon, Idaho, California or the national figure. This series counts sales and shipments where they happen, so a bottle a Washington resident bought in Oregon counts in Oregon.
Spirits are only part of what people drink. Across beer, wine and spirits together, Washington's figure was 2.25 gallons of ethanol per person in 2011 and 2.25 in 2016.
Source: NIAAA apparent per capita alcohol consumption file pcyr1970-2024 (updated April 2026).
| All-beverage ethanol per person 14+ (gallons) | 2011 | 2016 | 2019 |
|---|---|---|---|
| Washington | 2.2471 | 2.2540 | 2.2242 |
| Oregon | 2.5913 | 2.7537 | 2.7138 |
| Idaho | 2.1765 | 2.1452 | 2.0406 |
| California | 2.2526 | 2.3411 | 2.5670 |
| United States | 2.2938 | 2.3538 | 2.3765 |
Asking people gives a third reading. A survey of Washington residents by Kerr and colleagues, as summarized in the 2019 study, "found no significant change in alcohol (spirits, wine, and beer) volume defined as drinks per month, a significant decrease in spirits volume, and a reduction of heavy drinking (5+ drinks) days."
| Reading of Washington drinking | Source | What it showed |
|---|---|---|
| Retail liters sold in Washington stores | Budget office, 2015 evaluation | +13.6% in fiscal 2013 over fiscal 2012 |
| Spirits ethanol per person 14+, sales-based | NIAAA | +4.0%, 2011 to 2016 |
| Spirits sales to residents, counting cross-border trips | Ye and Kerr, via the Alcohol Research Group | no change in the first year, slightly lower in the second |
| Self-reported drinks per month | Kerr and colleagues' survey, via the 2019 study | no significant change; spirits volume down |
The opponents' pamphlet had cited the CDC on a "48 percent or more increase in problem drinking." The CDC-supported Community Preventive Services Task Force did recommend in 2011 "against the further privatization of alcohol sales."
Its page reports a different measure: "a 44.4% median increase in per capita sales of privatized alcoholic beverages," across studies of privatizations from 1950 to 2000 in the United States, Canada and Finland. That figure is the median, the middle value when all are lined up in order. Washington's sales-based spirits figure did not show a rise of that size.
Writing in April 2013, before the health studies, the Reason Foundation said opponents' fears "have not materialized." One study later did find a change in harm.
Aryn Phillips and colleagues at UC Berkeley, Northwestern and the Alcohol Research Group compared 39 Washington counties with 36 Oregon counties from 2010 to 2014. Researchers call that design difference-in-differences, and it measures how much Washington changed beyond what Oregon did over the same quarters. Accidental-injury hospitalizations rose 0.289 per 1,000 residents per quarter more in Washington's metro-urban counties than in Oregon's. The authors translated that to 17,498 additional hospitalizations over two and a half years.
The result held with other comparison states, the authors reported. They found no differential change, meaning no change in Washington beyond what Oregon did, in hospitalizations for alcohol-related disorders. Nor did they find a differential change in injury hospitalizations in nonmetropolitan-urban or rural counties.
The study counts all accidental injuries, not only those coded as alcohol-related. It was funded by NIAAA, the CDC and the National Institute of Diabetes and Digestive and Kidney Diseases, and the authors reported no conflicts of interest.
Two other changes overlap every one of these comparisons. Washington voters legalized recreational marijuana in November 2012, effective December 6, 2012, and the state's beer excise tax was temporarily raised from 2010 to 2013. No study here isolates privatization from those changes.
Where did the money go?
The state stopped running stores, and its liquor agency cost far less to run. The budget office found the Liquor Control Board spent about $56.4 million to administer the new system in the 2013-14 biennium. In the 2011-12 biennium before privatization, it had spent $244.9 million. The budget office called that "a 77 percent reduction in LCB costs."
Revenue moved to new collectors. The Department of Revenue now collects the 20.5% spirits sales tax and a liter tax of $3.7708, and the Liquor Control Board collects the license fees. The budget office's evaluation found retail liquor revenue collections of $181.7 million in fiscal 2011 and $230.0 million in fiscal 2014. Those are total collections, not the six-year increase the 2011 forecast described.
Spirits taxes owed on sales to consumers kept growing for most of a decade. They were $229 million in fiscal 2013, the first full private year. They peaked at $371 million in fiscal 2021 and were $335 million in fiscal 2026. The license-fee income the Liquor Control Board reports as "spirit fees" grew separately.
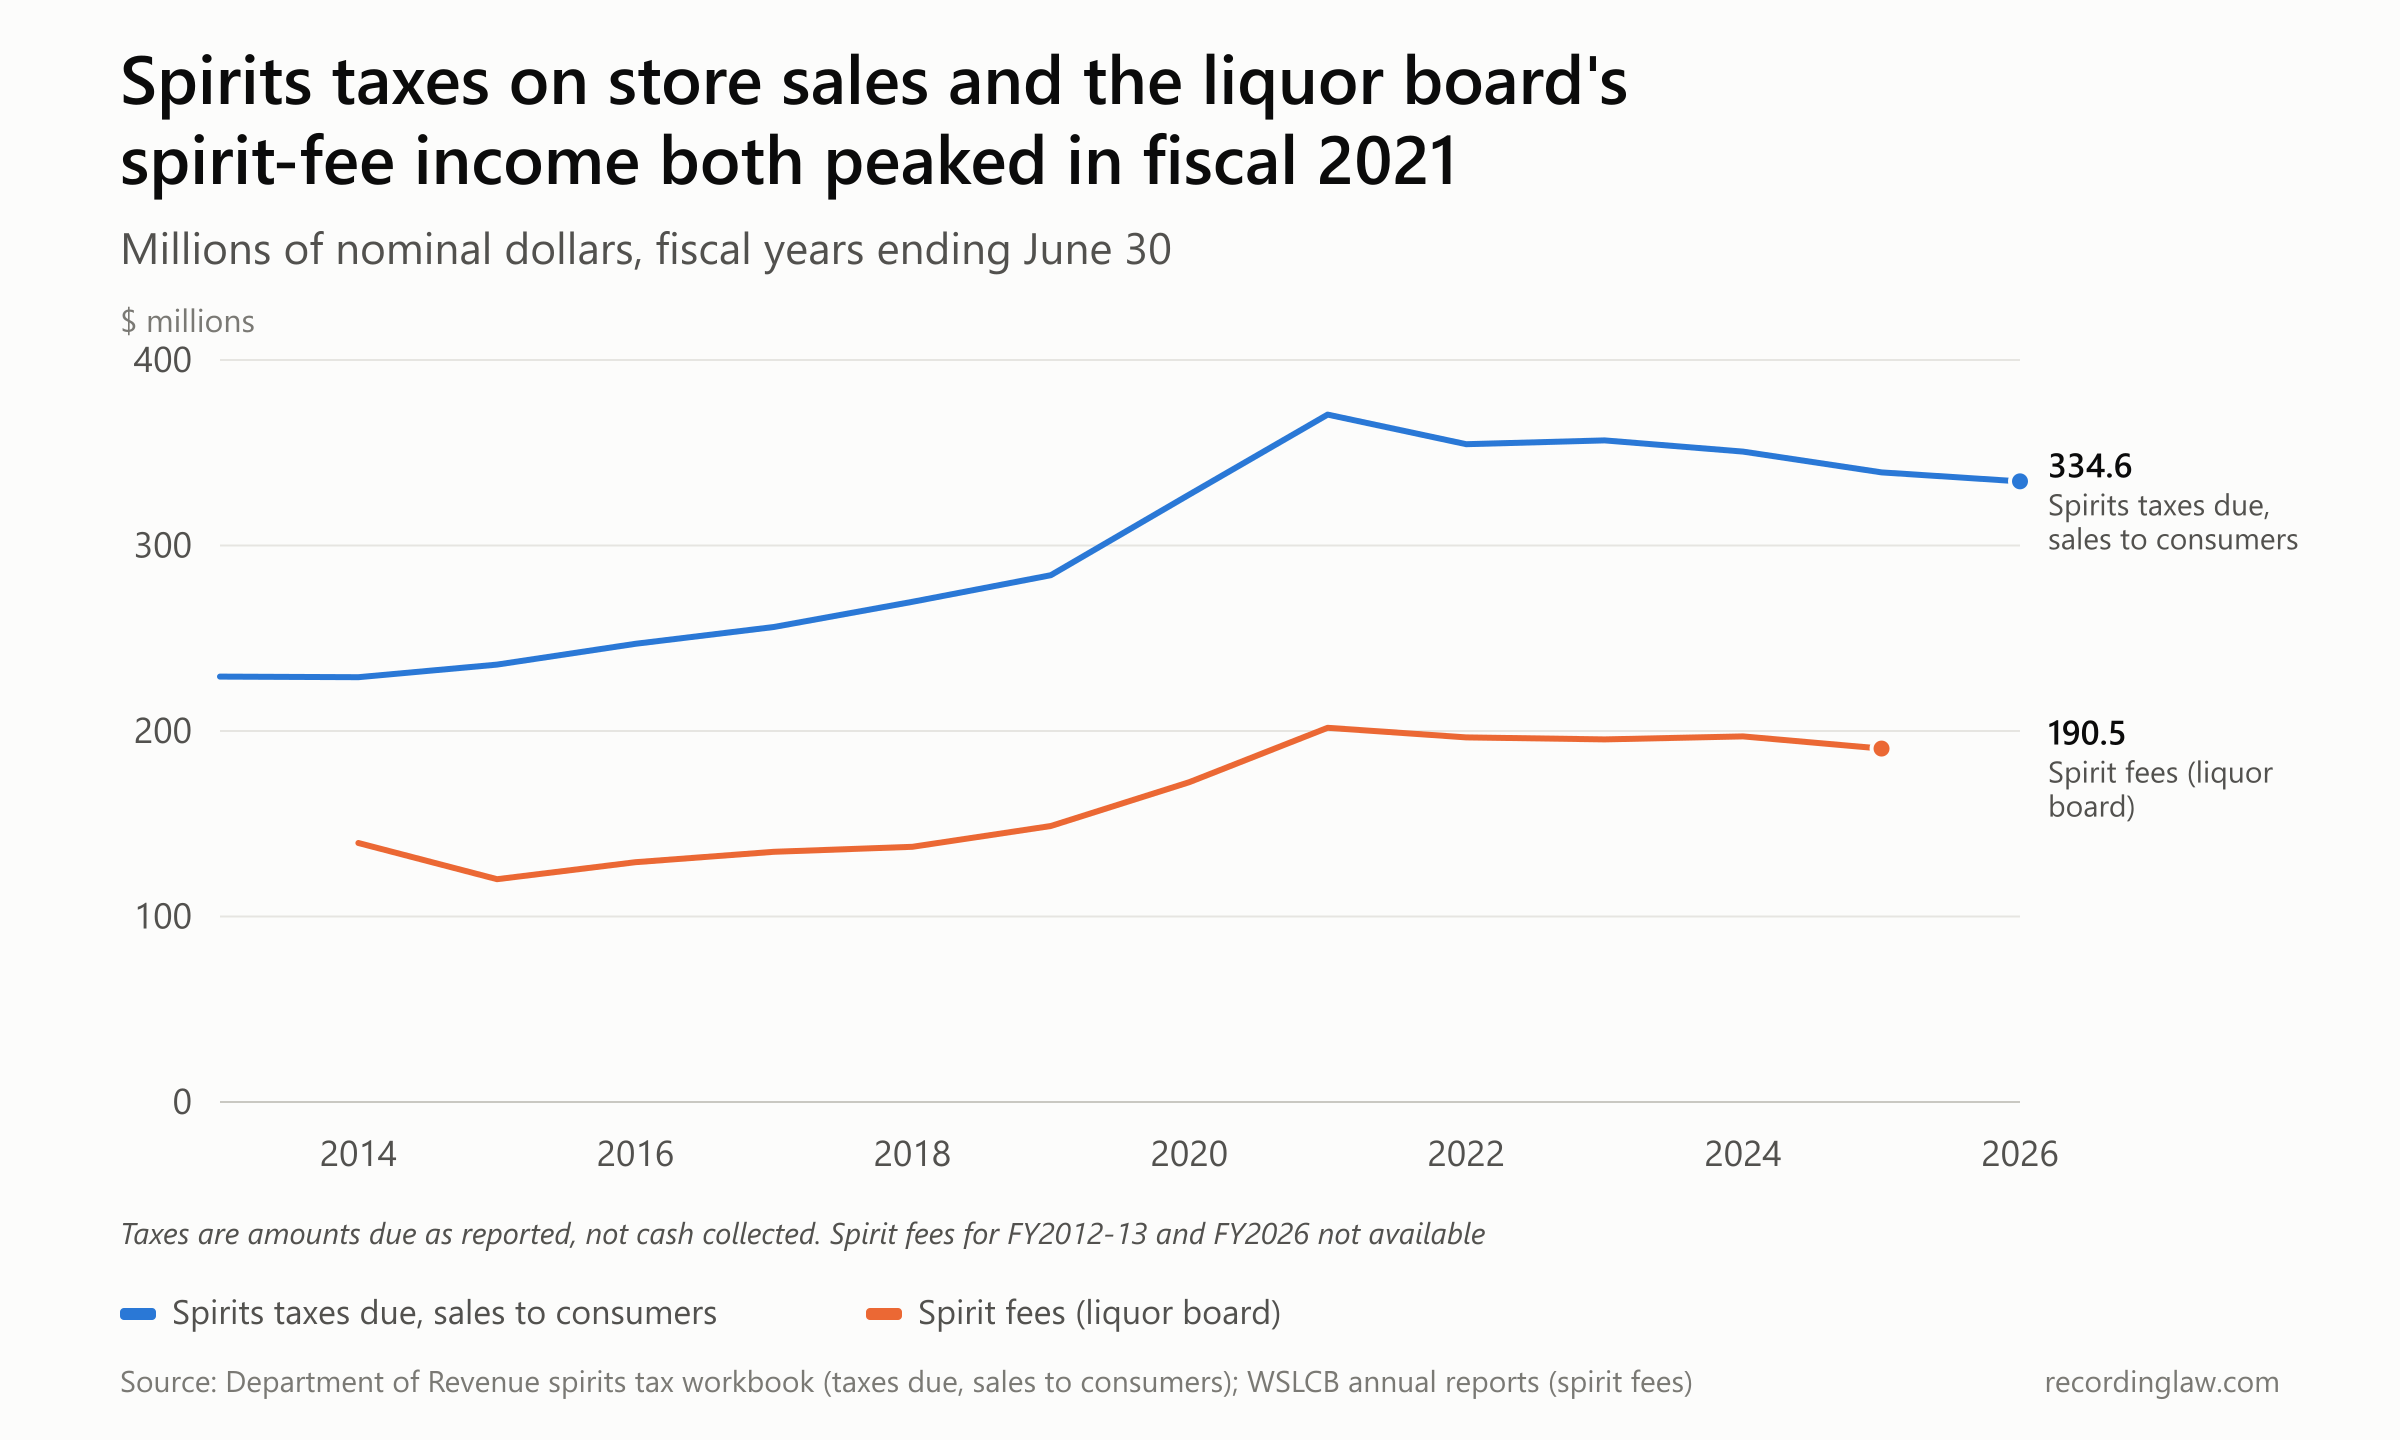
Sources: Department of Revenue spirits tax workbook (taxes due, FY2013 to FY2026); Washington State Liquor and Cannabis Board annual reports (spirit fees, FY2014 to FY2025). Nominal dollars.
| Fiscal year | Spirit fees (millions, nominal) | Spirits taxes due to DOR, sales to consumers (millions, nominal) |
|---|---|---|
| 2014 | $139.6 | $229.0 |
| 2016 | $129.3 | $247.1 |
| 2019 | $148.8 | $284.0 |
| 2021 | $201.7 | $370.5 |
| 2025 | $190.5 | $339.5 |
| 2026 | not yet reported as of November 2026 | $334.6 |
Fee income rose from $139.6 million in fiscal 2014 to $190.5 million in fiscal 2025, in dollars not adjusted for inflation.
Who received the money became its own fight. In fiscal 2014 the board reported returning $201.7 million to state and local funds, including $141.9 million to the state General Fund and $49.5 million to cities and counties.
Officers of the Association of Washington Cities wrote in 2014 that in 2012 "Lawmakers diverted more than $100 million in liquor revenue from cities and counties to the state’s general fund." That figure is the association's. The state budget documents cited here do not break it out.
By 2014, some voters had second thoughts. In a telephone survey of 1,202 Washington adults that year, Meenakshi Subbaraman and Kerr found that "those who voted Yes on I-1183 had almost eight times the odds of wanting to change their votes compared with those who voted No." The group's release said about 20% of yes voters had changed their minds. "It seems that voters had a strong reaction to seeing liquor in many types of stores where it wasn’t available before," Kerr said.
No vote to undo it followed. The Reason Foundation noted in 2013 that "no state has ever shifted from a private regime to a state-run liquor monopoly."
Fourteen years later
Retail spirits sales kept climbing for most of the decade after the switch, then turned down.
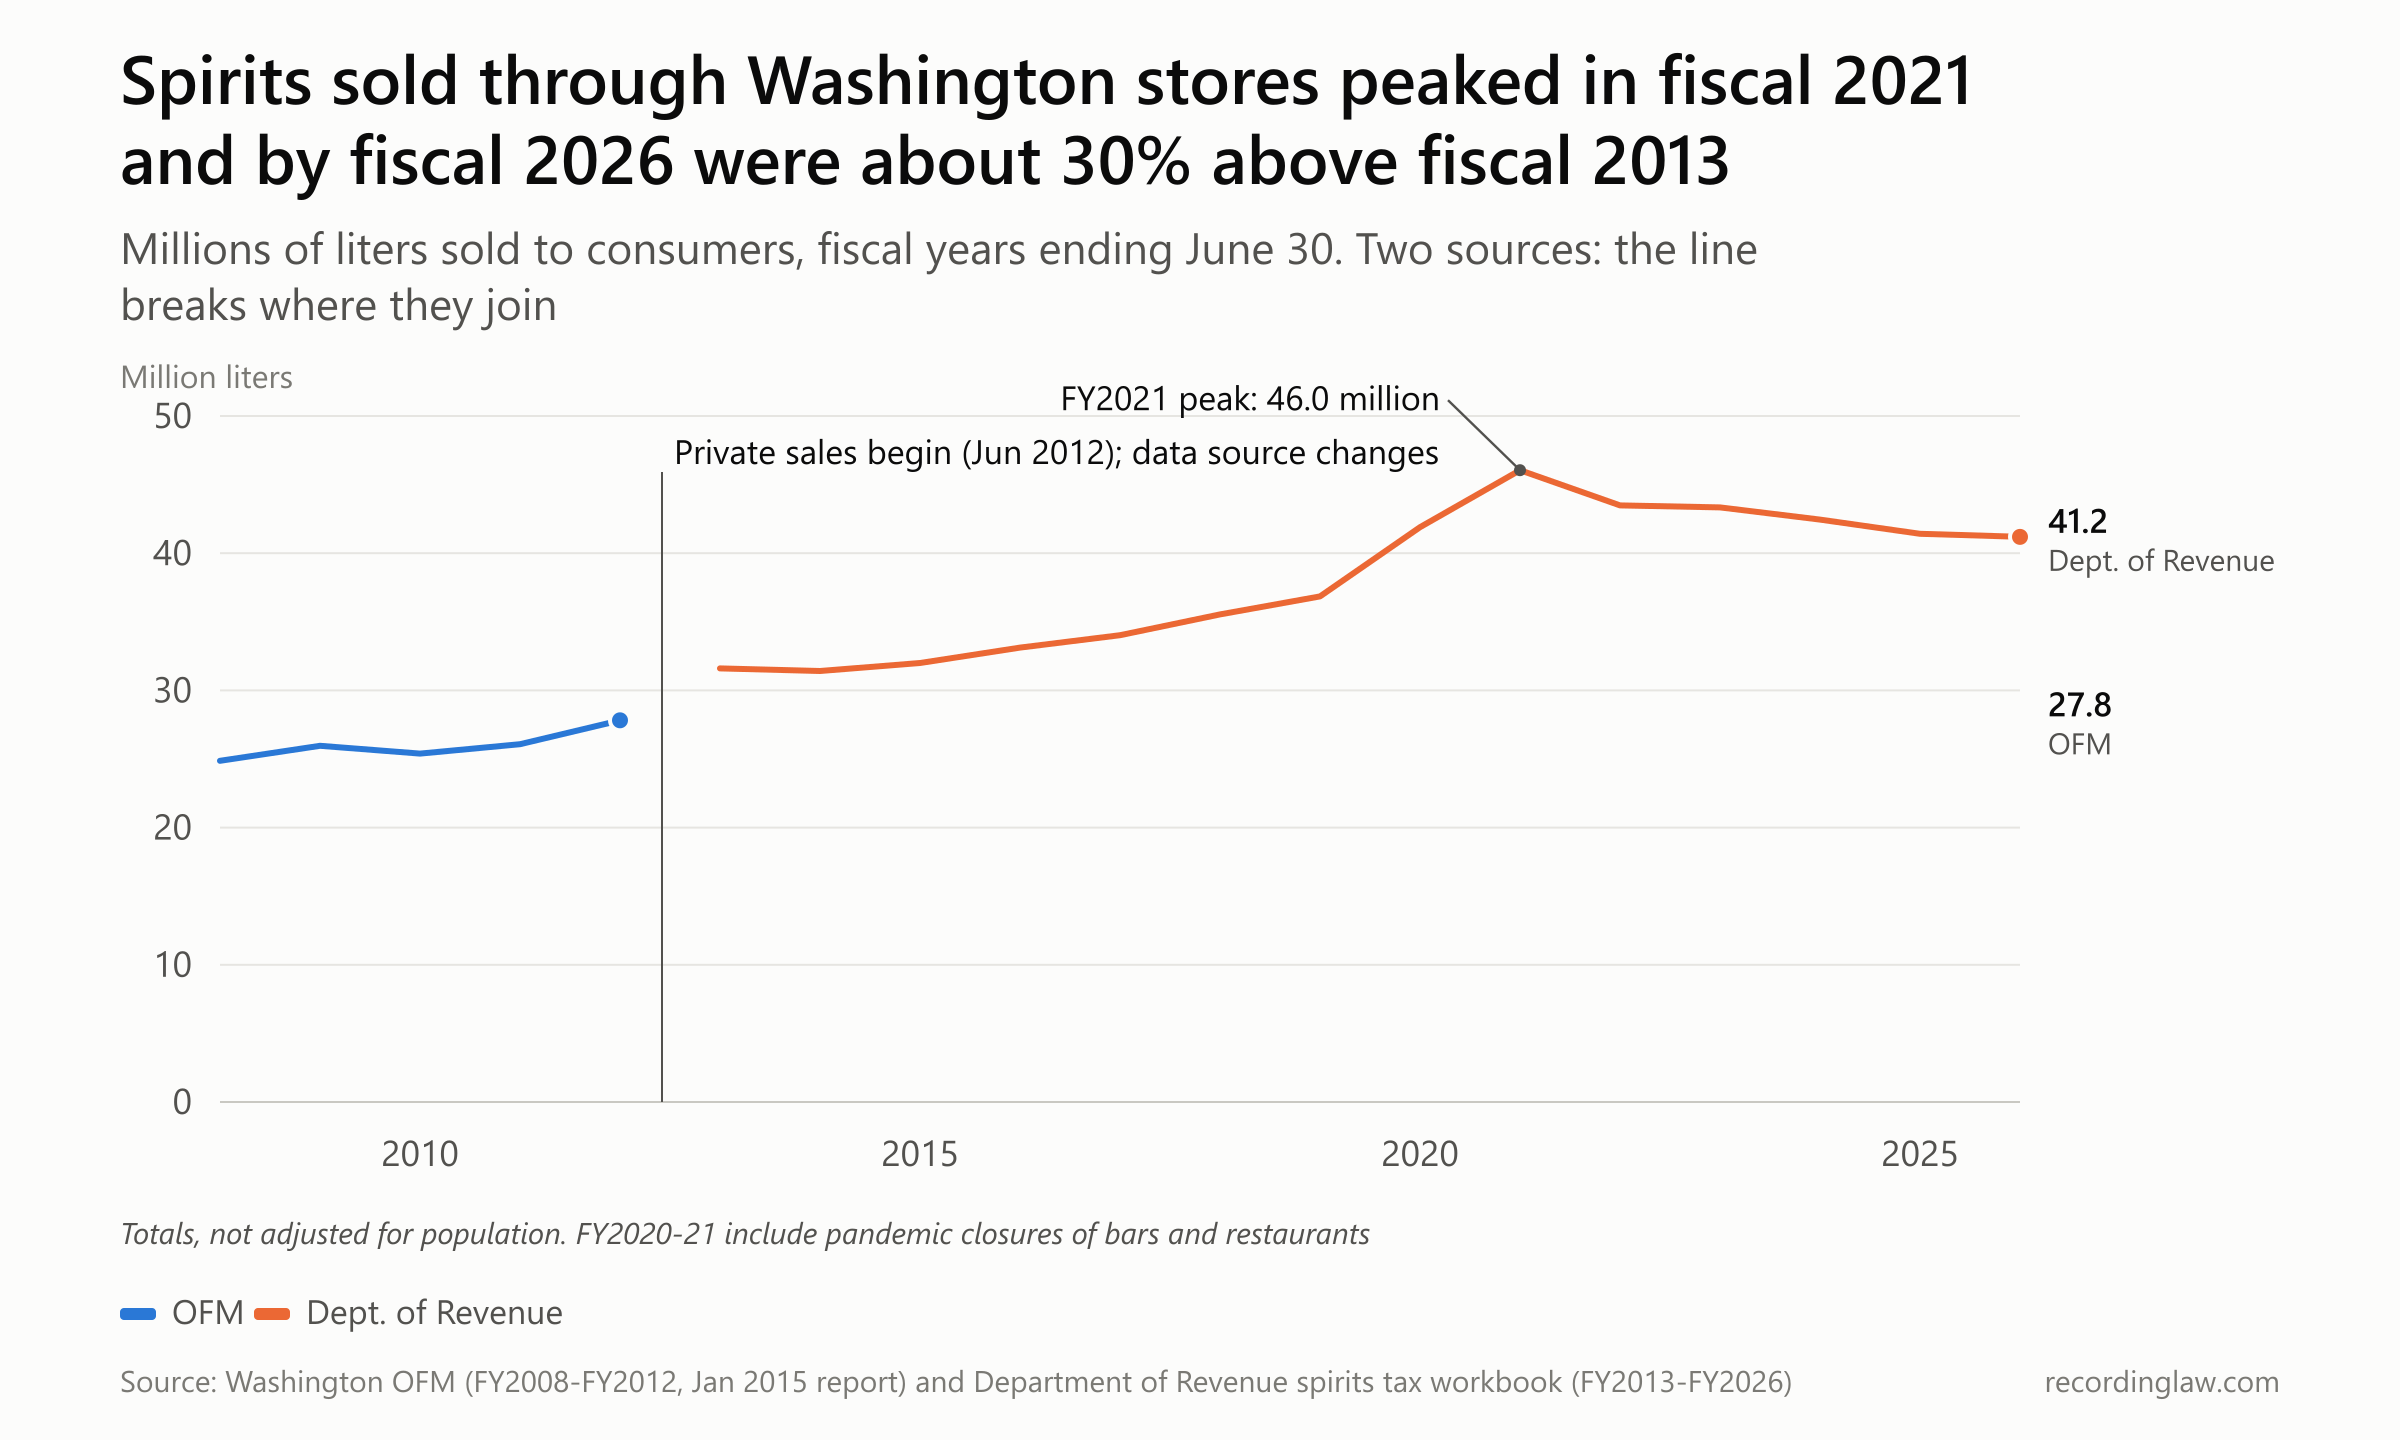
Sources: Washington Office of Financial Management, January 2015 (FY2008 to FY2012) and Department of Revenue spirits tax workbook (FY2013 to FY2026). The line breaks where the two sources join; they differ slightly where they overlap. Privatization began June 1, 2012.
| Fiscal year | Retail liters sold | Source |
|---|---|---|
| 2008 | 24,871,537 | OFM |
| 2011 | 26,082,837 | OFM |
| 2012 | 27,816,430 | OFM (includes June 2012) |
| 2013 | 31,613,000 | DOR (OFM: 31,600,493) |
| 2019 | 36,854,000 | DOR |
| 2021 | 46,049,000 | DOR |
| 2026 | 41,185,000 | DOR |
Liters sold to consumers through stores peaked at 46.0 million in fiscal 2021. In that year bars and restaurants were closed or limited during the pandemic, and their own spirits purchases fell to about 6 million liters. By fiscal 2026 the stores sold 41.2 million liters, about 11% below that peak and about 30% above fiscal 2013. These are totals, not adjusted for population.
The average price also rose and then eased. Spirits sold to consumers averaged $24.22 a liter after tax in fiscal 2013, $30.16 in fiscal 2024 and $29.34 in fiscal 2026, in dollars not adjusted for inflation, according to the Department of Revenue's quarterly workbook. Shoppers paid about $1.2 billion for spirits, taxes included, in fiscal 2026.
Some of the 2012 fights have since closed. In June 2012 the coalition that backed the initiative, including Costco, the Washington Restaurant Association and the Northwest Grocers Association, sued the Liquor Control Board over a rule limiting retailer sales to restaurants to 24 liters in a single day. "We want options in the marketplace," Bruce Beckett of the Restaurant Association told the Inlander in 2013. The Legislature removed the 24-liter limit in 2025 with House Bill 1636, which passed 91-5 and 41-8 and took effect July 27, 2025.
Washington's spirits tax still tops the national list. In January 2026, the Tax Foundation listed its spirits excise rate at $36.68 a gallon, ahead of Oregon at $23.74, using rates from the Distilled Spirits Council and the federal Alcohol and Tobacco Tax and Trade Bureau.
In 2025 the state Senate voted 44-5 for Senate Bill 5368. The bill "Directs the Washington State Institute for Public Policy to conduct a study and produce a report on the state's system of alcohol taxation and fees," with a report due June 30, 2026.
It stalled in the House. On January 12, 2026, the Senate kept it on hold in its Rules Committee. As of November 10, 2026, the bill history shows no action after that date, and no institute report has appeared.
On the first day, the Issaquah Reporter's arithmetic put a bottle of Captain Morgan about $1 above the state-store price. The researchers' last fixed-brand price count, in 2016, found 750-milliliter bottles costing $6 to $7 more in Washington than in Idaho and Oregon, where liquor was still sold through state-controlled stores.
How we measured
Stores. The before count (333: 167 state and 166 contract stores) is from Williams, Kerr and Barnett (2019). The state's own pre-privatization counts were 328 in the 2011 fiscal impact statement and 329 in the budget office's 2015 table. Fiscal 2012 to 2014 counts are the Liquor Control Board's "Spirits Off Premise" licensee rows in its FY2014 annual report. The 2016 figure is active licenses from the 2019 study. After fiscal 2014 the board's reports merge spirits retail into broader categories, so there is no like-for-like series after that, and the board's later reports do not publish one. "About five times" is 1,694 divided by 333 (5.1); "more than four times" is 1,415 (fiscal 2013) or 1,422 (fiscal 2014) divided by 333 (4.2 and 4.3).
Prices. The two price studies are store samples (33 stores in 2014 and 26 in 2016 for 750-milliliter bottles; 31 and 22 for 1.75-liter bottles), drawn from western Washington counties, using fixed brand indexes; Idaho and Oregon prices come from state-store price data. The 2019 paper's abstract swaps the Idaho and Oregon 1.75-liter figures relative to its Table 2; we use Table 2 (Idaho -4.9%, Oregon -2.9%). The 2012-to-2014 Oregon and Idaho 1.75-liter figures (+5.5% and +1.8%) are the 2015 paper's Table 3 state-store rows. The 2012-to-2014 Oregon and Idaho 750-milliliter figures (+1.9% and +1.0%) are the same paper's Table 2 state-store rows. The 2019 paper calls them small and non-significant. The September 2012 comparison ($24.09 against $21.58, 11.6%) is the AP's report of Department of Revenue figures. The Department of Revenue's average price per liter after tax is the workbook's own fiscal-year figure, a simple average of four quarterly averages, across every spirit sold. It is not a fixed basket and is not adjusted for inflation. The budget office's 2015 price series ($22.28 a liter in fiscal 2011, $24.52 in fiscal 2014) does not state whether tax is included and differs from the Department of Revenue's figure for fiscal 2014 ($24.44), so we do not join the two. In a 2014 comparison, California prices were 24.1% lower than Washington's for 750-milliliter bottles and 29.6% lower for 1.75-liter bottles. Per 750-milliliter bottle, the Department of Revenue averages work out to about $18.17 in fiscal 2013 and $22.01 in fiscal 2026 (liter price times 0.75).
Sales. Fiscal years end June 30. Retail liters for fiscal 2008 to 2012 are from the budget office's January 2015 evaluation; fiscal 2013 to 2026 are from the Department of Revenue workbook "SpiritsTax thru Q2_2026" (sheet SalesToConsumers). The two differ slightly for fiscal 2013 and 2014 (31,600,493 against 31,613,000 liters in 2013), and neither explains why. Fiscal 2012 includes one private month, and bars stocked up in May 2012. Fiscal 2020 and 2021 reflect pandemic closures and at-home buying. The 13.6% fiscal 2013 increase is the budget office's figure (fiscal 2012 to fiscal 2013); the peak-to-2026 decline is 46,049,000 to 41,185,000 liters (-10.6%), and fiscal 2013 to 2026 is +30.3%. The fiscal 2026 spending figure of about $1.2 billion is 41,185,000 liters times $29.34 a liter; because that price is an average of quarterly averages, the product is approximate. The budget office's retail liters jumped in fiscal 2013, while the federal per-person spirits figure for calendar 2013 was slightly below 2012. They measure different things on different calendars, and neither source explains the gap.
Taxes and fees. Department of Revenue figures are taxes due as reported by sellers, by quarter of sales activity, not cash collected. "Spirit fees" is the Liquor Control Board's fee income line, not total state alcohol revenue; the board's total liquor income was $260.3 million in fiscal 2025; fiscal 2012 and 2013 fee figures and comparable pre-privatization revenue are not included here. The board's fiscal 2011 "returned" figure included spirits taxes built into the bottle price, which moved to the Department of Revenue in 2012, so it is not comparable across the switch. The budget office's 2015 report restates the 2011 revenue range as a per-year figure. The 2011 statement gave it as a six-year total, and we use the 2011 wording.
Consumption. NIAAA apparent consumption is gallons of ethanol per person age 14 and over, from sales and shipment data by calendar year; purchases count where they are made. Charts end in 2019 because California's spirits series jumps in later years. The all-beverage figures appear as a table only. Through 2024, the latest year in the file, Washington's spirits figure was up about 13% from 2011, close to Oregon's 13.5% and above Idaho's 11%.
The cross-border and self-reported drinking results come from the 2019 study's summary and the Alcohol Research Group's release; the figures are as those sources summarize the original papers. Percent changes are our arithmetic on the NIAAA file (for example, Washington spirits 0.7451 to 0.7748 gallons, +4.0%).
Campaign money. News reports put Costco's 2011 commitment at $22 million to $22.5 million. The Public Disclosure Commission contributions file sums $19,894,656.63 from Costco to the Yes on 1183 Coalition for election year 2011. Neither source explains the difference, which may reflect pledges against receipts or how in-kind support was coded.
Funding of the research. The price, cross-border and voter studies come from the Alcohol Research Group (Public Health Institute), funded by NIAAA; its authors disclosed contract and travel support from the National Alcohol Beverage Control Association, which represents control states. The injury study reported NIAAA, CDC and NIDDK funding and no conflicts. The Reason Foundation, the Washington Policy Center and the Tax Foundation do not name funders on the pages cited.
What the data cannot show. No study here isolates privatization from recreational marijuana legalization (December 2012), the 2010-2013 beer tax change, the recovery from the Great Recession or later pandemic shifts. The store-price studies stop in 2016; no later fixed-basket study is cited here. The injury study is the only one here with a difference-in-differences design. The rest are before-and-after comparisons or comparisons with neighboring states.
What comes next. The Department of Revenue updates its spirits workbook once a quarter; as of November 10, 2026, the newest edition ran through June 2026. The Liquor Control Board, since renamed the Liquor and Cannabis Board, published its fiscal 2025 report in December 2025, and as of November 10, 2026 that was still its newest, so fiscal 2026 figures would be expected around the end of 2026.
Senate Bill 5368 belongs to the 2025-26 Legislature. Whether any lawmaker revives the alcohol-tax study, or a successor to it, is a question for the 2027 session.
Frequently Asked Questions
When did Washington privatize liquor sales?
Voters approved Initiative 1183 on November 8, 2011, with 58.74% of the vote. The state's liquor business closed on May 31, 2012, and private retailers began selling spirits on June 1, 2012.
Did liquor prices go up in Washington after privatization?
Yes, by the measures available. The AP reported Department of Revenue figures of $24.09 a liter including taxes in September 2012 against $21.58 at state stores a year earlier. A store study found prices for a fixed set of brands rose 15.5% for 750 mL bottles from 2012 to 2014, and a follow-up found another 3.9% from 2014 to 2016, more than in Idaho and Oregon. In fiscal 2026 the average after-tax price was $29.34 a liter, in dollars not adjusted for inflation.
Why is liquor so expensive in Washington?
Washington charges a 20.5% spirits sales tax and a liter tax of $3.7708. Initiative 1183 added license fees of 17% on retail sales and 10% on distributor sales in the first two years. The Tax Foundation listed Washington's spirits excise rate at $36.68 per gallon in January 2026, the highest in the country.
How many stores sell liquor in Washington?
Before privatization there were 333 state and contract stores. The Liquor Control Board counted 1,422 spirits off-premise licensees in fiscal 2014, and a 2019 study counted 1,694 active spirits licenses in 2016. The board's later reports do not break out a comparable count.
Did people in Washington drink more after liquor privatization?
Most measures show little change. NIAAA's apparent consumption series counts sales and shipments where they happen. By that measure, Washington's spirits consumption per person age 14 and over rose about 4% from 2011 to 2016, less than in Oregon, Idaho or California, and its all-beverage consumption was flat. Researchers who counted cross-border purchases found spirits sales to residents flat in the first year and slightly lower in the second. A survey found no significant change in drinks per month. Sales at Washington stores rose 13.6% in fiscal 2013 over fiscal 2012.
Did liquor privatization increase injuries in Washington?
A 2020 study comparing 39 Washington counties with 36 Oregon counties found accidental-injury hospitalizations rose 0.289 per 1,000 residents per quarter more in Washington's metro-urban counties. It found no differential change in hospitalizations for alcohol-related disorders, and none in rural counties. Marijuana legalization in December 2012 overlaps the study period.
How much did Costco spend on Initiative 1183?
News reports in 2011 put Costco's commitment at $22 million to $22.5 million, including a single $8.9 million check. State Public Disclosure Commission records show $19,894,656.63 in Costco contributions to the Yes on 1183 Coalition. The opposition's largest donor, the Wine & Spirits Wholesalers of America, gave $9.4 million.
Can Washington restaurants buy liquor from retail stores?
Yes. A 24-liter limit on retailer sales of spirits to bars and restaurants, adopted by the Liquor Control Board in 2012, was removed by House Bill 1636, effective July 27, 2025.
Updates
Reworded for readability. No figures, quotes, sources or findings changed.
Restructured as a feature: chart titles state the finding, side details moved to How we measured. Every figure and quote was re-checked against its source.
Independently fact-checked against the cited primary sources
Independently fact-checked against the cited primary sources
Sources and References
- Washington Secretary of State, 2011 General Election Voters' Pamphlet: Initiative 1183 arguments, Attorney General explanatory statement and OFM fiscal impact statement(digitalarchives.wa.gov).gov
- Washington Secretary of State, November 8, 2011 results: Initiative Measure 1183(results.vote.wa.gov).gov
- Washington Secretary of State, November 2, 2010 results: Initiatives 1100 and 1105(results.vote.wa.gov).gov
- Washington Public Disclosure Commission, Contributions to Candidates and Political Committees (election years 2010 and 2011)(data.wa.gov).gov
- Washington Office of Financial Management, Privatization of Liquor: The Impact of Initiative 1183 (January 2015)(ofm.wa.gov).gov
- Washington Department of Revenue, spirits tax workbook through Q2 2026(dor.wa.gov).gov
- Washington Department of Revenue, spirits taxes and quarterly spirits sales data(dor.wa.gov).gov
- Washington State Liquor Control Board, FY2011 annual report(lcb.wa.gov).gov
- Washington State Liquor Control Board, FY2012 annual report(lcb.wa.gov).gov
- Washington State Liquor Control Board, FY2014 annual report(lcb.wa.gov).gov
- Washington State Liquor and Cannabis Board, FY2025 annual report(lcb.wa.gov).gov
- Washington State Liquor and Cannabis Board, annual reports FY2014 to FY2025 (spirit fees)(lcb.wa.gov).gov
- Washington Attorney General, State Supreme Court rejects challenge to liquor privatization initiative (May 2012)(atg.wa.gov).gov
- Washington Legislature, HB 1636 final bill report (2025)(leg.wa.gov).gov
- Washington Legislature, SB 5368 House bill analysis (2025)(leg.wa.gov).gov
- Washington Legislature, SB 5368 bill history(leg.wa.gov).gov
- National Institute on Alcohol Abuse and Alcoholism, apparent per capita alcohol consumption by state, 1970-2024 (updated April 2026)(niaaa.nih.gov).gov
- NIAAA surveillance reports (Surveillance Report #124)(niaaa.nih.gov).gov
- Community Preventive Services Task Force, Alcohol: Privatization of Retail Alcohol Sales(thecommunityguide.cdc.gov).gov
- Williams, Kerr and Barnett, spirits prices in Washington after privatization, Alcoholism: Clinical and Experimental Research (2019)(pmc.ncbi.nlm.nih.gov).gov
- Kerr, Williams and Greenfield, spirits price changes after privatization in Washington, Alcohol and Alcoholism (2015)(pmc.ncbi.nlm.nih.gov).gov
- Phillips, Rodriguez, Kerr and Ahern, liquor privatization and injury hospitalizations, Addiction (2020)(pmc.ncbi.nlm.nih.gov).gov
- Subbaraman and Kerr, voters' desire to change their I-1183 vote, Journal of Studies on Alcohol and Drugs (2016)(pmc.ncbi.nlm.nih.gov).gov
- Alcohol Research Group, release on Ye and Kerr (2016), cross-border shopping after privatization(arg.org)
- Alcohol Research Group, release on the voter-regret study(arg.org)
- KNKX, Costco contribution to the I-1183 campaign (October 2011)(knkx.org)
- Northwest News Network via KNKX, Washington liquor privatization initiative (October 2011)(knkx.org)
- KNKX, first day of private liquor sales (June 1, 2012)(knkx.org)
- Issaquah Reporter, privatized liquor sales open in Issaquah (June 1, 2012)(issaquahreporter.com)
- Associated Press, election-night story on I-1183 (November 2011)(manufacturing.net)
- Associated Press via KOMO News, Voters approve liquor plan after $22M Costco bet (November 2011)(komonews.com)
- Wine Spectator, Costco wins ballot fight in Washington (November 2011)(winespectator.com)
- Associated Press via KOMO, prices as private liquor stores open (May 2012)(komonews.com)
- Federal Way Mirror, I-1100 and I-1105 (October 2010)(federalwaymirror.com)
- Federal Way Mirror, liquor prices before private sales (May 2012)(federalwaymirror.com)
- Seattle Business, spending on Initiative 1183 (October 2011)(seattlebusinessmag.com)
- Stateline, liquor privatization initiative (November 2011)(stateline.org)
- Spokesman-Review, liquor sales after privatization (September 2012)(spokesman.com)
- MyNorthwest, after-tax shelf pricing (July 2012)(mynorthwest.com)
- Associated Press via Insurance Journal, Department of Revenue liquor price figures (December 2012)(insurancejournal.com)
- Inlander, Battle for the booze (February 2013)(inlander.com)
- Tax Foundation, Washington liquor privatization and taxes (June 2012)(taxfoundation.org)
- Tax Foundation, state distilled spirits excise tax rates (January 2026)(taxfoundation.org)
- Reason Foundation, Annual Privatization Report 2013: liquor privatization(reason.org)
- Washington Policy Center, Citizens' guide to Initiative 1183 (2011)(washingtonpolicy.org)
- Association of Washington Cities officers, op-ed on liquor revenue sharing (July 2014), reprinted by Park Street(parkstreet.com)