How Many Lives Has the Drinking Age of 21 Saved?

Independently fact-checked against primary sources (last audited November 1, 2026). · 15 primary sources cited on this page. How we verify our legal content
Late on June 30, 1988, 19- and 20-year-olds "were bellied up to bars across Wyoming, enjoying one last legal drink before the stroke of midnight," Cowboy State Daily recounted in a 2025 retrospective. At midnight, Wyoming, the last state still holding out, moved its drinking age to 21.
The holdout had cost money. By the outlet's count, Wyoming lost $11.8 million in federal highway funds in 1986 and 1987 and stood to lose $8.2 million more. "We don’t like to be blackmailed by the Federal Government," a spokesman for Gov. Mike Sullivan told The New York Times after the state complied, as Cowboy State Daily quoted him.
The pressure came from a law President Ronald Reagan signed in the Rose Garden on July 17, 1984, after remarks that began at 1:29 p.m. He said raising the age to 21 "will save thousands of young lives." He went further. "Now, raising that drinking age is not a fad or an experiment. It's a proven success."
Forty-two years after that signing, the National Highway Traffic Safety Administration (NHTSA) still credits minimum-drinking-age laws with 31,959 lives saved from 1975 to 2017. That figure does not count people. It comes from a formula that takes a 13% effect, measured in 13 states that raised their ages before the federal law existed, and applies it each year to every death in crashes involving a driver aged 18 to 20.
Two later studies measured the law directly, with different designs, and got different answers. One found the death rate jumps at the 21st birthday. Another found the drop concentrated in the states that moved on their own, not in those that moved after the federal law. Meanwhile, since 2019, the share of tested young drivers killed at a blood alcohol level of 0.08 or higher has climbed back near its 2010-2012 level.
So how many lives has 21 saved, and how would anyone know?
Why did Washington want a drinking age it could not set?
In the early 1970s the states had moved the other way. "Between 1970 and 1975, 29 States lowered their drinking ages to 18, 19, or 20," NHTSA later wrote. "By 1983, safety concerns had led many of these States to reverse course."
Part of that concern came from research. A 1983 study by researchers at the Insurance Institute for Highway Safety, which is wholly supported by auto insurers, reported that where the age had been cut to 18, "significant increases were shown in fatal crashes" involving drivers under 21, compared with neighboring areas that kept the higher age.
The states already at 21 had a different complaint: their teenagers drove across the line. In December 1983, two days after a presidential commission on drunk driving recommended cutting off highway funds, Rep. John Porter of Illinois described the border with Wisconsin, where 19-year-olds could drink. "We call that area 'Blood Border,'" he said, as UPI reported.
The White House did not want the job at first. "We think it should be a state action," spokesman Larry Speakes said that month. Six months later, Transportation Secretary Elizabeth Dole announced that Reagan now backed a bill to cut highway aid to holdout states. "We must raise the drinking age to 21 in all of our states to protect all of our people," she told reporters.
The bill's Senate sponsor, Frank Lautenberg of New Jersey, called it "a modest, but effective, stick." The commission had proposed withholding all federal-aid highway funds; Lautenberg's version took 5% in the first year and 10% after that. The law also never banned drinking under 21. It conditioned the money on states banning purchase and public possession.
Opponents in the Senate argued about the lever as much as the age. "Coercion or incentive; that is the issue," said Gordon Humphrey of New Hampshire, who offered a grant-based alternative he admitted he did not like either. Max Baucus of Montana said his constituents "don't like to be blackmailed by their 'Big Brother' in Washington." James McClure of Idaho called overriding a rule his state had rejected "a terribly dangerous operation."
Patrick Leahy of Vermont asked a different question. "Why the magic age of 21? Why not 25?"
The House had passed its version on a voice vote on June 7, 1984. On June 26, the Senate passed Lautenberg's amendment 81 to 16.
How many lives did each side expect?
Even supporters were unsure how large the effect would be. "There is some question about how much it will reduce them," said Sen. George Mitchell of Maine, a supporter of the measure, before citing an estimate of 1,250 such deaths a year and adding that even a fraction of that would be worth the effort.
The estimates in circulation that summer were far apart. Lautenberg cited the National Transportation Safety Board: "at least 1,250 lives could be saved annually if all States raised the drinking age to 21." The NTSB's own road-safety program director, Barry Sweedler, told the Christian Science Monitor he expected "something in the neighborhood of 700 fewer persons a year" with full compliance. The Monitor summed up the bill's boosters as expecting 700 to 1,000 a year.
Opponents pointed at who was doing the drinking. "84 percent of the highway-related fatalities occur among drivers-drinkers, I should say-whose age exceeds 21," Humphrey said. "This age 21 approach is no magical solution." Sen. Steve Symms of Idaho added that "most of the studies point out that the drivers of age 21 to 24 are the worst offenders."
Reagan answered with three states. "In the State of New Jersey, whose Governor made it a very personal crusade for himself, the rate dropped by 26 percent; Illinois, it has fallen 23 percent; in Michigan, 31 percent." Those three states would come back into the argument two decades later.
How did the holdouts fall in line?
When Reagan signed, he said "less than half" of the states had a 21 law. The count of jurisdictions at 21 (the 50 states plus the District of Columbia) went from 21 at the end of 1984 to all 51 by the end of 1988.
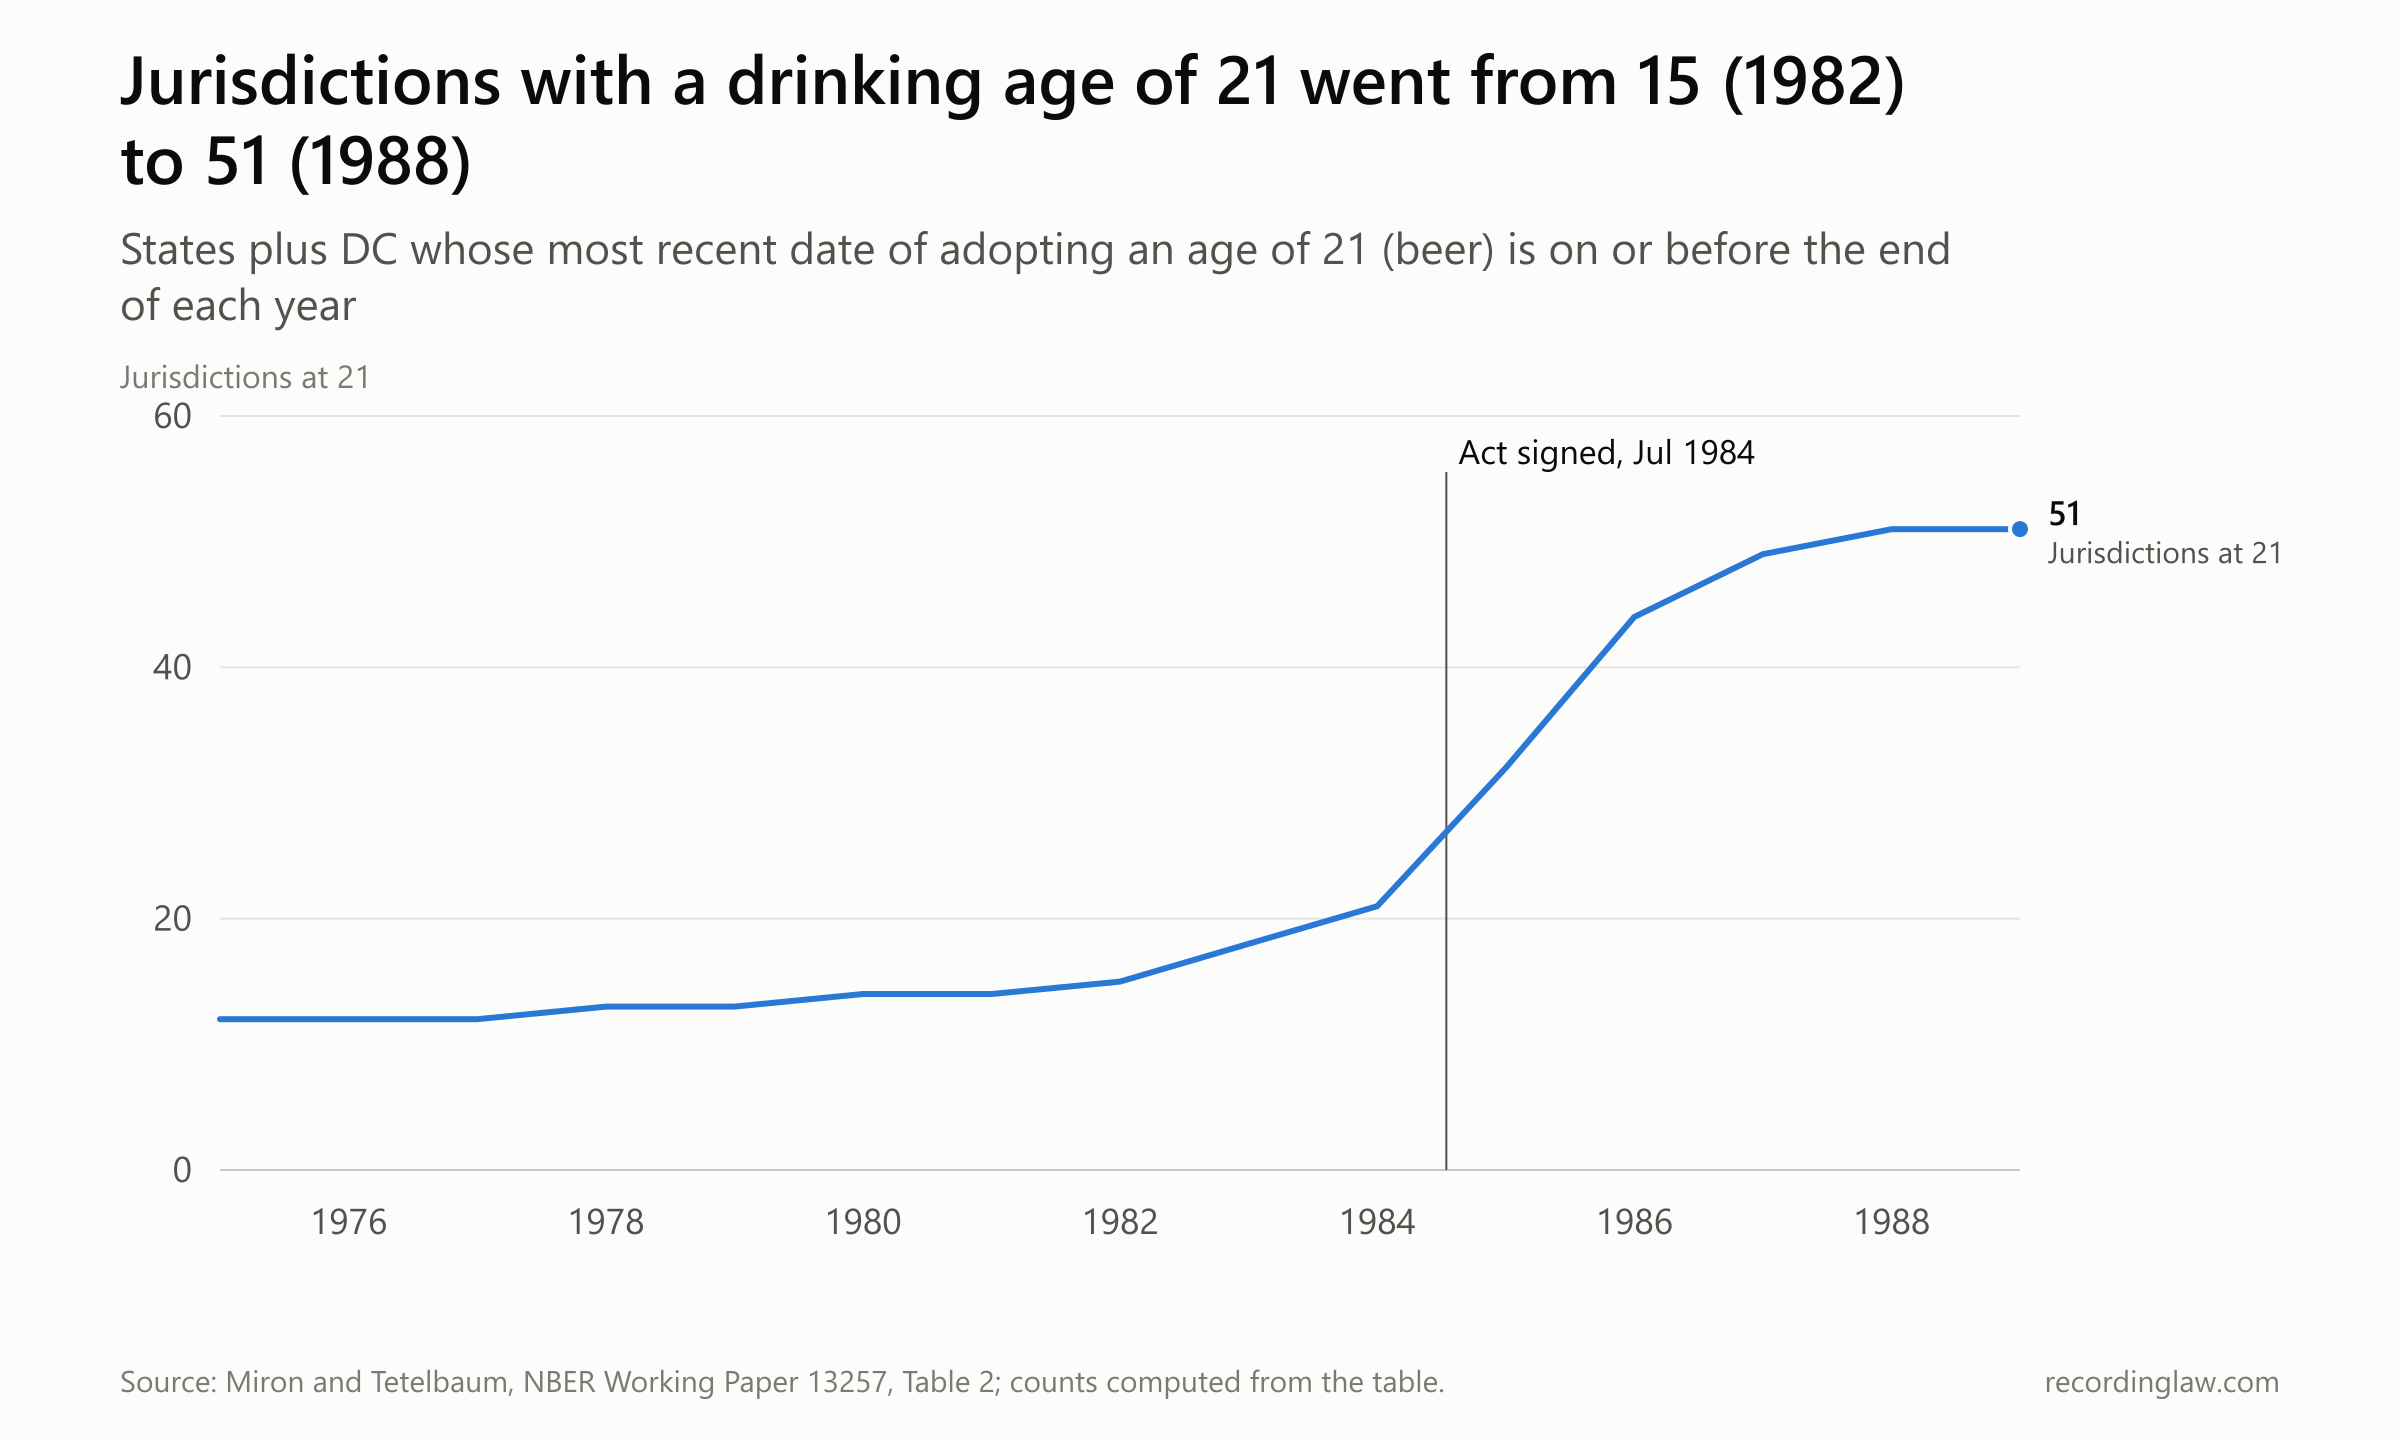
Source: Miron and Tetelbaum, NBER Working Paper 13257, Table 2 (each jurisdiction's most recent date of adopting age 21 for beer).
| Year-end | Jurisdictions at 21 |
|---|---|
| 1975 | 12 |
| 1980 | 14 |
| 1982 | 15 |
| 1983 | 18 |
| 1984 | 21 |
| 1985 | 32 |
| 1986 | 44 |
| 1987 | 49 |
| 1988 | 51 |
Thirty of the 51 moved from 1985 through 1988. New York became the 32nd state at the end of 1985, which the Christian Science Monitor reported would spare it the potential loss of $63.3 million in highway funds over two years. Some states hedged. Colorado, Iowa, Louisiana, Montana, South Dakota, Texas and West Virginia each passed a 21 law that would be repealed if the federal law were held unconstitutional.
South Dakota, which let 19-year-olds buy beer of up to 3.2% alcohol, sued. On June 23, 1987, the Supreme Court ruled 7 to 2 against it. Chief Justice William Rehnquist wrote that Congress had offered "relatively mild encouragement," noting the state stood to lose "only 5% of federal funds otherwise obtainable under certain highway grant programs."
Justice Sandra Day O'Connor, dissenting, quoted Humphrey's 84% and Symms's remark about drivers aged 21 to 24. If the goal was to deter drunk driving, she wrote, the condition was "far too over and under-inclusive." Justice William Brennan, also dissenting, wrote that the drinking age fell within powers the Twenty-first Amendment reserves to the states.
By October 1, 1987, the Monitor reported that every state but Wyoming had heeded the pressure, with Puerto Rico also holding out, though by Miron and Tetelbaum's dates South Dakota's age of 21 did not take effect until April 1988. Wyoming came last, at midnight on June 30, 1988. Puerto Rico is still at 18, NHTSA notes.
The penalty for any state that drops below 21 remains on the books: since fiscal 2012 it has been 8% of certain highway apportionments, each fiscal year. With every state at 21, the remaining question was what the roads would show.
What did the crash records show?
As the states moved, young drivers killed in crashes were less often drunk, and their drop was steeper than among older drivers. NHTSA's Fatality Analysis Reporting System (FARS), the national census of fatal crashes, records the blood alcohol concentration (BAC) of drivers killed in crashes when a test was taken. NHTSA counts a driver at 0.08 or higher as alcohol-impaired. Among drivers aged 18 to 20 killed with a valid test result, the share at 0.08 or higher was about 59% in 1982.
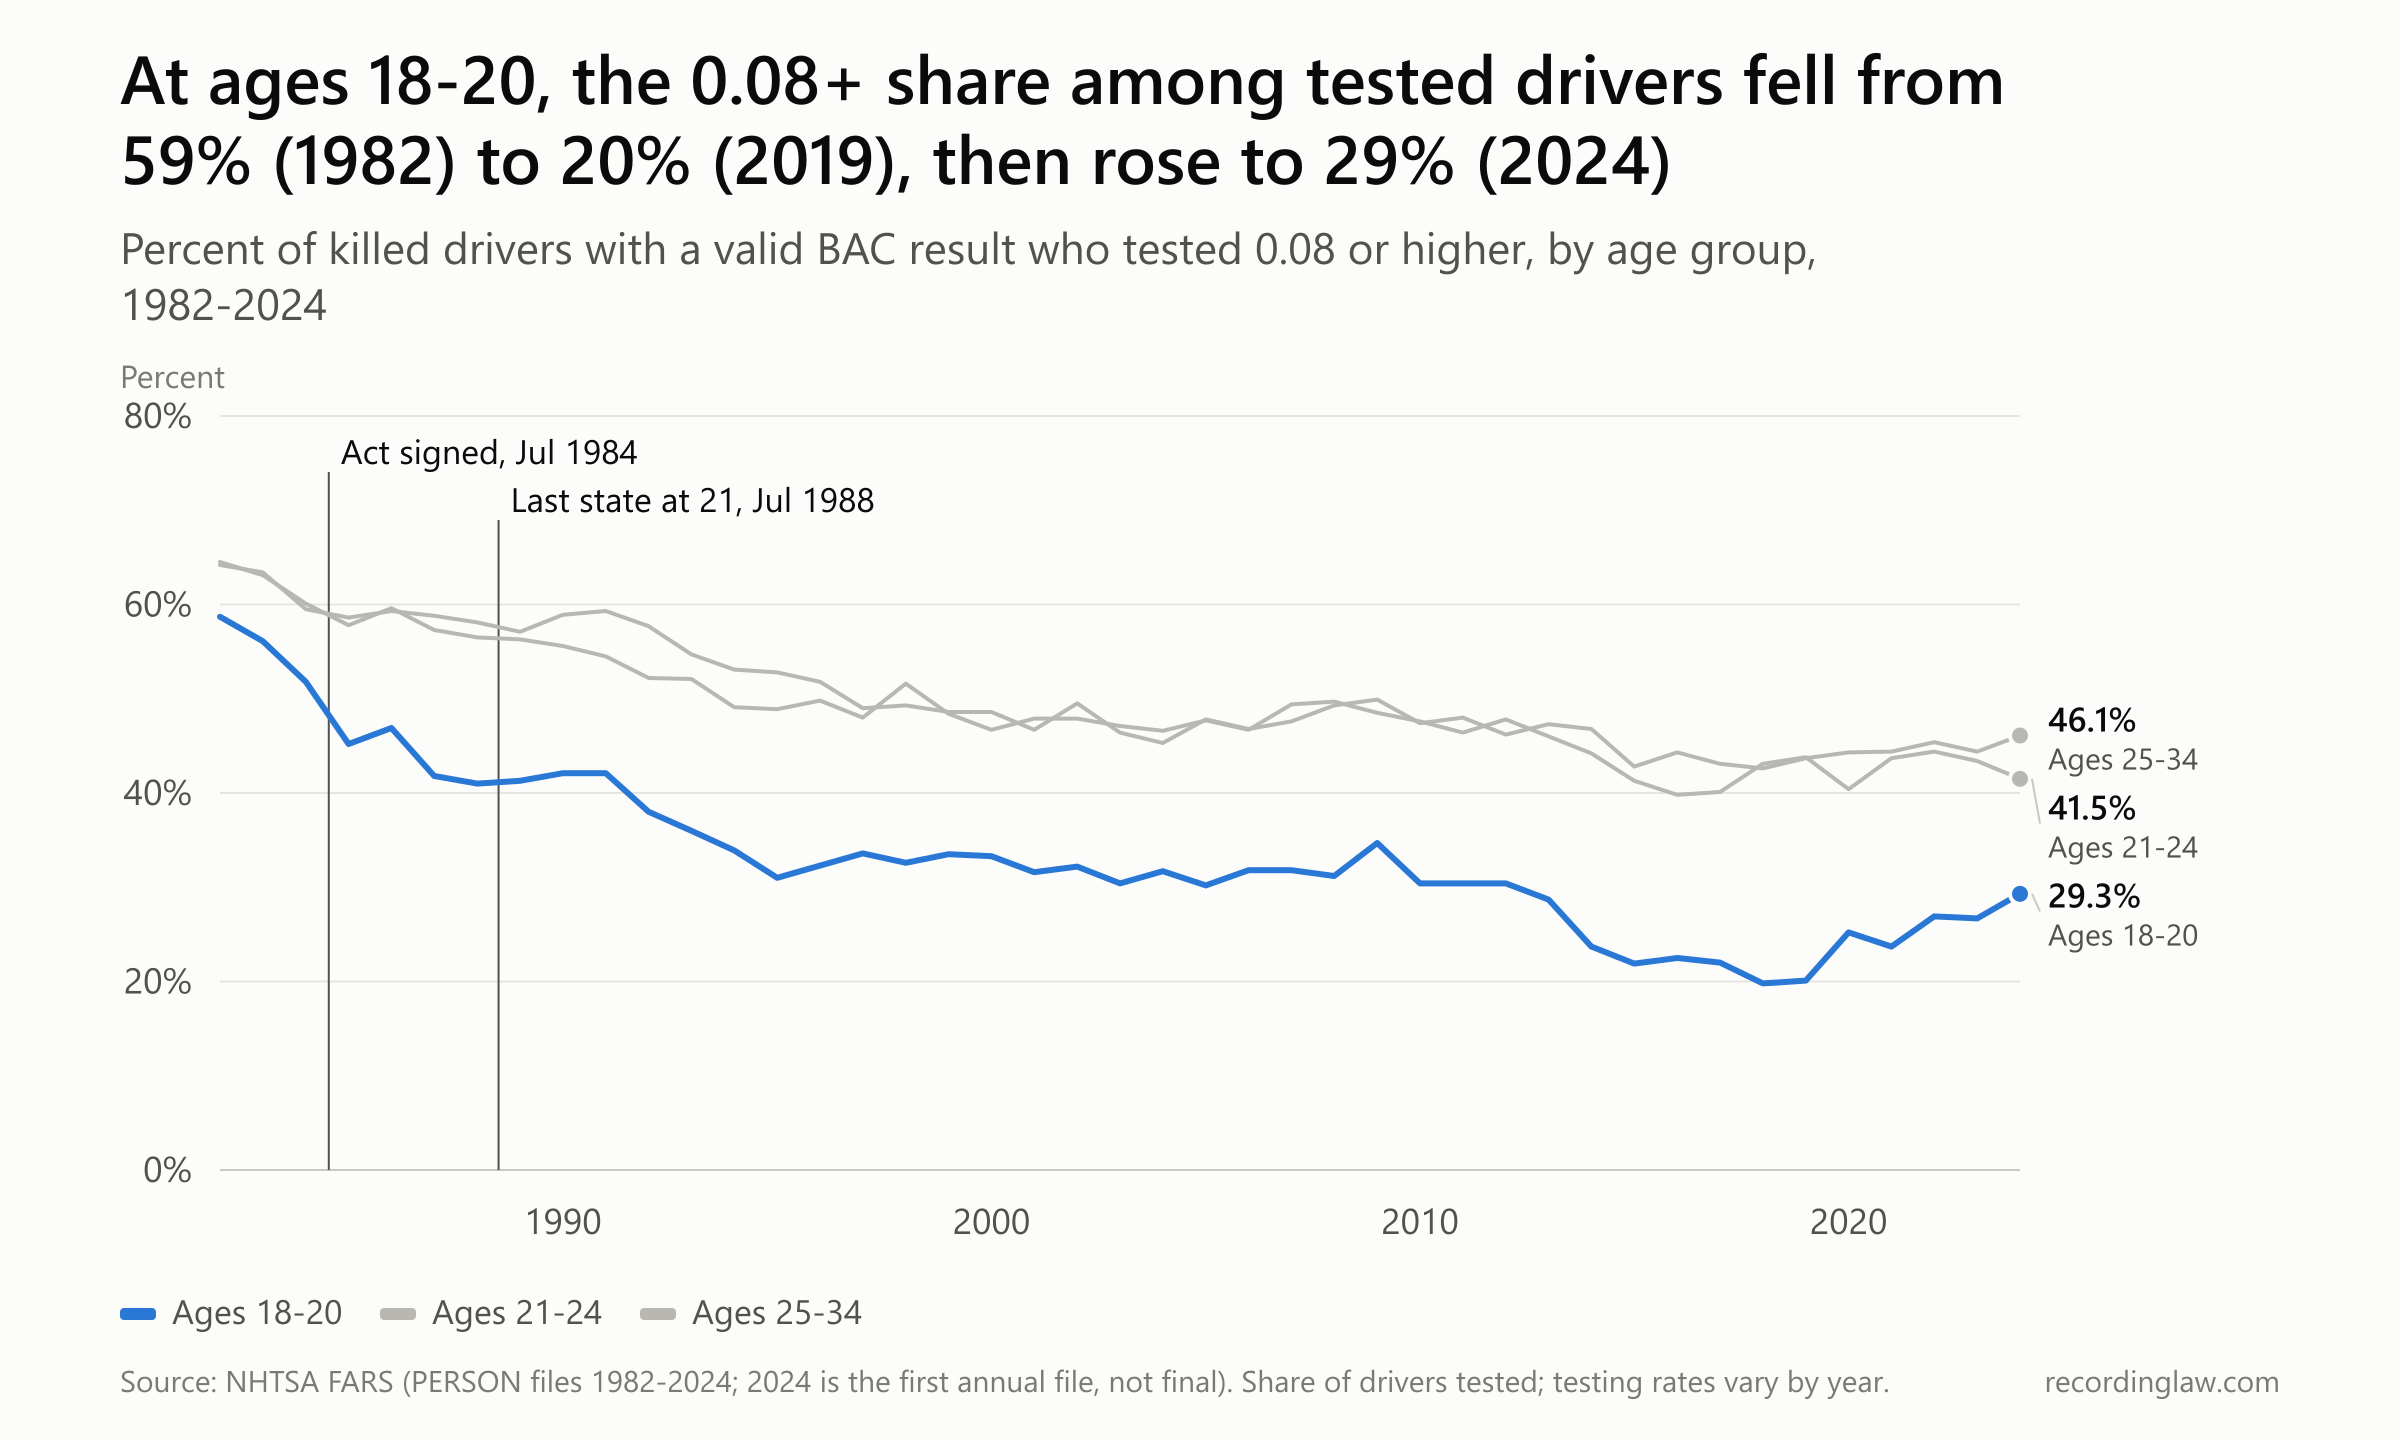
Source: NHTSA FARS person files, 1982-2024 (2024 is the first annual file, not final). Shares are of drivers with a valid test result; testing rates vary by year.
| Year | Ages 18-20 (%) | Ages 21-24 (%) | Ages 25-34 (%) |
|---|---|---|---|
| 1982 | 58.7 | 64.5 | 64.2 |
| 1984 | 51.8 | 60.1 | 59.5 |
| 1988 | 41.0 | 56.5 | 58.1 |
| 1995 | 31.0 | 48.9 | 52.8 |
| 2005 | 30.2 | 47.7 | 47.8 |
| 2012 | 30.4 | 47.8 | 46.2 |
| 2019 | 20.1 | 43.8 | 43.7 |
| 2024 | 29.3 | 41.5 | 46.1 |
From 1982 to 1988, the share fell by about 18 percentage points among drivers aged 18 to 20, by 8 among those 21 to 24 and by 6 among those 25 to 34.
The younger group's line has stayed below the older ones since. That comparison cannot isolate the drinking age. NHTSA's own 2008 review called the age laws "a key factor" in the decline, "along with demographic shifts, .02 or less blood alcohol concentration laws for drivers under 21, and general anti drunk driving efforts." (Our DUI laws guide covers today's state BAC limits.)
Research at the time disagreed too. In 1985, two Case Western Reserve researchers, Fredric Bolotin and Jack DeSario, found a drop in one state that had raised its age to 19 in 1982. In most of the others they examined, the share of fatal crashes involving the newly restricted age group rose slightly or stayed "substantially the same."
Moves toward 21, they concluded, "don't address the total drunk-driving problem." Bolotin conceded that "ours certainly was not perfect." To turn trends like these into a count of lives, NHTSA uses one number.
Where does 31,959 come from?
NHTSA's count rests on a single figure from 1985, a 13% effect. A 1985 NHTSA technical report by R. D. Arnold compared fatal crash involvements of drivers affected by a raised drinking age with those of young drivers who were not, in 13 states, using crash data from 1975 to 1982. "The net effect, based on combined data from thirteen states, is a 13 percent reduction in fatal accident involvements," the report's abstract says.
A 1989 follow-up with data through 1986 found 12%. "It is not possible to determine whether this difference represents a change in effectiveness, or is the result of having a larger pool of data for the analysis," that report says. NHTSA kept 13% as its effectiveness rating.
The rating feeds a formula. NHTSA takes every death in a crash involving at least one driver aged 18 to 20, multiplies by 0.13 and divides by 0.87. In NHTSA's words, "lives saved" here means "all fatalities, driver or passenger, young or old, regardless of alcohol involvement, in crashes where at least one driver was in the targeted age group." In practice, for every 100 people killed in those crashes, the formula credits the law with about 15 more who would otherwise have died.
The published series follows that formula and little else. Applying the same arithmetic to FARS crash counts reproduces NHTSA's published figures to within about 3%, usually 2% to 3% below them.
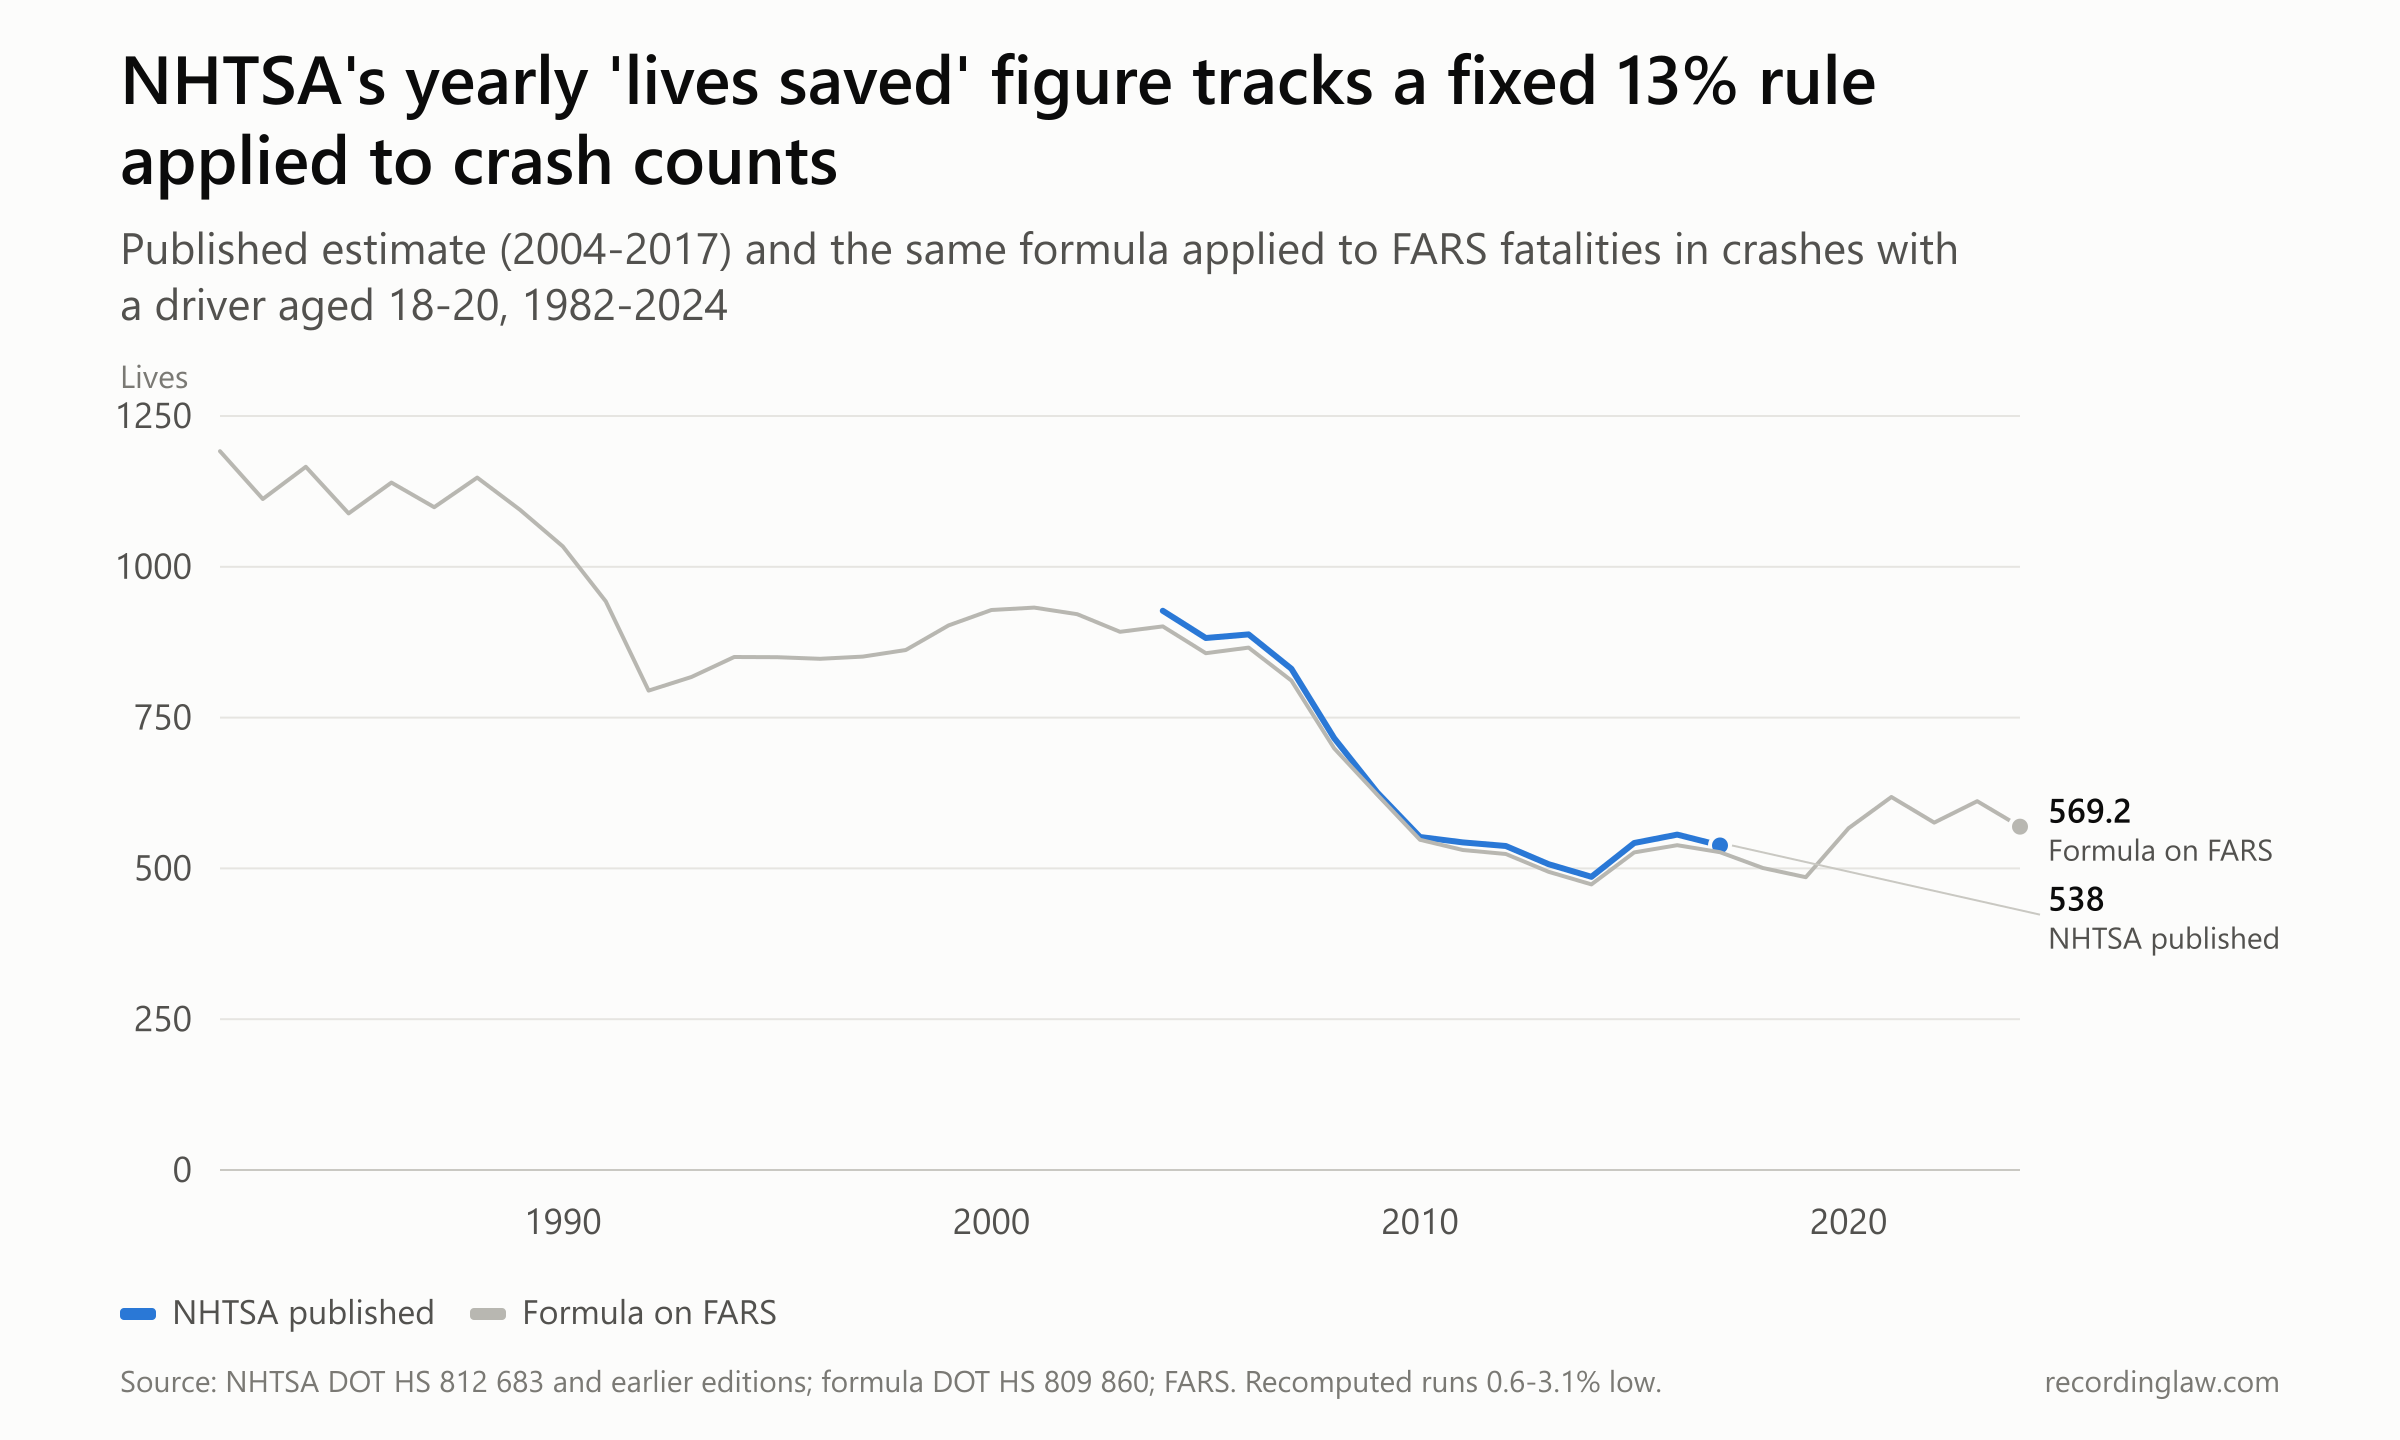
Source: NHTSA Lives Saved reports (DOT HS 811 153, 811 702, 812 319, 812 683); formula from DOT HS 809 860; FARS person and accident files. Recomputed values do not allocate drivers of unknown age.
| Year | Deaths in crashes with a driver aged 18-20 | Formula on FARS | NHTSA published |
|---|---|---|---|
| 1982 | 7,976 | 1,191.8 | not published |
| 1988 | 7,683 | 1,148.0 | not published |
| 2004 | 6,032 | 901.3 | 927 |
| 2008 | 4,678 | 699.0 | 716 |
| 2013 | 3,308 | 494.3 | 507 |
| 2017 | 3,525 | 526.7 | 538 |
| 2019 | 3,248 | 485.3 | not published |
| 2021 | 4,139 | 618.5 | not published |
| 2024 | 3,809 | 569.2 | not published |
Because the 13% never changes, the yearly count can move only when crash deaths move. The published estimate fell from 927 in 2004 to 538 in 2017 because deaths in those crashes fell, from about 6,000 to about 3,500.
When deaths in crashes involving young drivers rose to about 4,100 in 2021, the same formula would have credited the law with about 620 lives, roughly the level of 2009. NHTSA has not published that number. Its yearly series ends with the 2017 data year, and the agency says it does not estimate lives "savable" because every state already has the law.
Run on the crash counts of 1988, the year the last state moved, the formula gives about 1,150. That sits inside the range the 1984 forecasts spanned, from Sweedler's 700 to the 1,250 Lautenberg cited. Other groups use other numbers. Mothers Against Drunk Driving (MADD), the advocacy group whose founder stood in the Rose Garden at the signing, says "More than 25,000 lives have been saved" and cites a 16% drop in crashes.
The 13% came from states that raised their age before Washington pushed. Later researchers asked whether the states Washington pushed saw the same drop, and they did not agree.
College presidents reopen the question
The question went public again in August 2008. College and university presidents, organized by former Middlebury College president John McCardell as the Amethyst Initiative, signed a statement calling for debate on the drinking age. By August 27, 129 had signed, the Cornell Daily Sun reported.
"Twenty-one is not working," the statement says. It argued that adults under 21 "are deemed capable of voting, signing contracts, serving on juries and enlisting in the military, but are told they are not mature enough to have a beer." It also asked whether the highway-fund "incentive" encourages or inhibits that debate. Who funds the Initiative and its companion group, Choose Responsibility, could not be found for this article.
McCardell told NPR that of 102 studies, "about half show a positive relationship, the other half show no relationship at all," and that "that downward trend began before the law changed." He also called it "a law that is routinely evaded." Those are his characterizations; they were not checked for this article.
MADD answered that the science backed the age, NPR reported, and its press release questioned whether signatory schools "bother" to uphold current law, The Dartmouth reported. MADD's corporate network launched with members including insurers and Diageo North America, an alcohol company.
Cornell's president, David Skorton, declined to sign: "based on my experience and my reading of the research literature, I opted not to sign this statement." By then, economists had already put the question to the data with two designs.
What happens on the 21st birthday?
The first design looked at a single day in every young adult's life. Christopher Carpenter and Carlos Dobkin compared deaths just before and just after people turned 21, day by day, using confidential national mortality records for 1997 to 2004. Economists call this a regression discontinuity: people a few weeks either side of a birthday are alike in almost every way except whether they can buy alcohol. Using that design, they wrote, "we can be confident that our results are not biased by unobserved factors that determine policy."
They found "a discrete 9 percent increase in the mortality rate at age 21." In their working paper's figure, that is about 10 more deaths per 100,000 people a year. The chart and table break the jump down by cause of death; the estimates are in log points, which roughly equal percentage changes (0.087 is about 9%).
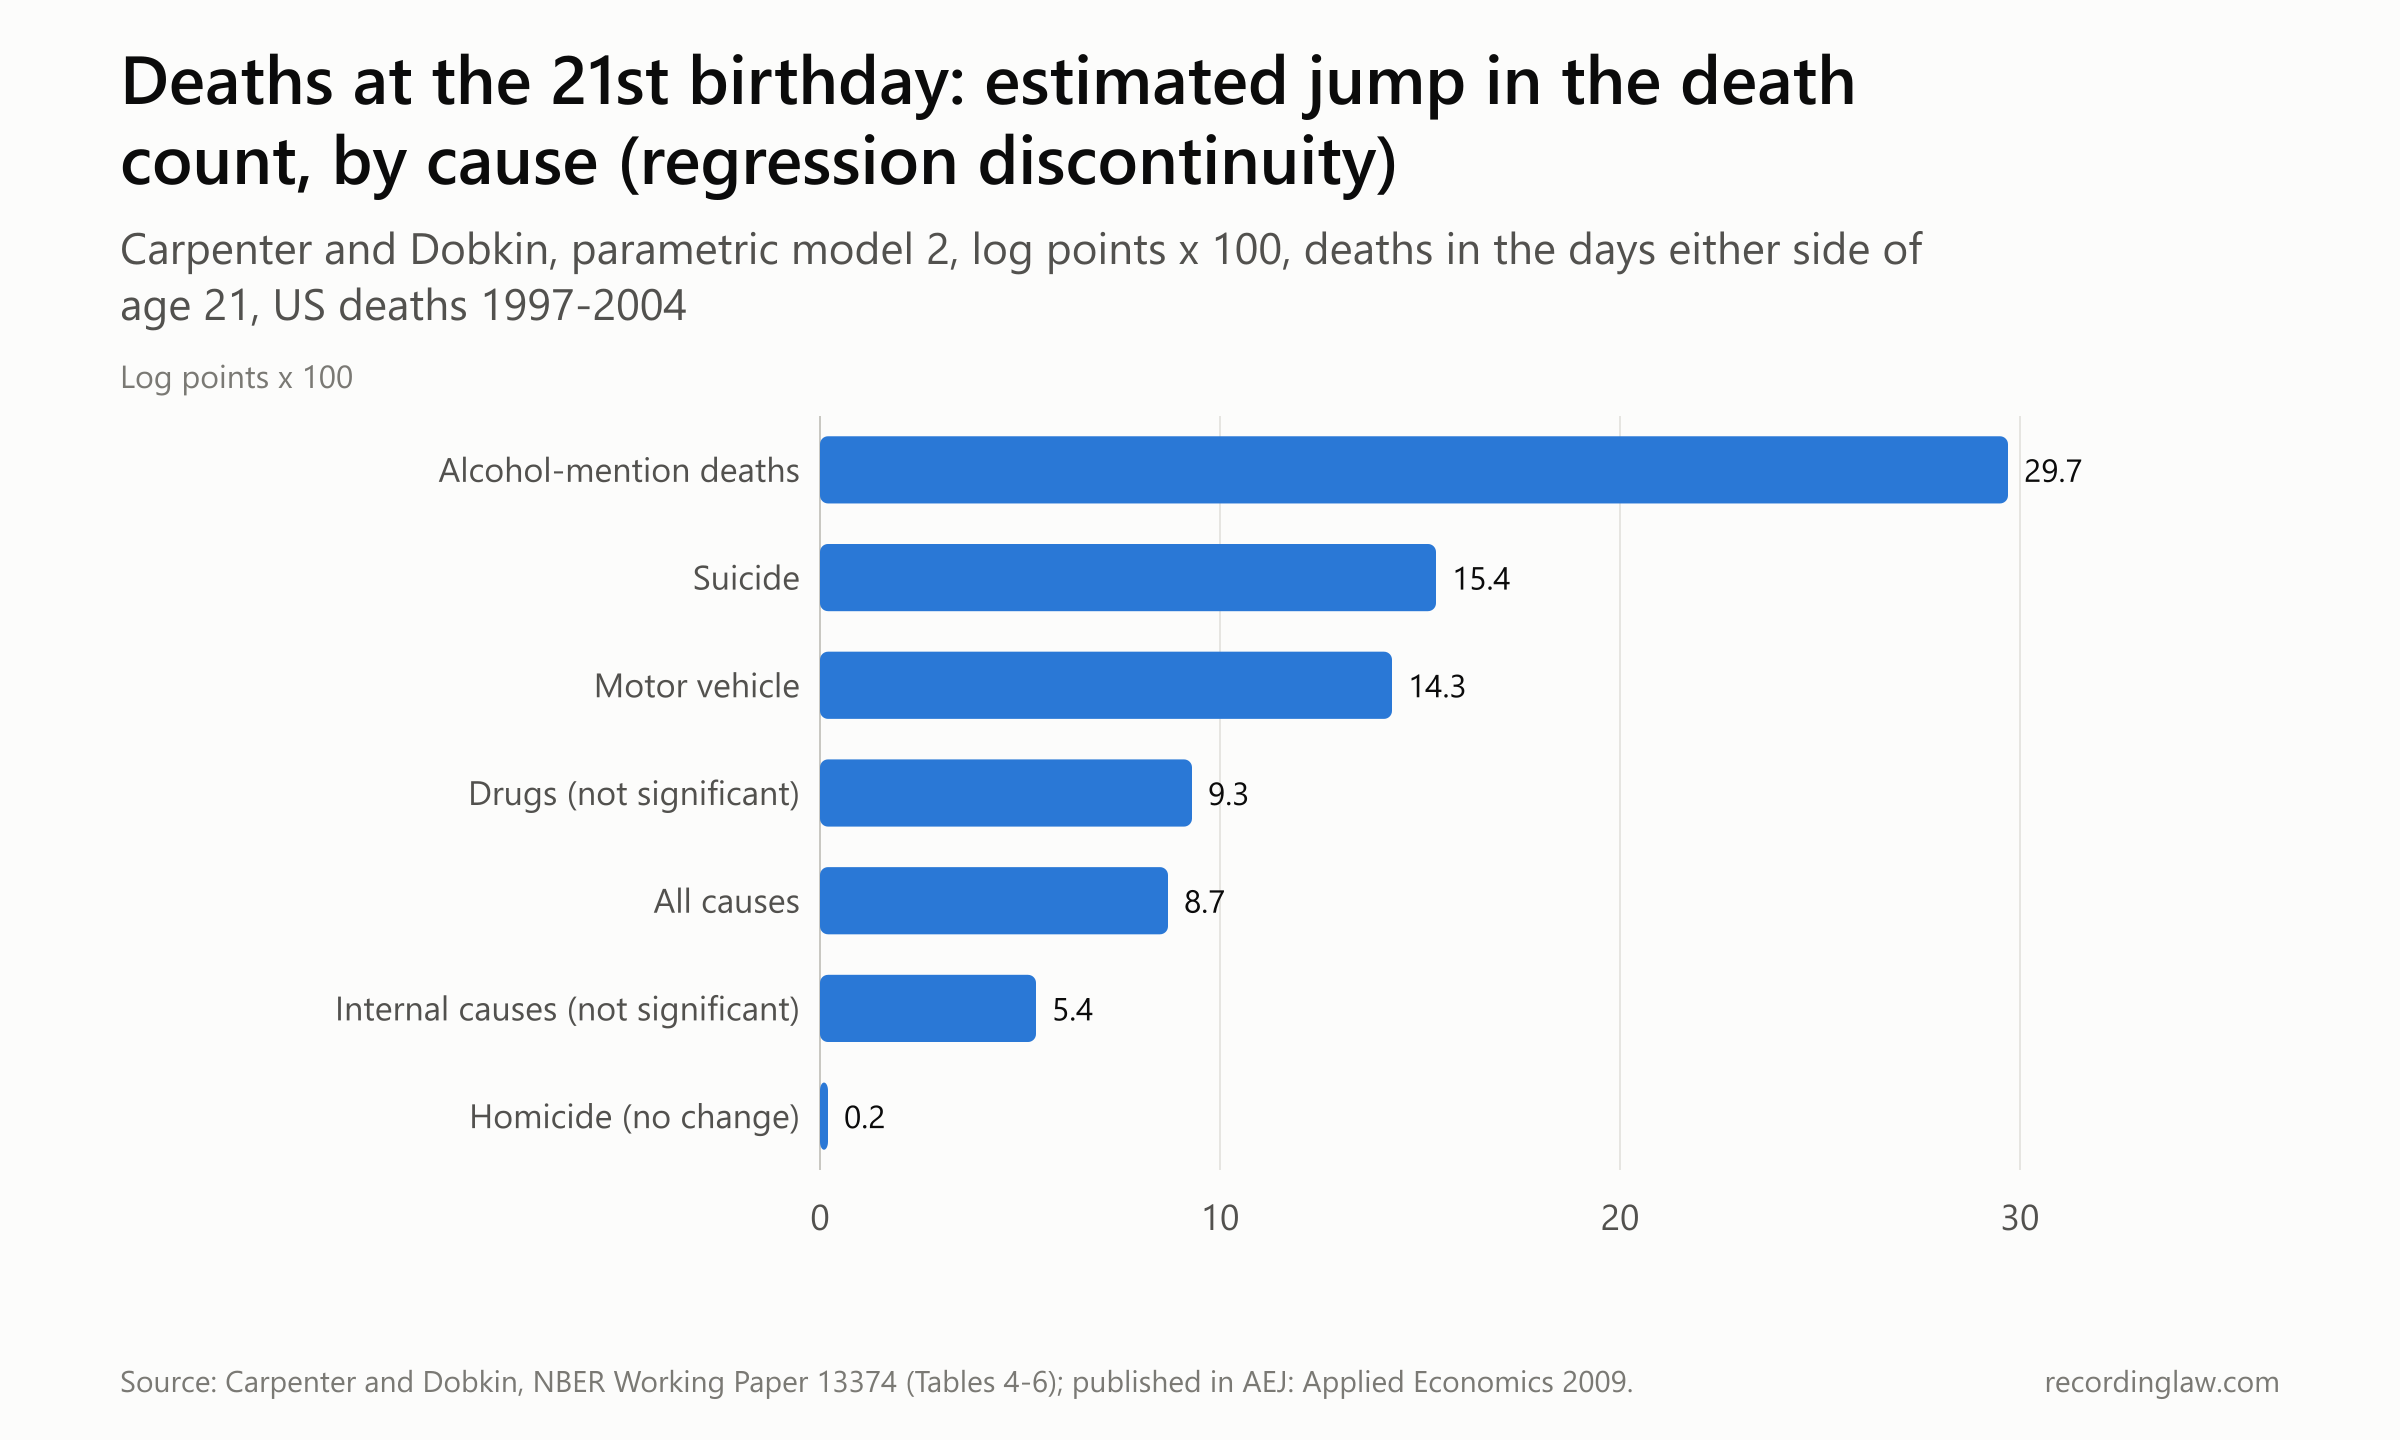
Source: Carpenter and Dobkin, NBER Working Paper 13374, Tables 4-6 (parametric model 2); published in American Economic Journal: Applied Economics, 2009. US deaths 1997-2004.
| Cause of death | Estimated jump at 21 (log points) | Standard error |
|---|---|---|
| All causes | 0.087 | 0.017 |
| External causes | 0.100 | 0.021 |
| Motor vehicle accidents | 0.143 | 0.032 |
| Alcohol mention | 0.297 | 0.113 |
| Suicide | 0.154 | 0.059 |
| Homicide | 0.002 | 0.045 |
| Drugs | 0.093 | 0.083 |
| Internal causes | 0.054 | 0.040 |
Deaths with an explicit mention of alcohol rose by more than 30%, motor vehicle deaths by about 14% and suicides by more than 15%; homicides did not move.
At the same birthday, the number of recent drinking days rose 21%. The authors estimate that a 10% increase in drinking days raises young adults' mortality by 4.3%. Because both the extra drinking and the higher death rate persisted after 21, they argued, "a higher minimum drinking age actually reduces mortality, rather than just changing the age at which people die."
In 2011 they wrote a review aimed at the Amethyst statement, concluding that "setting the minimum legal drinking age at 21 clearly reduces alcohol consumption and its major harms." Their design has one limit. It measures what changes when drinking becomes legal, in years long after every state had moved; it does not count what happened in each state between 1984 and 1988. The second design looked at those years, state by state.
Did the states Washington pushed see a drop?
The second study found the drop concentrated in the states that moved before Washington pushed. Jeffrey Miron, then a senior lecturer in economics at Harvard and a senior fellow at the Cato Institute, a libertarian think tank that says it accepts no government funding, and Elina Tetelbaum built a state-by-state panel, following the traffic death rate for 18- to 20-year-olds in every state each year from 1976 to 2005. Across all states, an age-21 law was associated with a drop of about 8%, statistically significant. Then they split the sample.
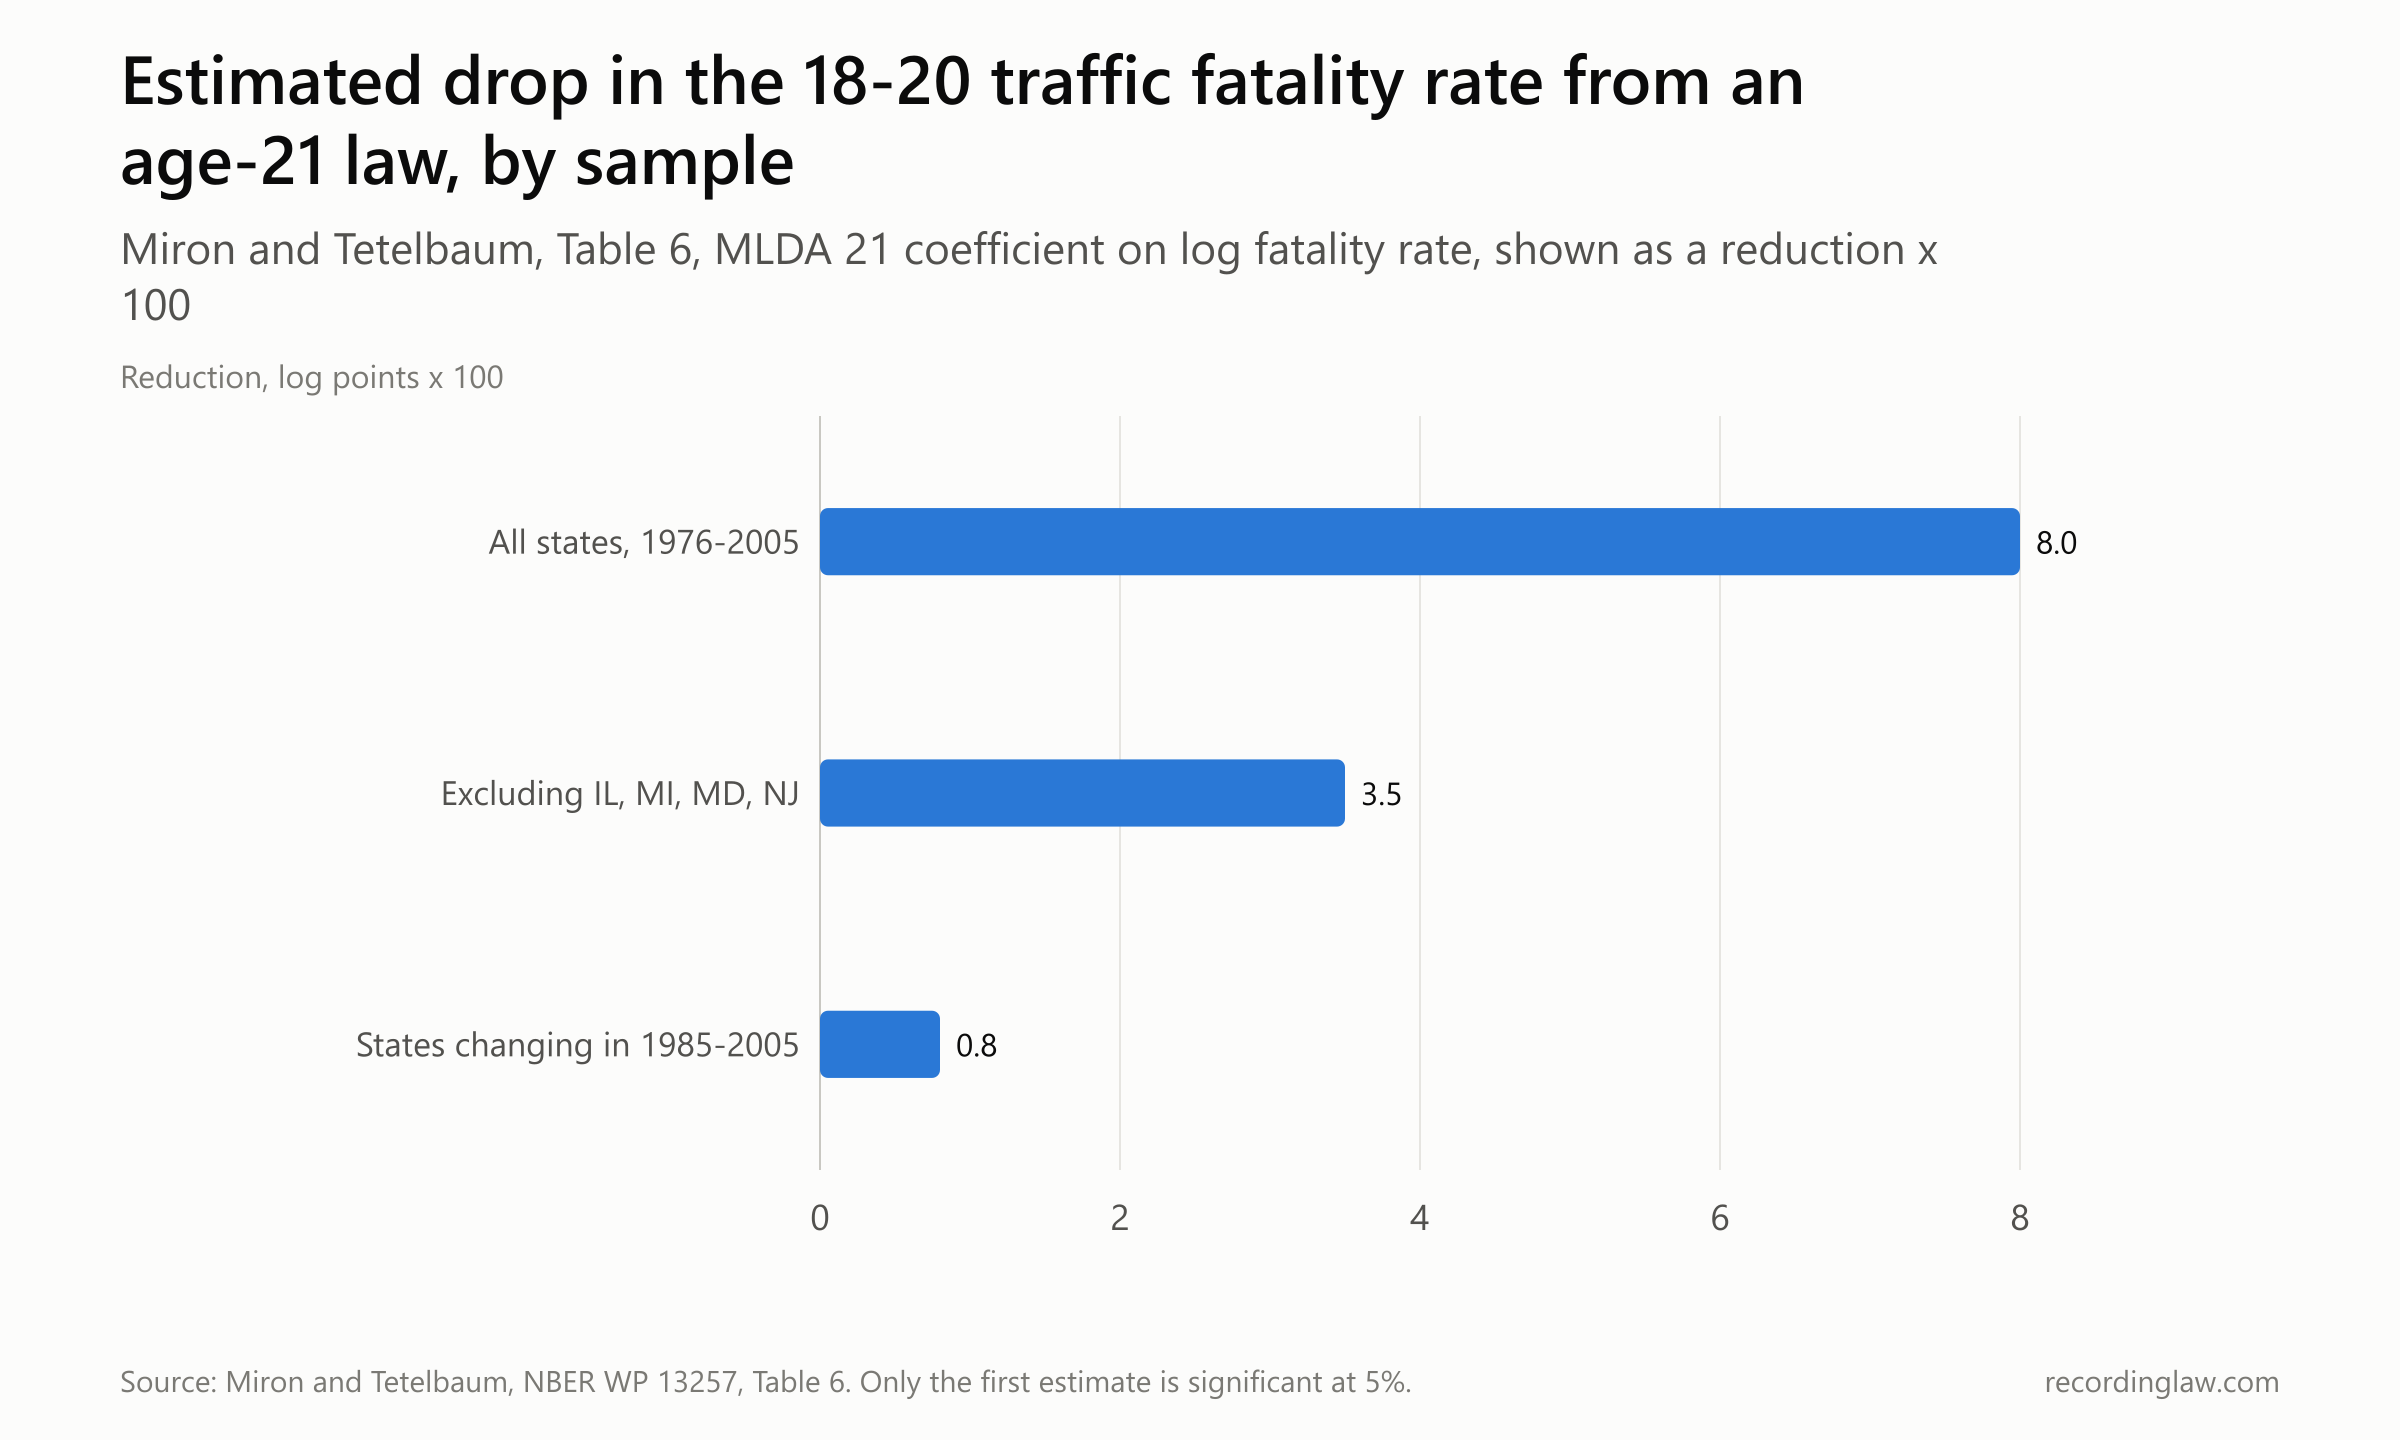
Source: Miron and Tetelbaum, NBER Working Paper 13257, Table 6. Only the all-states estimate is significant at the 5% level. A coefficient of -0.080 means about 8% lower.
| Sample | Coefficient on age-21 law | Standard error |
|---|---|---|
| All states | -0.080 | 0.032 |
| Excluding Illinois, Maryland, Michigan, New Jersey | -0.035 | 0.037 |
| States that changed to 21 after 1984 | -0.008 | 0.037 |
Leaving out the four states that moved first, by January 1983, the estimate shrinks and loses statistical significance; for states that moved after 1984, it is near zero.
Three of those four early states are the ones Reagan named in the Rose Garden: New Jersey, Illinois and Michigan. In the states that adopted 21 early, Miron and Tetelbaum found "fatalities declined 16.7%" in the year of adoption, but "as early as 1-2 years after enactment, the MLDA is no longer significant."
In a 2009 Forbes column republished by Cato, they wrote that "we find no evidence it saves lives when the federal government compels this policy" and that "the National-21 experiment has failed." The working paper discloses no research funder. Its text and Table 6 disagree on the samples and estimate for one model, so this article uses only the three estimates where the two agree; whether the published 2009 version corrected the table was not checked.
A simpler tally of our own, with more limits than either study, shows no larger drop for the age group the laws targeted. In the 30 jurisdictions that moved to 21 between 1985 and 1988, drivers aged 18 to 20 killed in the adoption year ran about 4% below the average of the three years before. Three years after adoption, they were still about 3.5% below. Drivers aged 21 to 24 in the same states, whom the law did not touch, fell further, to about 12% below.
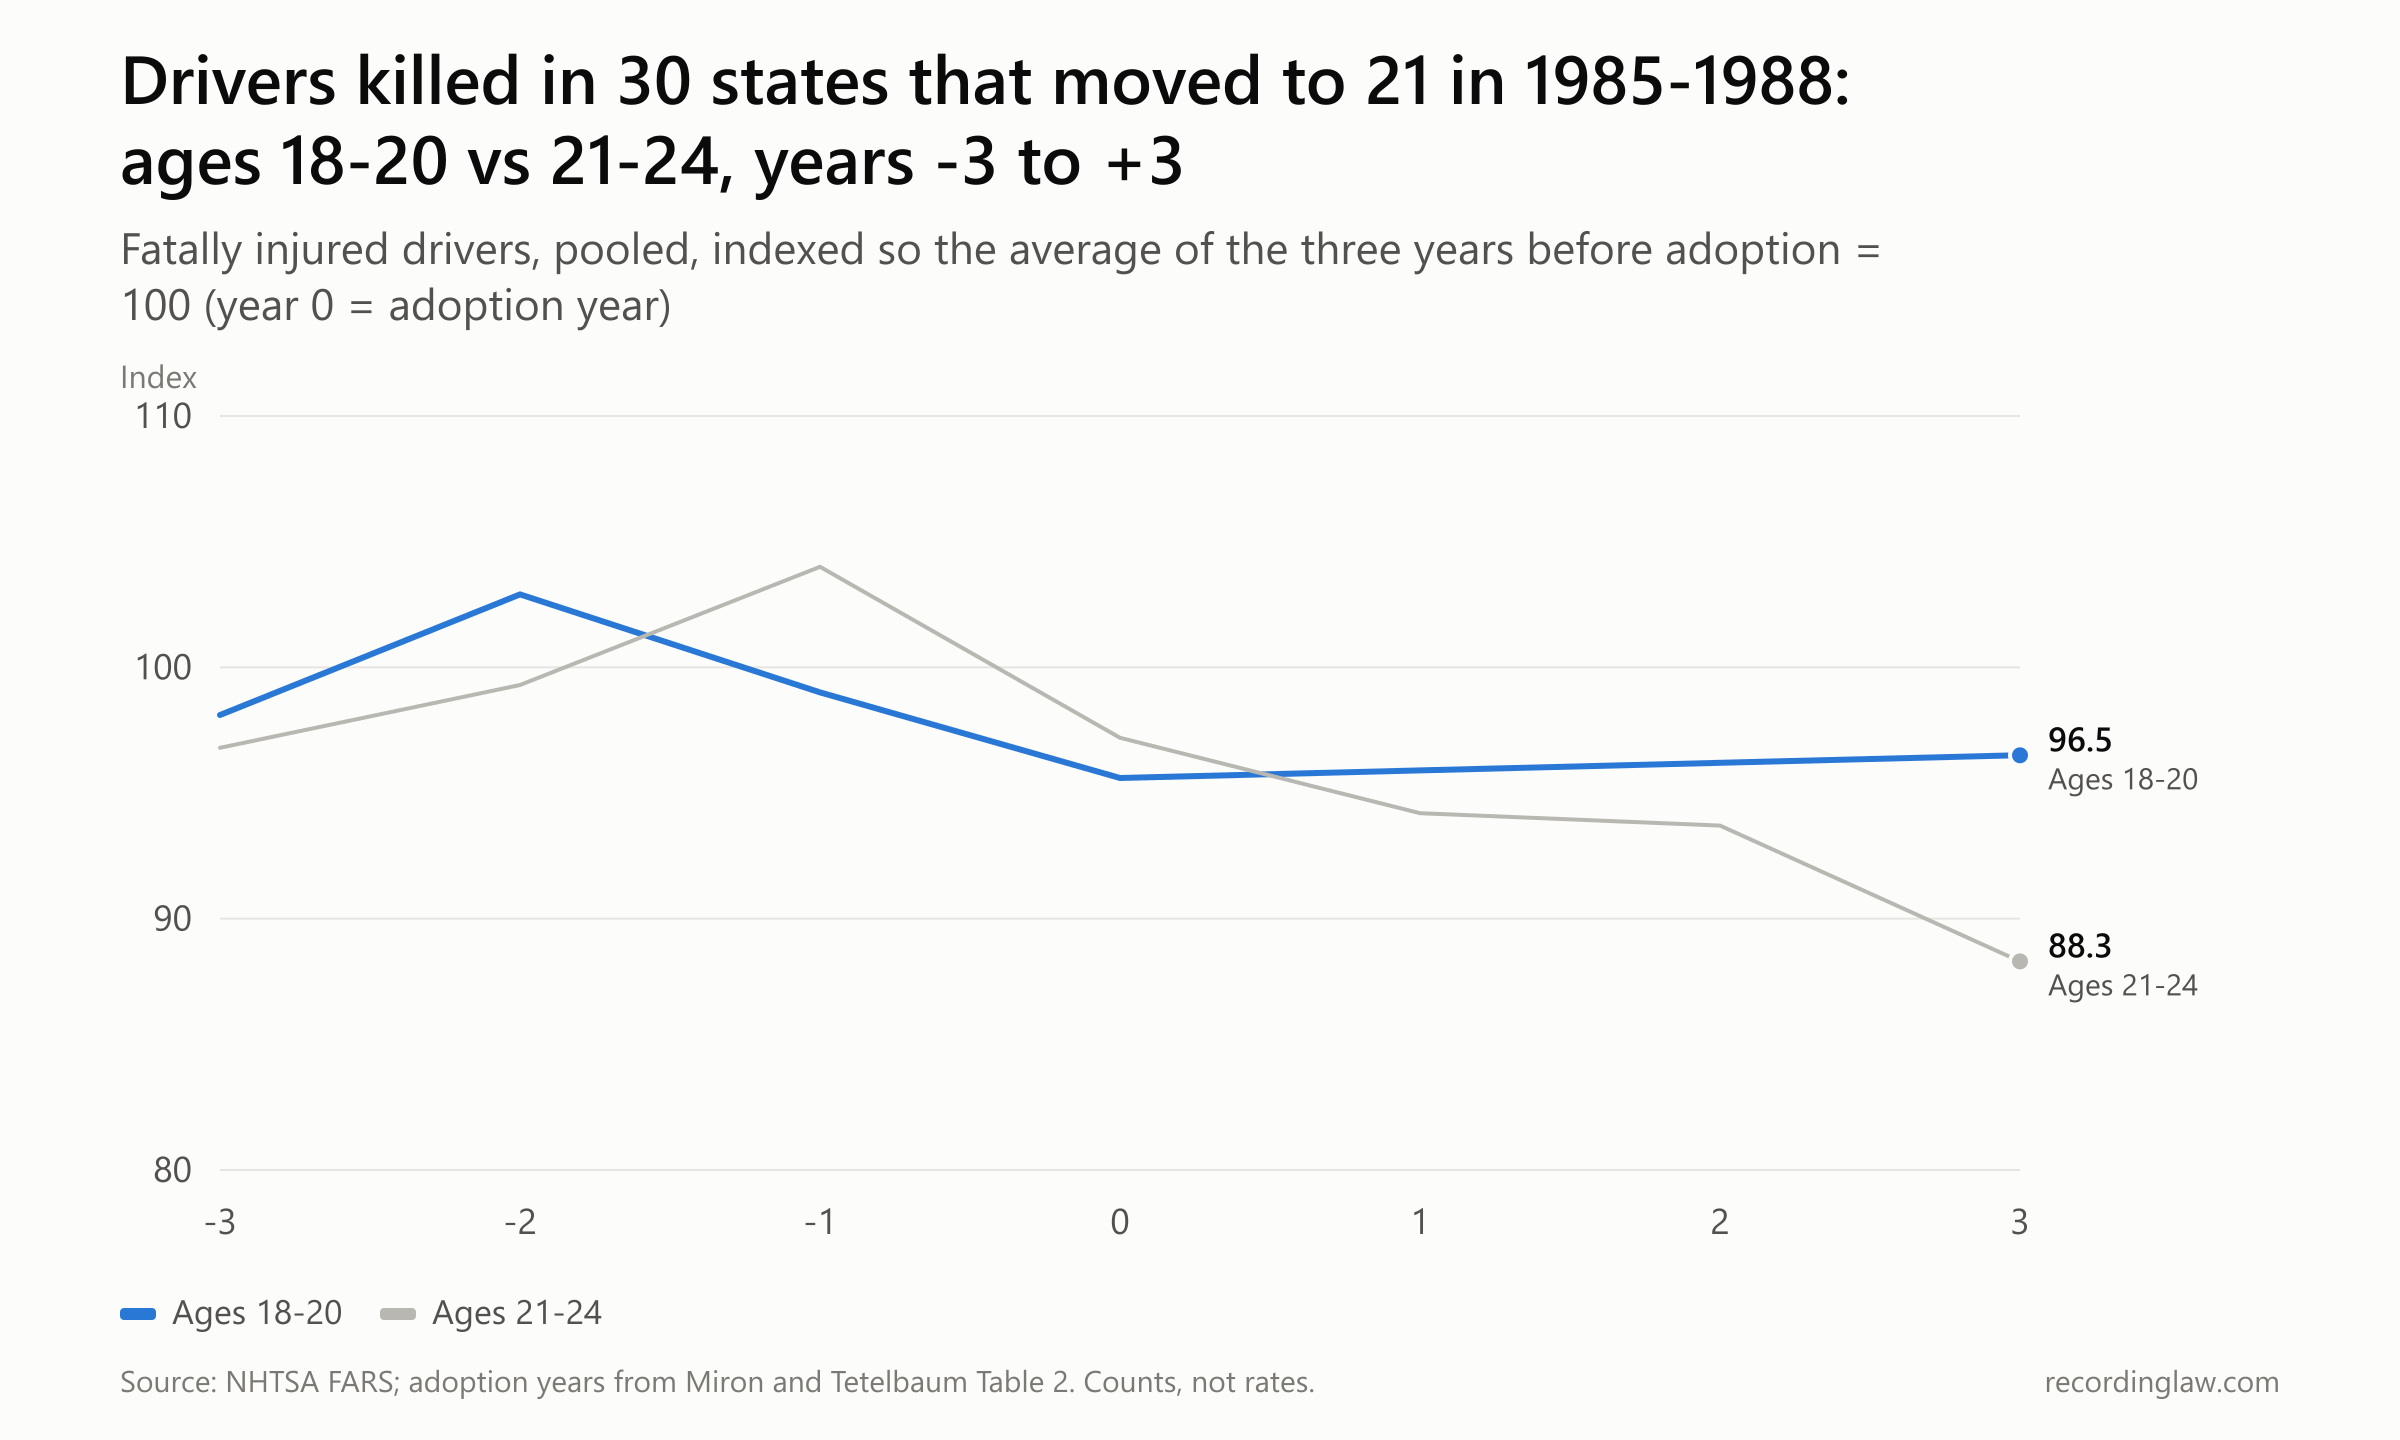
Source: NHTSA FARS person files; adoption years from Miron and Tetelbaum, Table 2. Counts by crash state, not rates.
| Years from adoption | Ages 18-20 (index) | Ages 21-24 (index) |
|---|---|---|
| -3 | 98.1 | 96.8 |
| -2 | 102.9 | 99.3 |
| -1 | 99.0 | 104.0 |
| 0 | 95.6 | 97.2 |
| 1 | 95.9 | 94.2 |
| 2 | 96.2 | 93.7 |
| 3 | 96.5 | 88.3 |
These are raw counts with no adjustment for population or miles driven, and many state laws exempted people who were already 18 to 20, so the affected group grew in over two or three years.
A broader review counted the studies differently. A 2002 review by Alexander Wagenaar and Traci Toomey of the University of Minnesota sorted 241 analyses by quality; of 79 higher-quality analyses of traffic crashes, 46 found a higher drinking age linked to fewer crashes, and "none found the opposite." That review covers studies through 1999 and is not split by early and late adopters.
So the answer to how many lives 21 has saved depends on the method. NHTSA's formula credits the laws with 31,959 through 2017. The birthday study finds more deaths when drinking becomes legal at 21, and the state panel finds the drop in the states that moved before the federal law, with an estimate near zero, and not statistically significant, in the states it pushed.
Neither study's data run past 2005; the birthday study ends in 2004 and the state panel in 2005. Since 2019, the share of tested young drivers killed while drunk has gone back up.
The young drivers' line turns back up after 2019
After falling for most of four decades, the share of young killed drivers at 0.08 or higher has risen since 2019. By 2019, the share of tested drivers aged 18 to 20 killed at 0.08 or higher had fallen to about 20%, close to the series low of 19.8% in 2018. By 2024 it was 29%. The number of such drivers rose from 179 to 280, and the total number of drivers aged 18 to 20 killed rose from about 1,250 to about 1,600.
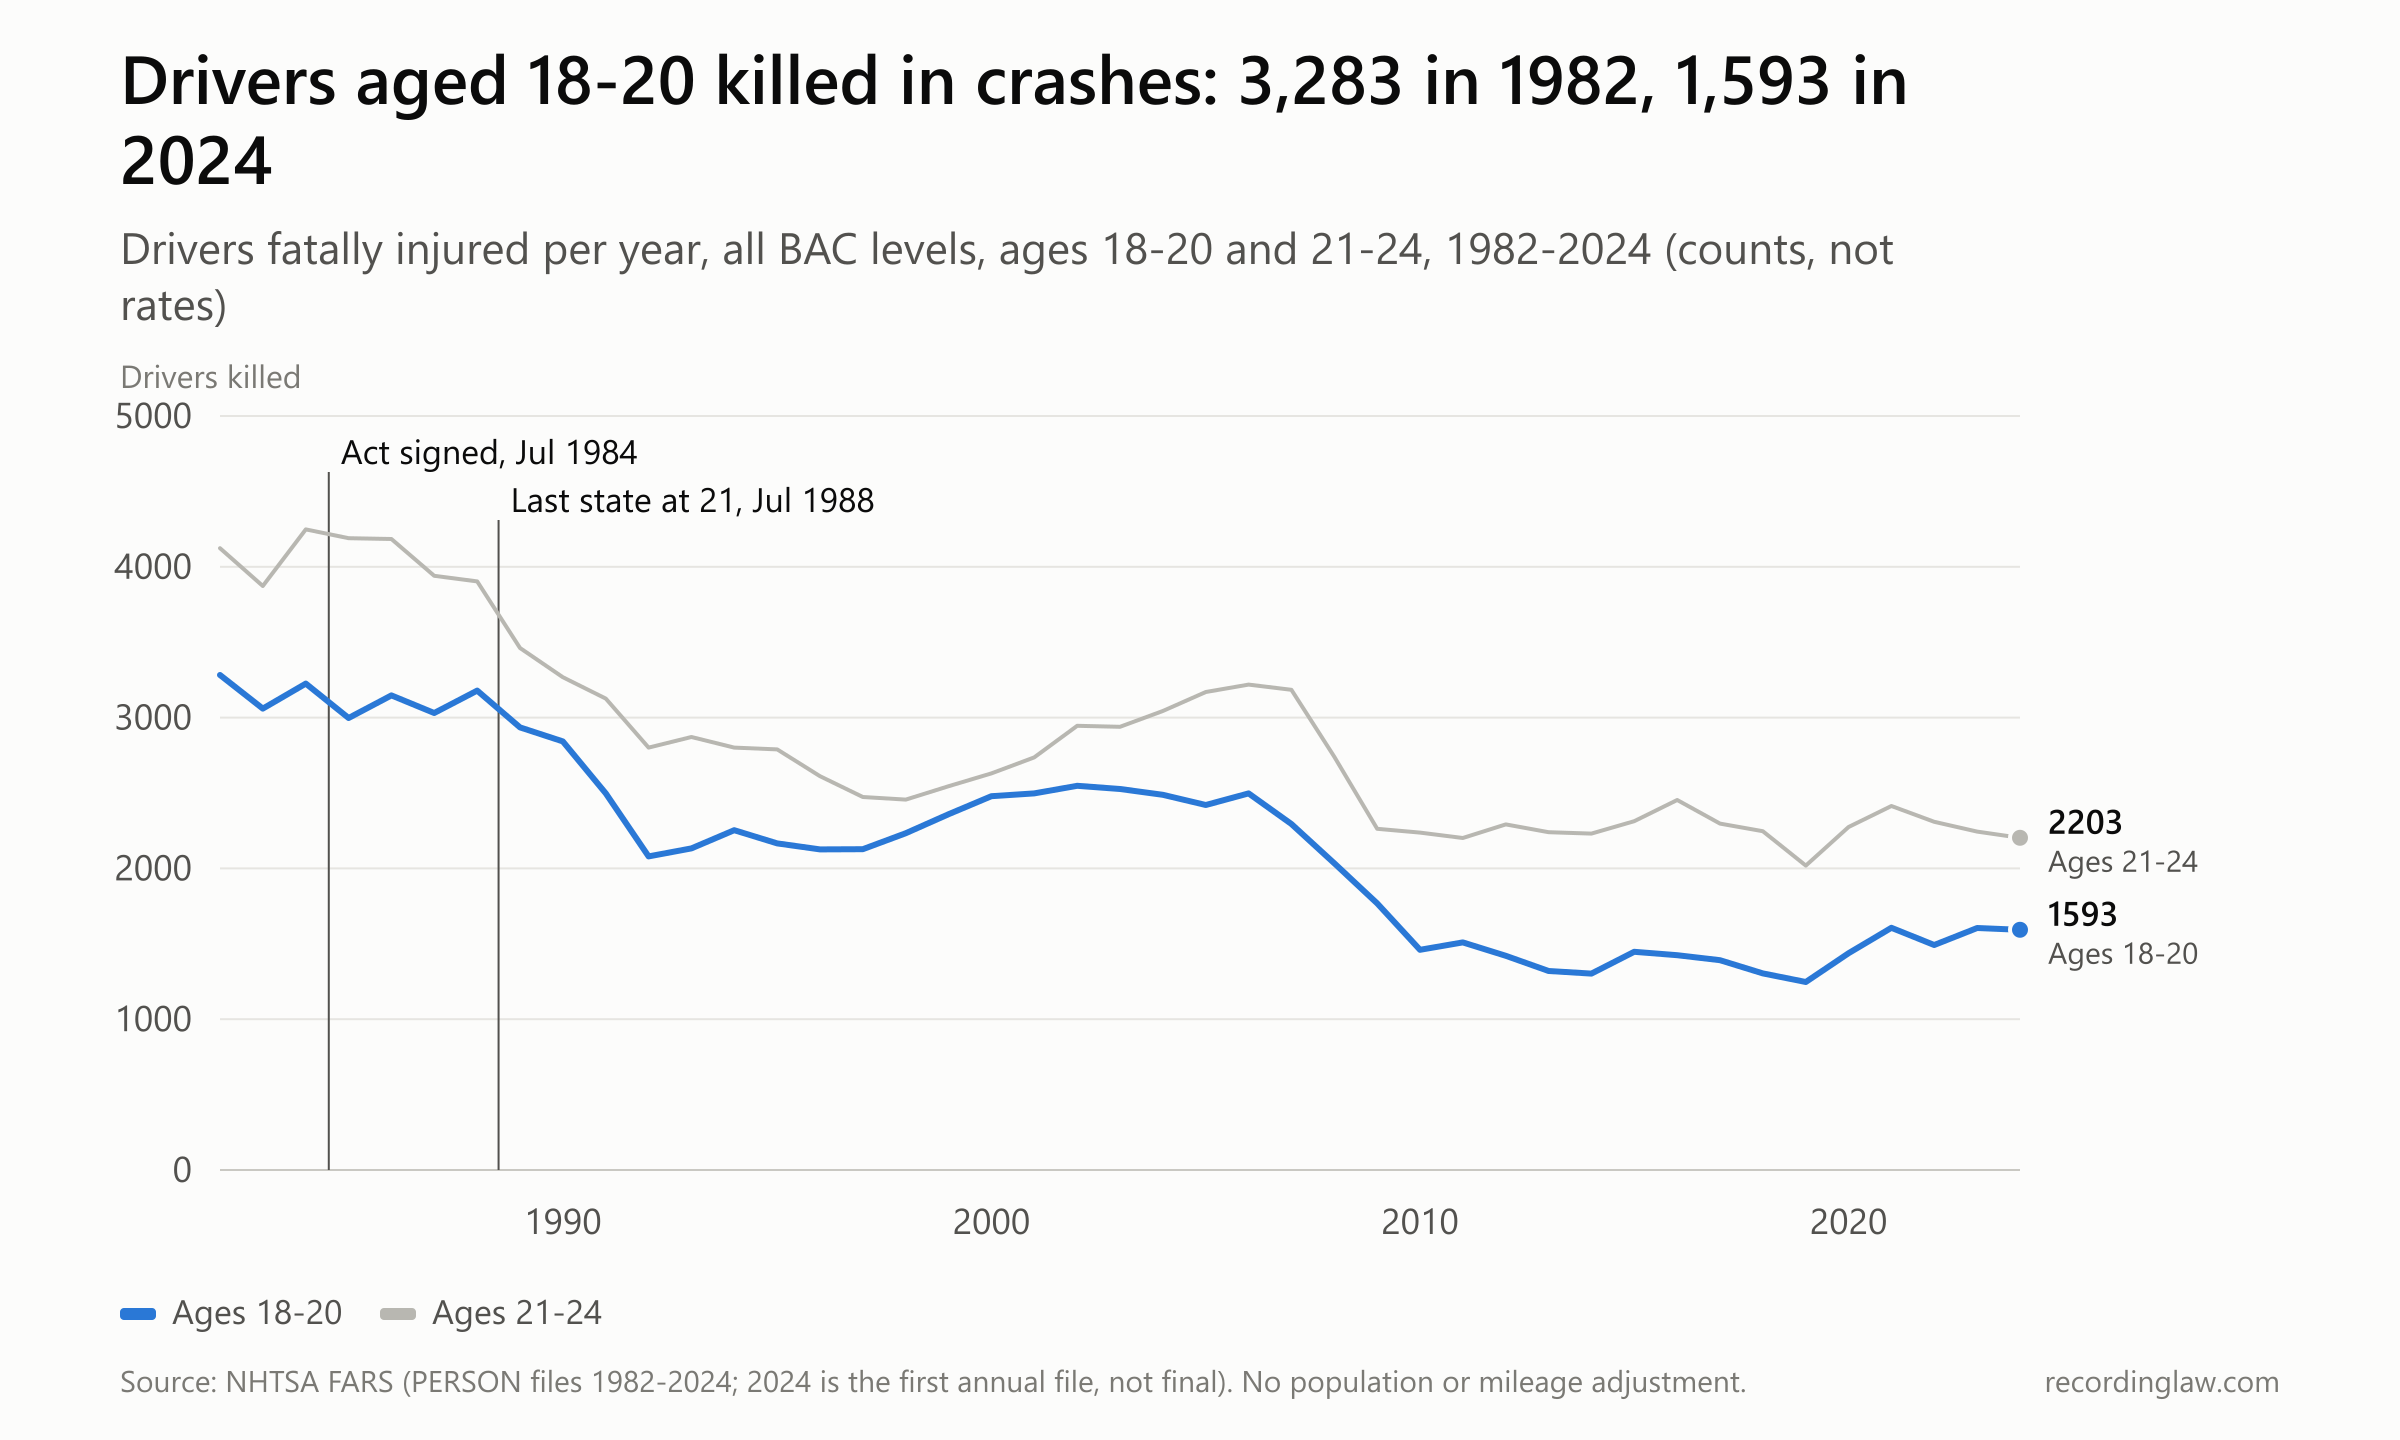
Source: NHTSA FARS person files, 1982-2024 (2024 not final). Counts of drivers killed at all BAC levels, not rates.
| Year | Drivers 18-20 killed | Drivers 21-24 killed |
|---|---|---|
| 1982 | 3,283 | 4,124 |
| 1988 | 3,179 | 3,903 |
| 2000 | 2,479 | 2,630 |
| 2010 | 1,460 | 2,237 |
| 2019 | 1,247 | 2,019 |
| 2021 | 1,606 | 2,414 |
| 2024 | 1,593 | 2,203 |
Drivers aged 18 to 20 killed fell by more than half from 1982 to 2019, then rose about 28% by 2024.
Testing changed too. The share tested fell, from about 72% of killed drivers aged 18 to 20 in 2019 to about 60% in 2024, so the tested group in recent years may differ from earlier ones. NHTSA's own estimate, which fills in likely alcohol levels for untested drivers and covers all drivers aged 15 to 20 in fatal crashes, rose too: from 15% alcohol-impaired in 2019 to 20% in 2024.
The rise is not confined to the young. MADD, citing NHTSA, says drunk-driving deaths of all ages rose 17% from 2019 to 2024, to 11,904. NHTSA reports that drivers aged 21 to 24, the age group Symms singled out in 1984, had the highest share of alcohol-impaired drivers in fatal crashes in 2024, at 28%. No NHTSA or IIHS explanation for the rise among drivers under 21 was found in reporting for this article.
When the next numbers land
The next test of that rise comes with NHTSA's next crash files. Its 2024 file is the first annual release, not the final one. Based on the past two years, the final 2024 file and the first 2025 file should arrive around April 2027; NHTSA has not announced a date. Its next alcohol-impaired driving fact sheet, covering 2025, would follow the June 2026 pattern and land around mid-2027.
No state bill to lower the drinking age with a scheduled vote turned up in reporting for this article. Any state that did lower it would face the 8% penalty.
Reagan called the age "a proven success" in 1984. The yearly count quoted to measure it stops at 2017. The crash files expected around April 2027 will be the first to show whether the rise among young drivers since 2019 held.
How we measured
Crash data. All crash series come from NHTSA's Fatality Analysis Reporting System (FARS) national CSV files for 1982 to 2024, person and accident files. A driver is a person coded as the driver of a motor vehicle in transport; killed means a fatal injury. 2023 is the final file; 2024 is the first annual file, released April 1, 2026, and will be revised. Counts are not rates: no population or miles-driven denominator was used.
Blood alcohol shares. The share at 0.08 or higher is of killed drivers with a valid test result (codes for not given, not reported or unknown excluded). FARS changed alcohol fields over time (test result through 1990, alcohol result after) and moved from hundredths to thousandths in 2015; both were handled by code ranges. The share of killed drivers aged 18 to 20 with a valid test ranged from 58.2% (1982) to 81.4% (2010) and was 71.5% in 2019 and 60.1% in 2024, so year-to-year shares describe a changing tested group. The 0.08 threshold is used for every year as a fixed yardstick. The percentage-point changes from 1982 to 1988 are 58.7 minus 41.0 (17.7) for ages 18 to 20, 64.5 minus 56.5 (8.0) for 21 to 24 and 64.2 minus 58.1 (6.1) for 25 to 34.
NHTSA's lives-saved formula. From NHTSA DOT HS 809 860: lives saved = 0.13 x F / (1 - 0.13), where F is all deaths in FARS crashes involving at least one driver aged 18 to 20. 0.13 / 0.87 = 0.149, about 15 per 100 deaths. We applied it to FARS without NHTSA's allocation of drivers of unknown age, which is why our figures run below the published ones, by 0.6% (2009) to 3.1% (2016) across 2004 to 2017 (2017: 526.7 against 538). Published yearly figures come from the latest edition reporting each year; editions revise earlier years (2011 is 533 in one edition and 543 in the next). The cumulative 31,959 for 1975 to 2017 is NHTSA's. The 13% rests on NHTSA analyses from 1985 (13 states, 1975 to 1982 data) and 1989 (12% with data through 1986); only the catalog abstracts of those reports could be opened. The 2021 figure of about 620 is our application of the formula, not an NHTSA estimate.
Adoption dates. States' dates of moving to 21 come from Miron and Tetelbaum's Table 2, which lists each jurisdiction's most recent adoption date for beer above 3.2% alcohol. A state that had been at 21 since the 1930s appears with that date. The table does not capture wine and spirits differences or grandfather clauses. Federal law counted a state as compliant even if it exempted people already 18 or older on the day before its law took effect.
Our adoption-year tally. For the 30 jurisdictions whose most recent move to 21 fell in 1985 to 1988, we pooled drivers killed by years from the adoption year (year 0 is a partial year) and indexed each age group to the average of years -3 to -1 (18 to 20: 1,776.3; 21 to 24: 2,261.3). Crashes are counted by the state where they happened, not where the driver lived, so cross-border driving is not followed. This is a descriptive tally, not a regression, and cannot separate the law from other changes in those years.
Studies. Carpenter and Dobkin's estimates are from their NBER working paper 13374 (published in AEJ: Applied Economics, 2009); the underlying daily mortality data are confidential NCHS records, so their age curve could not be reproduced and the paper's own coefficients are charted. Estimates in log points approximate percentage changes. Miron and Tetelbaum's estimates are from NBER working paper 13257 (2007); for states that moved after 1984, the standard error (0.037) is too wide to rule out an effect as large as the all-states estimate; the published Economic Inquiry version was not opened. NHTSA's imputed alcohol-impaired shares for drivers aged 15 to 20 come from its Traffic Safety Facts sheets for 2019, 2023 and 2024 data. Wyoming's highway-fund losses are Cowboy State Daily's figures and were not checked against federal records.
What the data cannot show. None of these series counts people who did not die. The crash trends since 1982 overlap with the other changes NHTSA lists: demographic shifts, lower BAC limits for drivers under 21 and general anti-drunk-driving efforts. The birthday study measures the effect of legal access at 21, not the 1984 law in each state; the state panel measures differences across states and years, not individual behaviour.
Frequently Asked Questions
Why is the drinking age 21 in the United States?
The National Minimum Drinking Age Act, signed on July 17, 1984, withholds part of a state's federal highway funds if people under 21 can legally buy or publicly possess alcohol there. Congress did not set the age directly; every state chose to comply, the last being Wyoming in July 1988.
When did every state raise its drinking age to 21?
Fifteen jurisdictions were at 21 at the end of 1982 and 21 at the end of 1984. The count reached 32 in 1985, 44 in 1986, 49 in 1987 and all 50 states plus DC in 1988. South Dakota moved in April 1988 and Wyoming in July 1988.
How many lives has the drinking age of 21 saved?
NHTSA estimates 31,959 lives from 1975 to 2017. That figure applies a fixed 13% effect, from a 1985 analysis of 13 states, to all deaths in crashes involving a driver aged 18 to 20. NHTSA has not published a yearly figure after the 2017 data year. Independent studies disagree about the size of the effect, especially in states that raised the age under federal pressure.
Is it illegal under federal law to drink under 21?
The federal law does not ban drinking. It conditions highway funds on states banning the purchase and public possession of alcohol by people under 21.
What did the Supreme Court decide in South Dakota v. Dole?
On June 23, 1987, the Court ruled 7 to 2 that Congress could attach the drinking-age condition to highway funds. Chief Justice Rehnquist called the withholding of 5% of certain highway funds relatively mild encouragement. Justices O'Connor and Brennan dissented.
Is the drinking age 21 everywhere in the US?
All 50 states and DC are at 21 for purchase and public possession. NHTSA notes that Puerto Rico's legal drinking age is 18. A state that drops below 21 loses 8% of certain federal highway apportionments each fiscal year.
Do deaths really rise at the 21st birthday?
A regression discontinuity study by Christopher Carpenter and Carlos Dobkin, using US deaths from 1997 to 2004, found a 9% jump in the death rate at age 21, driven mainly by motor vehicle crashes, deaths with an alcohol mention and suicides. Homicides did not change.
What is the drinking age in other countries?
See our guides to the [legal drinking age in Canada](/canada/criminal-law/legal-drinking-age-canada/) and the [UK drinking age](/united-kingdom/criminal-law/drinking-age/).
Updates
Independently fact-checked against the cited primary sources
Sources and References
- 23 U.S. Code section 158, National minimum drinking age (Cornell LII)(law.cornell.edu)
- Ronald Reagan, Remarks on Signing the National Minimum Drinking Age Bill, July 17, 1984 (American Presidency Project)(presidency.ucsb.edu)
- Congressional Record, Senate debate on the Lautenberg amendment, June 26, 1984 (130 Cong. Rec.)(govinfo.gov).gov
- Voteview, Senate roll call 529, June 26, 1984(voteview.com)
- South Dakota v. Dole, 483 U.S. 203 (1987) (Cornell LII)(law.cornell.edu)
- UPI, Porter: We call that area Blood Border, Dec. 15, 1983(upi.com)
- Christian Science Monitor, Dole announces administration support, June 14, 1984(csmonitor.com)
- Christian Science Monitor, House drinking-age amendment, June 13, 1984(csmonitor.com)
- Christian Science Monitor, Raise your minimum drinking age to 21, or else, June 28, 1984(csmonitor.com)
- Christian Science Monitor, New York becomes 32nd state at 21, Nov. 29, 1985(csmonitor.com)
- Christian Science Monitor, drinking-age deadline, Oct. 1, 1987(csmonitor.com)
- Cowboy State Daily, Wyoming's last call: the night the state finally raised its drinking age, Nov. 9, 2025(cowboystatedaily.com)
- NHTSA, lives saved calculations for minimum drinking age laws, DOT HS 809 860 (2005)(crashstats.nhtsa.dot.gov).gov
- NHTSA, Lives Saved FAQs, DOT HS 811 105(crashstats.nhtsa.dot.gov).gov
- NHTSA, lives saved in 2017 by restraint use and minimum-drinking-age laws, DOT HS 812 683 (2019)(crashstats.nhtsa.dot.gov).gov
- NHTSA, lives saved by restraint use and minimum-drinking-age laws, DOT HS 812 319(crashstats.nhtsa.dot.gov).gov
- NHTSA, lives saved by restraint use and minimum-drinking-age laws, DOT HS 811 702(crashstats.nhtsa.dot.gov).gov
- NHTSA, lives saved by restraint use and minimum-drinking-age laws, DOT HS 811 153(crashstats.nhtsa.dot.gov).gov
- NHTSA, Drunk Driving(nhtsa.gov).gov
- NHTSA (Fell), Traffic Safety Facts on the minimum legal drinking age (2008)(govinfo.gov).gov
- Arnold, effect of raising the legal drinking age on driver involvement in fatal crashes, DOT HS 806 902 (1985), TRID abstract(trid.trb.org)
- Womble, NHTSA follow-up on minimum drinking age laws (1989), TRID abstract(trid.trb.org)
- NHTSA, FARS 2024 release notes(static.nhtsa.gov).gov
- NHTSA, Fatality Analysis Reporting System national CSV files (1982-2024; one file per year, 2024 shown)(static.nhtsa.gov).gov
- NHTSA Traffic Safety Facts, Alcohol-Impaired Driving (2019 data), DOT HS 813 120(crashstats.nhtsa.dot.gov).gov
- NHTSA Traffic Safety Facts, Alcohol-Impaired Driving (2023 data), DOT HS 813 713(crashstats.nhtsa.dot.gov).gov
- NHTSA Traffic Safety Facts, Alcohol-Impaired Driving (2024 data), DOT HS 813 815(crashstats.nhtsa.dot.gov).gov
- Carpenter and Dobkin, The Effect of Alcohol Consumption on Mortality: Regression Discontinuity Evidence from the Minimum Drinking Age, NBER Working Paper 13374(nber.org)
- Carpenter and Dobkin, American Economic Journal: Applied Economics 1(1), 2009(aeaweb.org)
- Carpenter and Dobkin, The Minimum Legal Drinking Age and Public Health, Journal of Economic Perspectives 25(2), 2011(aeaweb.org)
- Miron and Tetelbaum, Does the Minimum Legal Drinking Age Save Lives?, NBER Working Paper 13257 (2007)(nber.org)
- Miron and Tetelbaum, The Dangers of the Drinking Age (Forbes, 2009; Cato Institute republication)(cato.org)
- Wagenaar and Toomey, Effects of minimum drinking age laws: review and analyses of the literature from 1960 to 2000 (2002), PubMed(pubmed.ncbi.nlm.nih.gov).gov
- Williams, Zador, Harris and Karpf, Journal of Legal Studies (1983), IIHS bibliography(iihs.org)
- Amethyst Initiative, Statement(theamethystinitiative.org)
- NPR, College Presidents Urge Rethink On Drinking Age, Aug. 19, 2008(npr.org)
- MPR News (AP), Should the drinking age be lowered to 18?, Aug. 19, 2008(mprnews.org)
- The Dartmouth, College presidents urge debate over drinking age, Sept. 2008(thedartmouth.com)
- Cornell Daily Sun, Skorton declines to sign drinking-age pledge, Aug. 29, 2008(cornellsun.com)
- Mothers Against Drunk Driving, Why 21(madd.org)
- Mothers Against Drunk Driving, Our History(madd.org)
- MADD press release on NHTSA 2024 data, Apr. 29, 2026(madd.org)
- Cato Institute, Financial Information, Funding, and Independence(cato.org)