NYC Congestion Pricing Data: Manhattan Toll-Zone Entries 4.1% Lower in 2026 Than in 2025
Independently fact-checked against primary sources (last audited October 26, 2026). · 13 primary sources cited on this page. How we verify our legal content
New York began charging a toll to drive into Manhattan south of 60th Street at 12:00 a.m. on January 5, 2025. Most cars with E-ZPass pay $9 at peak hours. The MTA publishes every vehicle entry into the toll zone in 10-minute blocks, and that file recorded 141,280,288 entries from January 5 to October 17, 2025, and 135,553,926 over the same dates in 2026, a 4.1% drop from the first year to the second.
What the open data cannot show is the change from before the toll, because zone-wide counting started the day tolling did. The MTA says the zone saw 27 million fewer vehicles in the first year, an 11% reduction, measured against its own seasonally adjusted baseline. This article sets out what the published counts show, what the MTA reports, the one pre-toll check the open data allows, and where the federal court fight over the program stands as of October 2026.
How the toll works
The program comes from the Traffic Mobility Act, which the New York Legislature enacted in April 2019. It directed the Triborough Bridge and Tunnel Authority, the MTA's bridges and tunnels arm, to set up congestion pricing for the Manhattan central business district. The law requires the program's revenue, less its operating costs, to support $15 billion of capital projects in the MTA's 2020-2024 capital program.
The zone is Manhattan south of 60th Street. The statute excludes the FDR Drive, Route 9A (the West Side Highway) including the Battery Park underpass, and the surface connection from the Hugh L. Carey Tunnel to West Street. Drivers on those roads who do not turn onto zone streets are not tolled.
Current rates, from the MTA's toll page:
| Vehicle | Peak toll (E-ZPass) | Notes |
|---|---|---|
| Cars, pickups, small commercial | $9 | $2.25 overnight; charged once per day |
| Single-unit trucks, some buses | $14.40 | |
| Multi-unit trucks, tour buses | $21.60 | |
| High-volume for-hire vehicles | $1.50 per trip | instead of the daily toll |
| Taxis, green cabs, black cars | $0.75 per trip | instead of the daily toll |
Peak hours run 5 a.m. to 9 p.m. on weekdays and 9 a.m. to 9 p.m. on weekends, and overnight rates are 75% lower. Passenger vehicles entering at peak through the Lincoln, Holland, Queens Midtown or Hugh L. Carey tunnels with E-ZPass get a credit of up to $3. The car toll is scheduled to rise to $12 in 2028 and $15 in 2031.
What the zone counts show
The MTA's Congestion Relief Zone vehicle entries dataset holds 6,749,136 rows covering January 5, 2025 to October 17, 2026. Each row is a 10-minute block at one of 12 detection points, split by vehicle class. Weekly entries have mostly stayed between about 3.2 million and 3.7 million since the toll began.
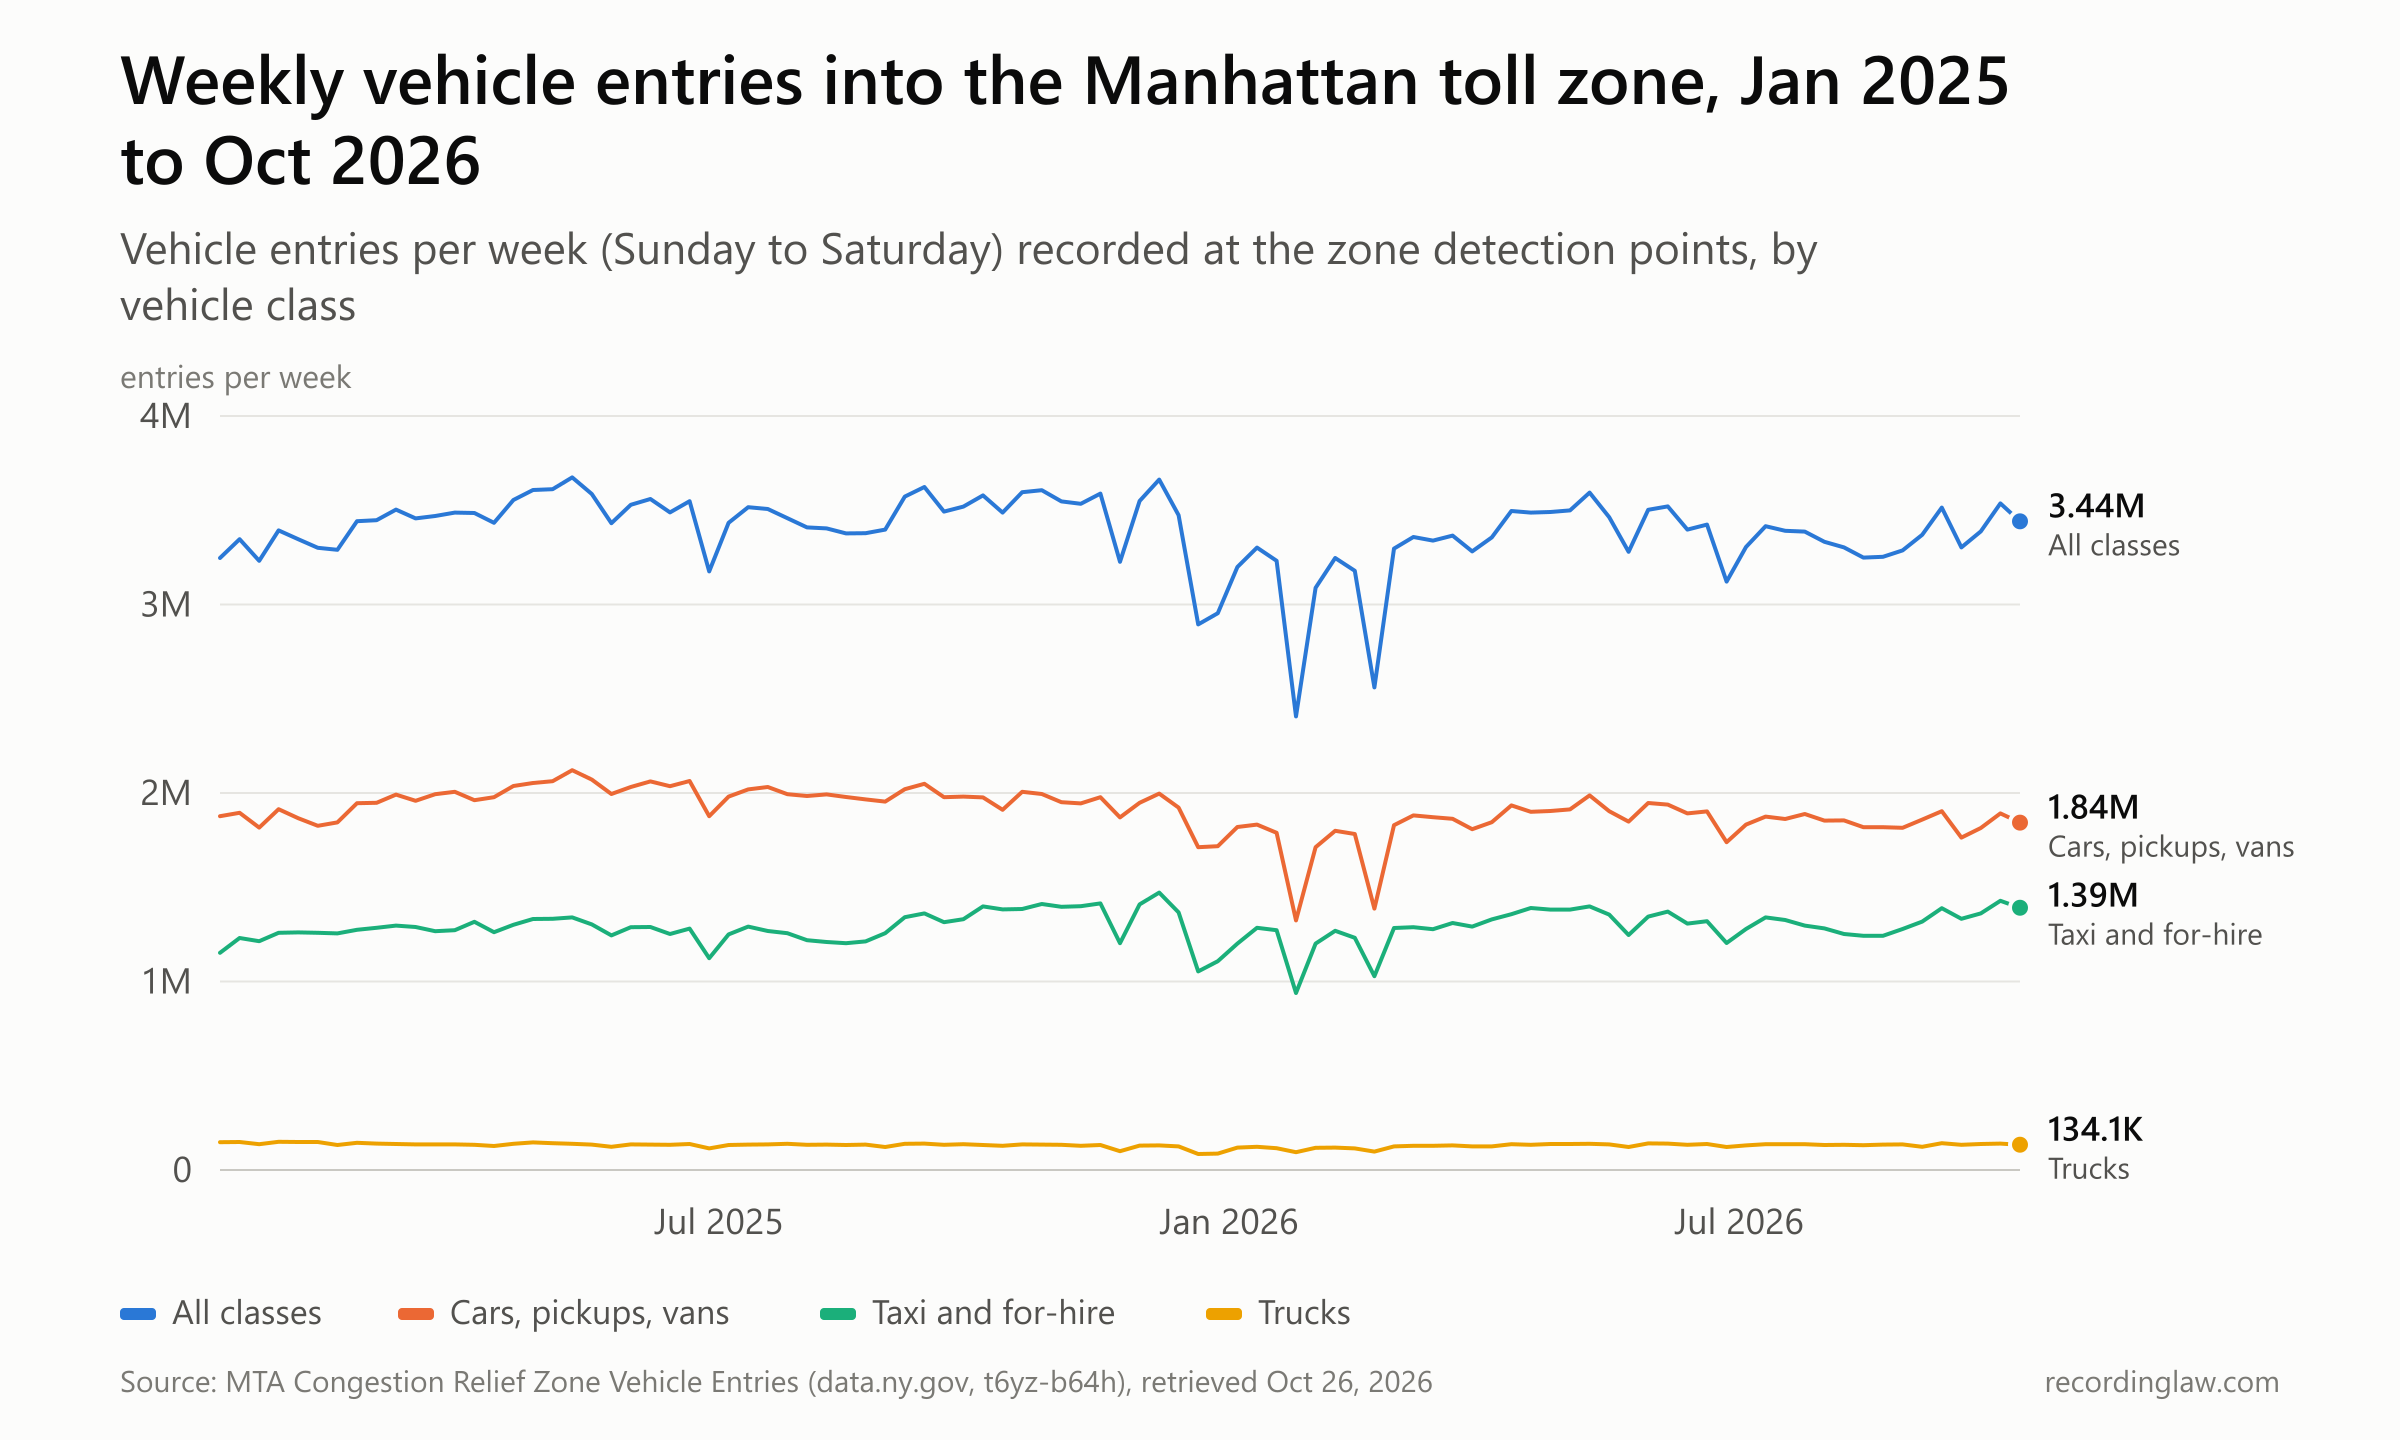
Source: MTA Congestion Relief Zone Vehicle Entries (data.ny.gov, t6yz-b64h), retrieved October 26, 2026.
| Month | Zone entries |
|---|---|
| January 2025 (from Jan 5, 27 days) | 12,738,420 |
| May 2025 | 15,900,690 |
| October 2025 | 15,746,928 |
| January 2026 | 13,366,572 |
| February 2026 | 12,073,011 |
| May 2026 | 15,324,862 |
| September 2026 | 14,416,403 |
The two lowest weeks in the file began January 25 and February 22, 2026, at 2,405,910 and 2,559,750 entries. The MTA's March 2026 bridges and tunnels report says entries in early 2026 were reduced in part by Winter Storms Fern and Hernando and a travel ban that ran from 9 p.m. on February 22 to noon on February 23. That report put average daily entries in January and February 2026 12.3% below the same period of 2025.
The MTA's report and the current open data do not match exactly for those months. The report gives 24,743,484 zone entries for January and February 2026, while the open dataset now sums to 25,439,583 for the same months, 2.8% higher. We could not determine whether the data was revised or the two use different definitions.
Second year versus first year, by vehicle class
Comparing January 5 to October 17 in each year, entries fell for every class except taxis and for-hire vehicles.
| Vehicle class | 2025 | 2026 | Change |
|---|---|---|---|
| Cars, pickups and vans | 80,754,159 | 74,810,892 | -7.4% |
| Taxis and for-hire vehicles | 52,060,853 | 52,866,231 | +1.6% |
| Single-unit trucks | 5,247,719 | 5,042,258 | -3.9% |
| Buses | 2,334,675 | 2,210,976 | -5.3% |
| Motorcycles | 546,420 | 370,189 | -32.3% |
| Multi-unit trucks | 336,462 | 253,380 | -24.7% |
| All classes | 141,280,288 | 135,553,926 | -4.1% |
Cars, pickups and vans went from 57.2% of entries to 55.2%, while taxis and for-hire vehicles went from 36.9% to 39.0%. Motorcycles and multi-unit trucks show the largest percentage drops, but together they were well under 1% of 2025 entries. This is a comparison of the first and second years with the toll in place, so it describes how traffic changed while tolling continued, not the change caused by starting it. The 2026 window also includes the winter storm weeks. Excluding January and February, entries from March 1 to October 17 were 3.0% lower in 2026 than in 2025 (115,175,951 to 111,744,690).
By entry point, the same comparison ranged from an 11.8% decrease at the Lincoln Tunnel to a 0.3% decrease on the FDR Drive at 60th Street. The Brooklyn Bridge (-6.0%), East 60th Street (-5.6%) and Manhattan Bridge (-4.6%) fell more than the zone average; the Holland Tunnel (-0.7%) and West Side Highway at 60th Street (-1.8%) fell less.
What the MTA reports, and how it built the baseline
On the program's first anniversary, the MTA and Governor Kathy Hochul said that in its first year congestion pricing "resulted in 27 million fewer vehicles entering the Congestion Relief Zone," an 11% reduction, and that "on any given day, over 73,000 fewer vehicles are entering the zone." The same release said vehicle miles traveled in the zone were down 7.1% and the share of personal vehicles entering the zone had fallen by six percentage points.
Those figures cannot be rebuilt from open data, because the zone entries file has no rows before January 5, 2025. A presentation by Adam Schmidt of the Citizens Budget Commission at a June 2026 Transportation Research Board webinar on modeling the program describes the MTA's method: average daily entries compared against a historical baseline that "uses October 2023 data with seasonal adjustment factors." The same presentation says that baseline was "published for first year but no longer maintained," and one of its slides is headed "8-14% Fewer Vehicles Entering CBD per Day."
In its monthly bridges and tunnels reports, the MTA counts Central Business District entries as zone entries plus the excluded roadways, while the anniversary release describes the 27 million as vehicles "entering the Congestion Relief Zone." We could not confirm which count the 11% figure uses.
We could not retrieve the MTA's first-year report or baseline file, so the 11%, 27 million and 73,000 figures are the MTA's and unchecked by us.
A partial check: two tunnels with pre-toll counts
The MTA's bridges and tunnels crossing data does go back before 2025, but it covers only the facilities the MTA runs. Two of them lead into the zone: the Hugh L. Carey Tunnel and the Queens Midtown Tunnel. Together they accounted for 13.3% of zone entries from January 5 to October 17, 2025. The Lincoln and Holland tunnels and the East River bridges are not in that dataset, so this check says nothing about them.
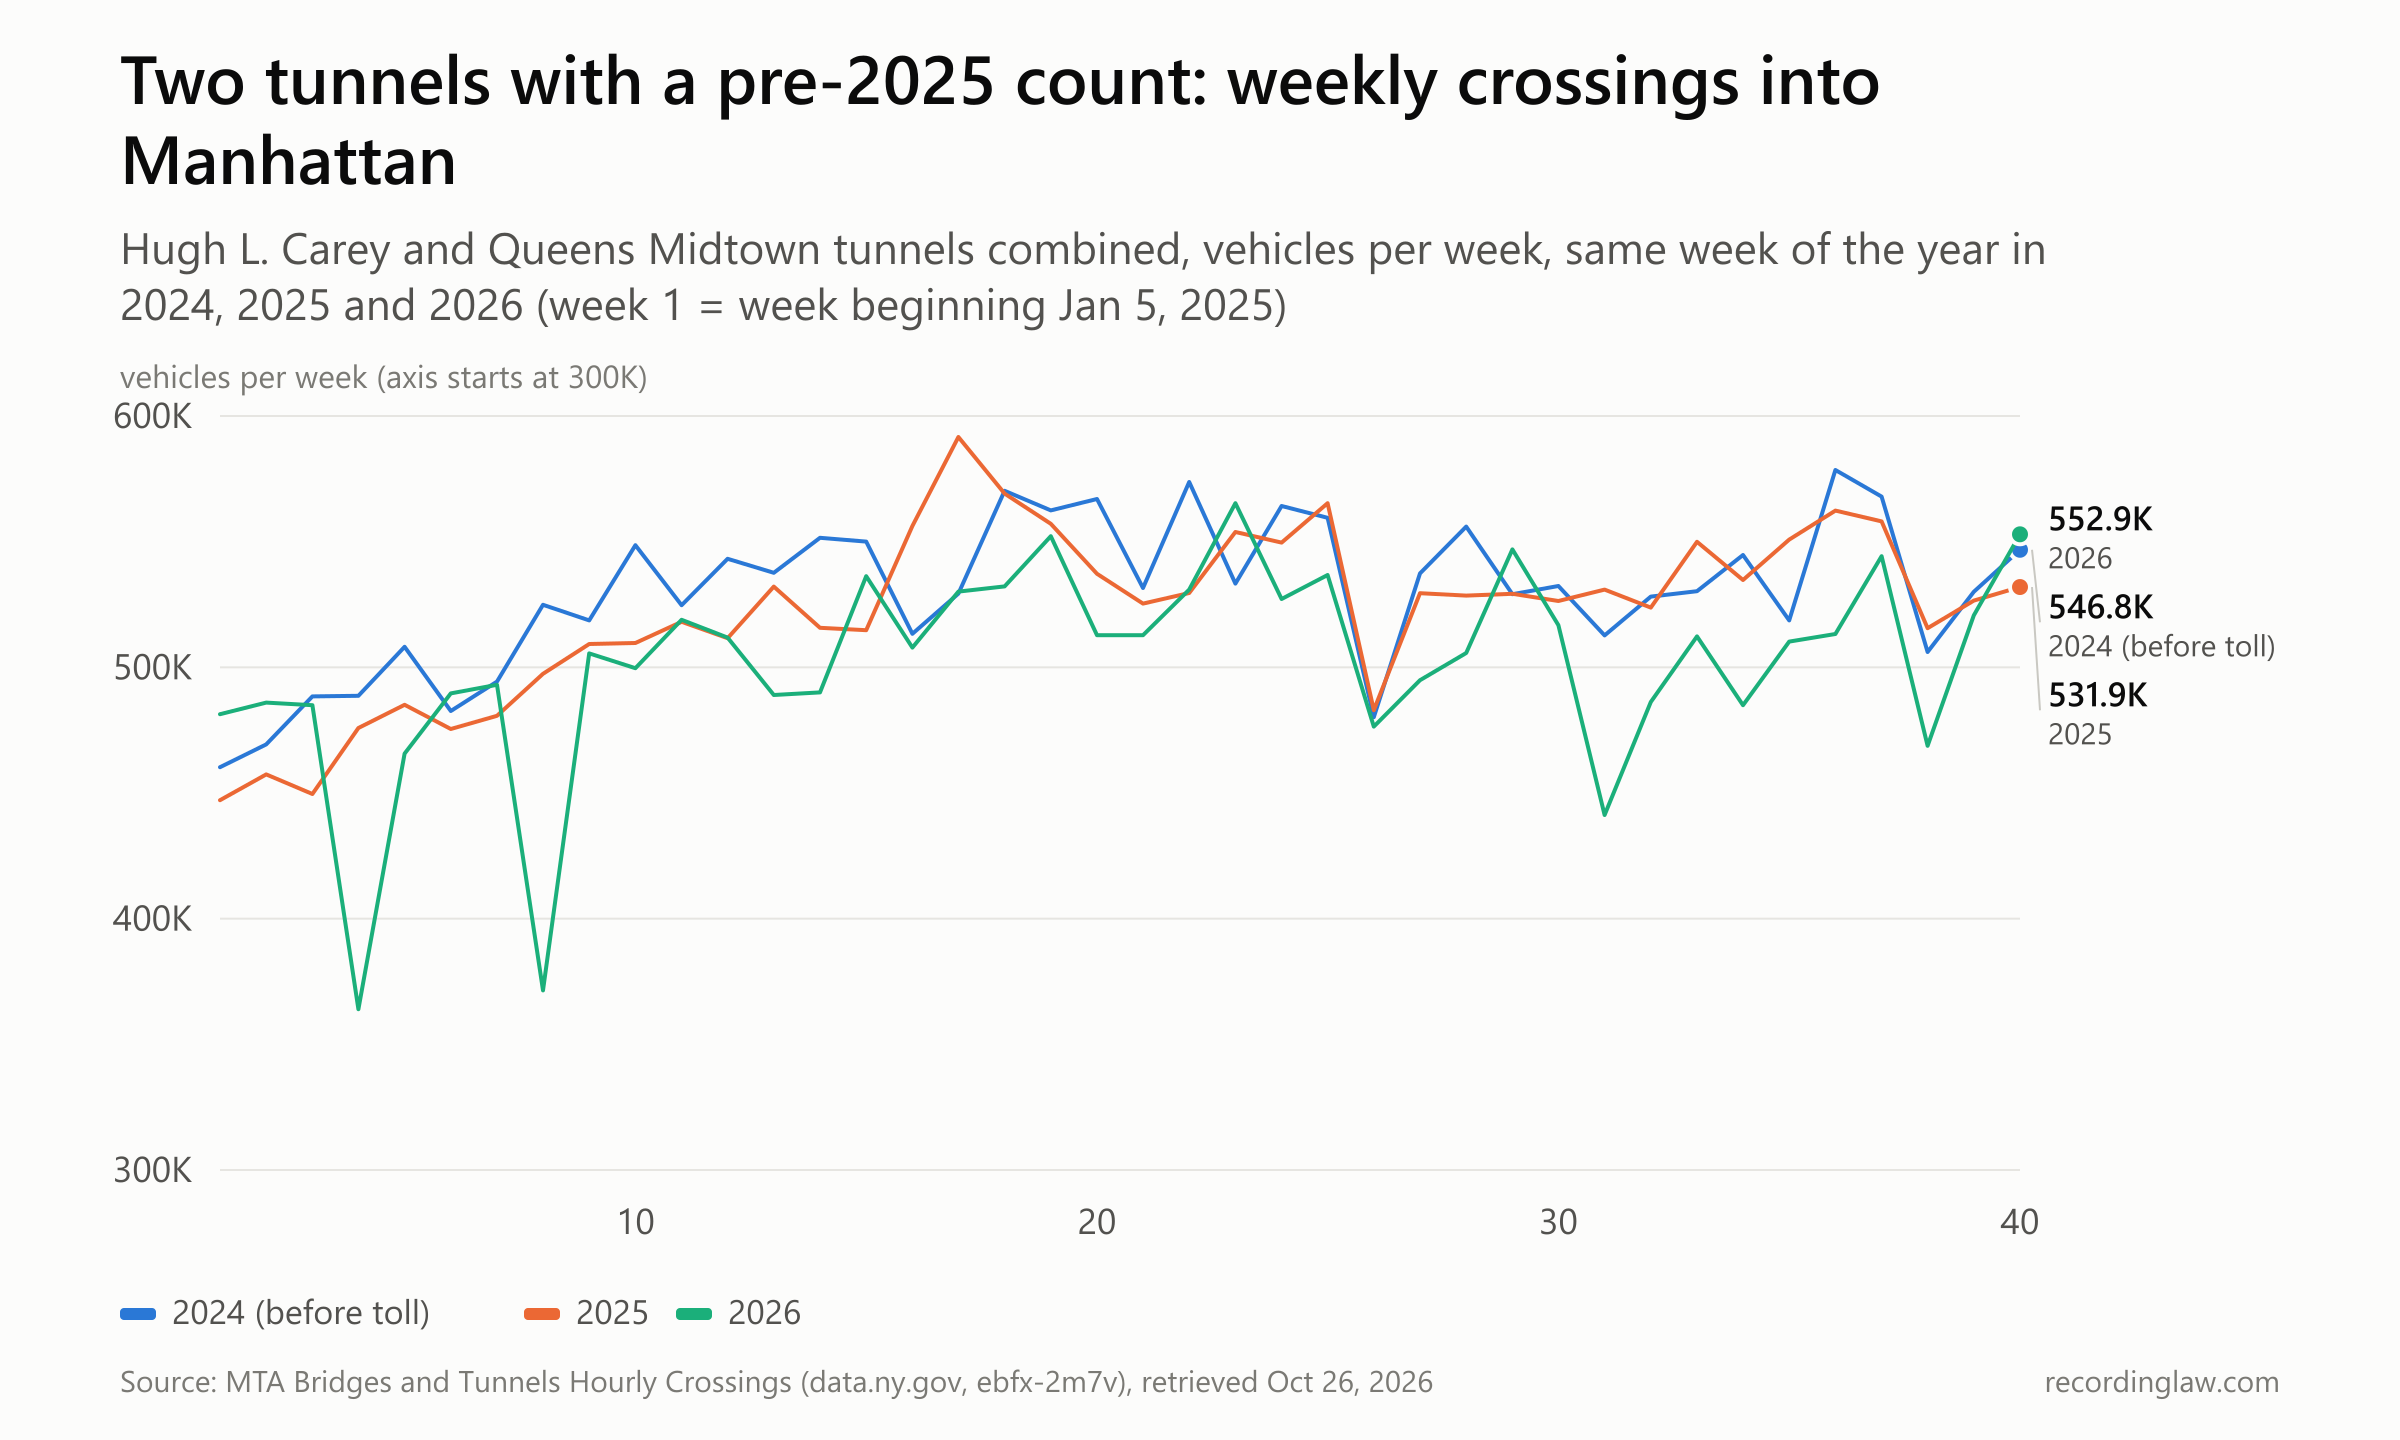
Source: MTA Bridges and Tunnels Hourly Crossings (data.ny.gov, ebfx-2m7v), retrieved October 26, 2026. Week 1 is the week beginning January 5, 2025, aligned to the same week of 2024 and 2026.
| Year (40 aligned weeks) | Crossings into Manhattan | Change vs 2024 |
|---|---|---|
| 2024 (before the toll) | 21,194,449 | |
| 2025 | 20,896,291 | -1.4% |
| 2026 | 20,070,939 | -5.3% |
At these two tunnels, crossings into Manhattan were 1.4% lower in the first 40 weeks of tolling than in the same weeks of 2024. The 2026 figure is 3.9% below 2025 and includes the January and February storm weeks. MTA tolls at both tunnels also rose in January 2026, when one-way passenger-vehicle tolls went up by 20 to 60 cents at every MTA bridge and tunnel. By tunnel, Hugh L. Carey crossings into Manhattan fell 3.3% from 2024 to 2025 (8,871,263 to 8,578,078), while Queens Midtown crossings were nearly unchanged (12,323,186 to 12,318,213). The Schmidt presentation's slides on the two tunnels are headed "Changes Mixed at Queens Midtown Tunnel" and "Fewer Vehicles in Hugh L. Carey Tunnel."
These counts include every vehicle through the tunnels, whether or not it entered the zone. In 2025, 88.2% of crossings into Manhattan at the two tunnels registered as zone entries, and the MTA has said that about 11% or 12% of vehicles stay on the excluded roadways. A 1.4% change at two tunnels does not test the MTA's zone-wide 11% figure, because most entries come through points with no public pre-toll count.
Vehicle miles traveled: two models, two answers
The MTA also publishes a monthly estimate of vehicle miles traveled on zone streets and on the excluded roadways. It is a model, not a count, built from two data sources the MTA labels AGPS and CVD. The published index averages the two and sets January 2024 at 100. The dataset ends in June 2026.
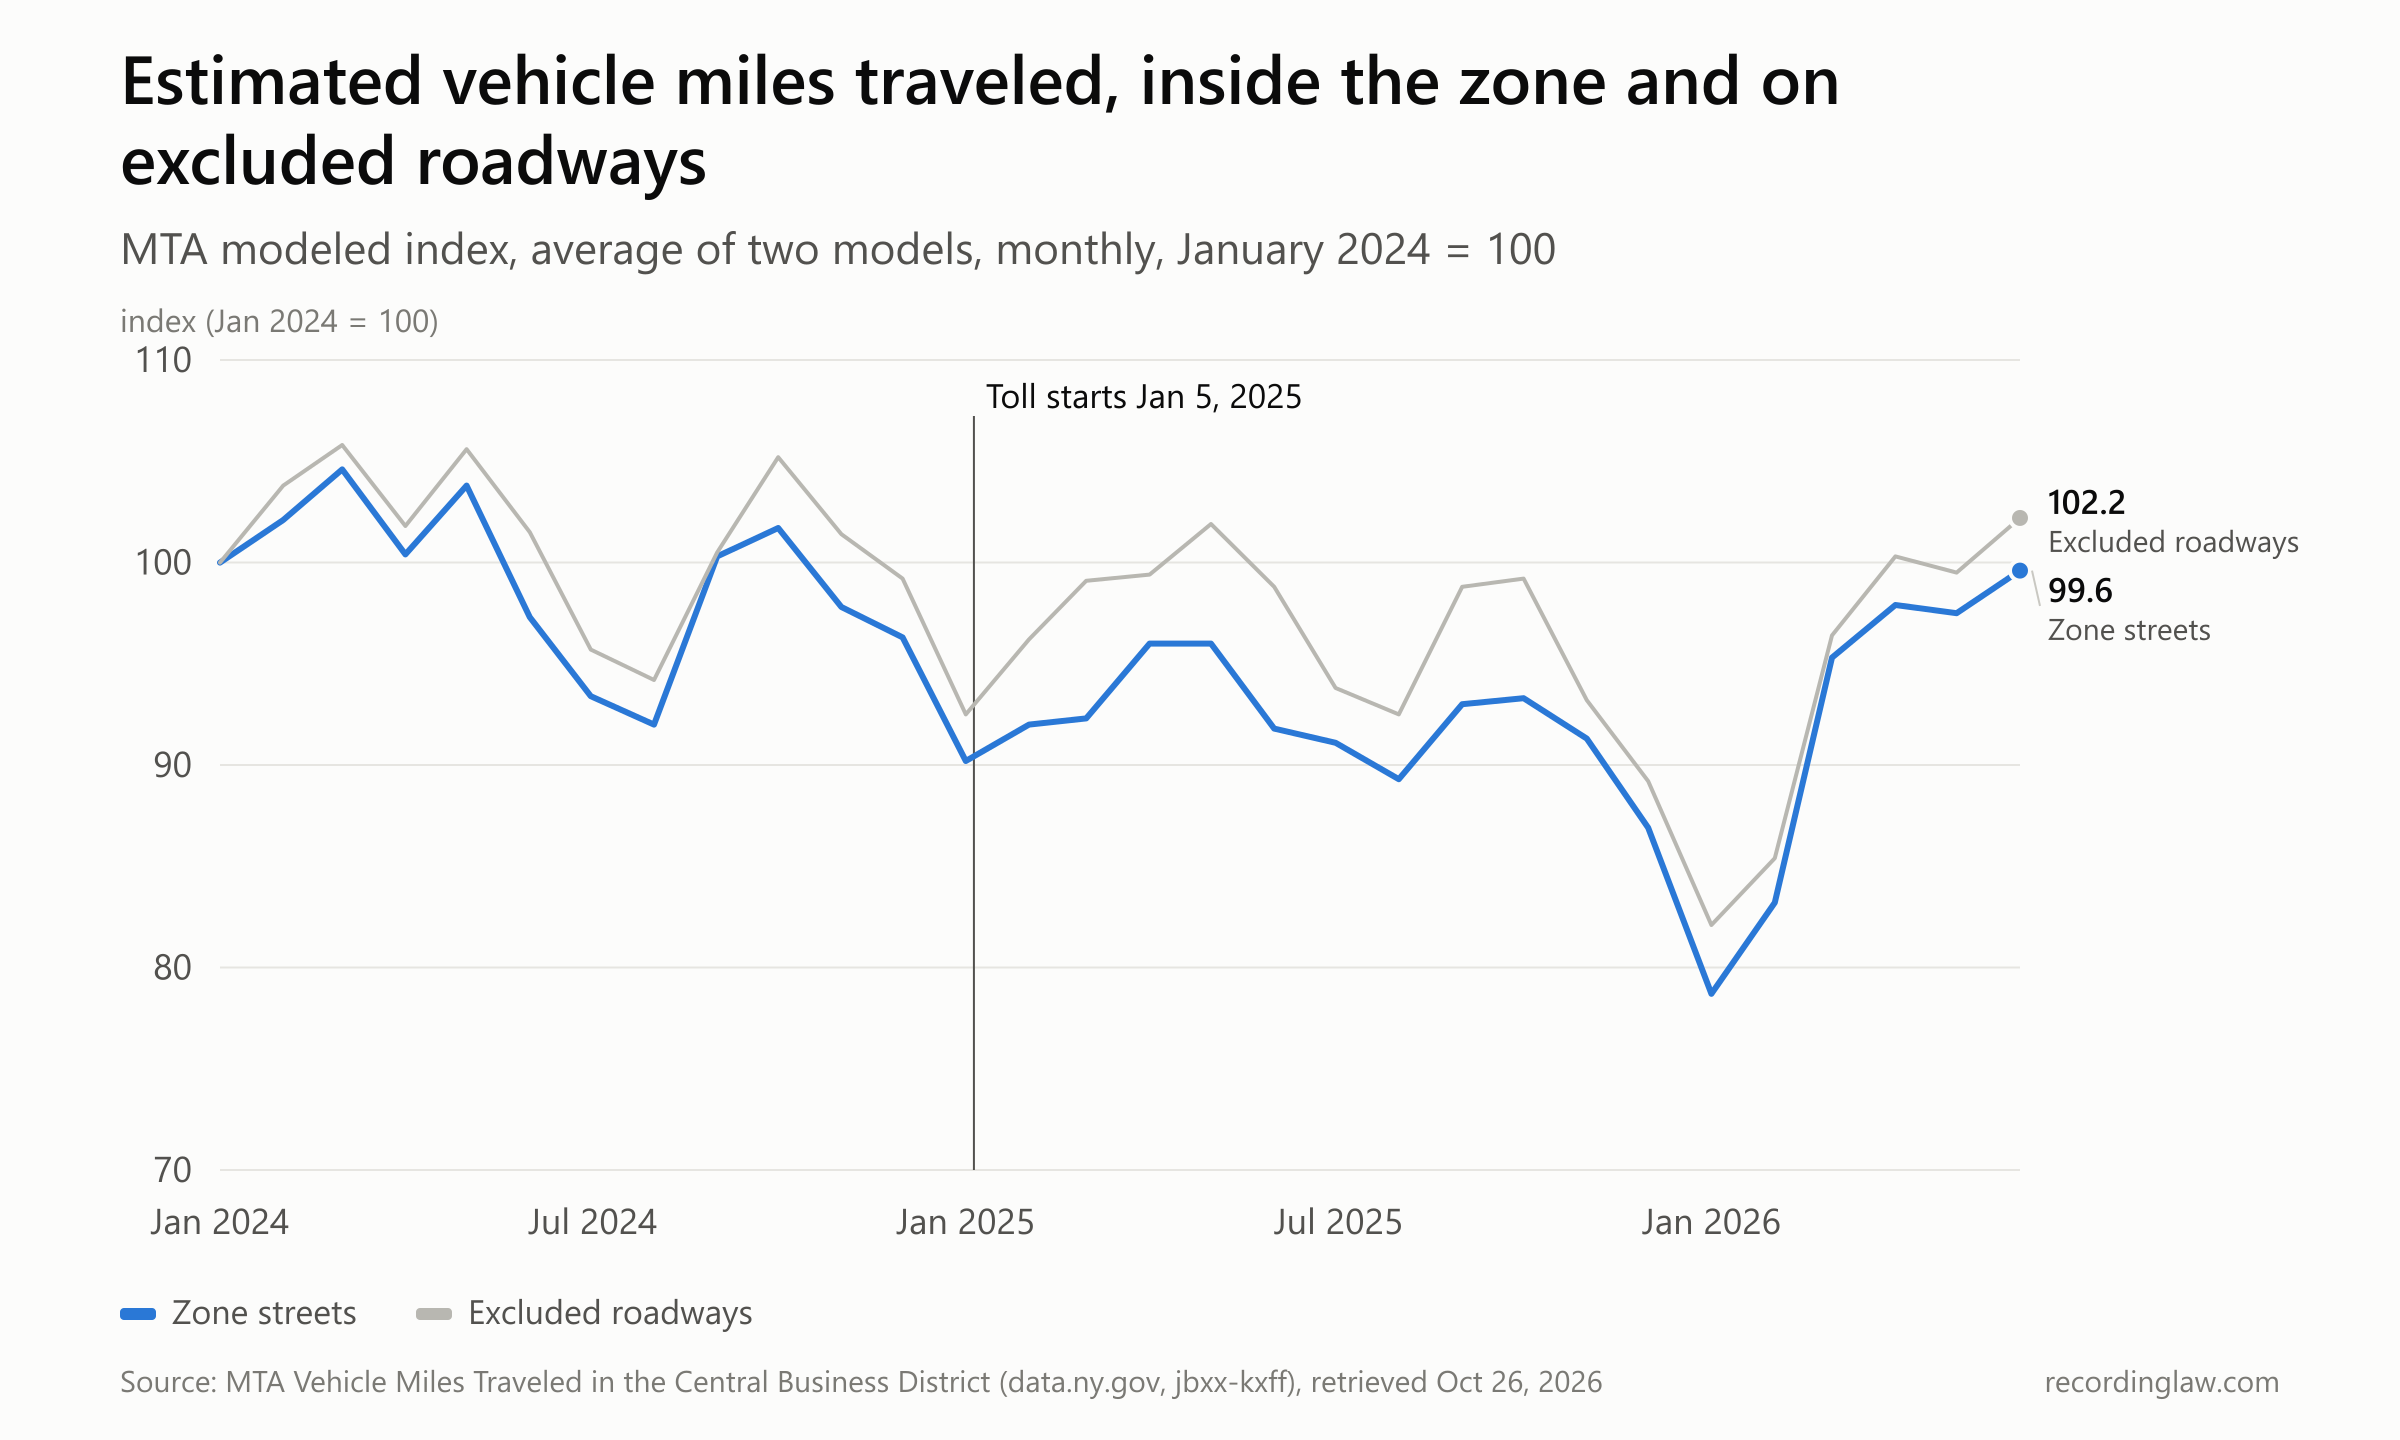
Source: MTA Vehicle Miles Traveled in the Central Business District (data.ny.gov, jbxx-kxff), retrieved October 26, 2026.
| January to June average (index) | 2024 | 2025 | 2026 |
|---|---|---|---|
| Zone streets | 101.4 | 93.0 | 92.0 |
| Excluded roadways | 103.1 | 98.0 | 94.3 |
The two underlying models disagree on how large the change was. For zone streets, comparing January to June 2025 with the same months of 2024, the AGPS model shows daily vehicle miles down 3.6% (3,183,068 to 3,067,720) and the CVD model shows them down 13.1% (2,745,421 to 2,385,949). From 2025 to 2026 over the same months, AGPS shows a 4.6% decrease and CVD a 3.0% increase.
The index fell to 78.7 for zone streets and 82.1 for the excluded roadways in January 2026, part of the period the MTA's March 2026 report links in part to winter storms. By June 2026 it was 99.6 on zone streets and 102.2 on the excluded roadways.
Subway ridership over the same period
Systemwide subway ridership rose in both years of tolling. The figures below cover the whole subway, not only trips into the zone, and they do not separate the toll from other influences such as return-to-office trends or service changes. In January 2026 the MTA also raised the subway base fare from $2.90 to $3.00, made its seven-day OMNY fare cap permanent and stopped selling unlimited-ride MetroCards, so the 2026 comparison spans a fare change. Ridership was already rising before the toll: the same window was 2.6% higher in 2024 than in 2023, or 2.2% per day, since the 2024 window includes February 29.
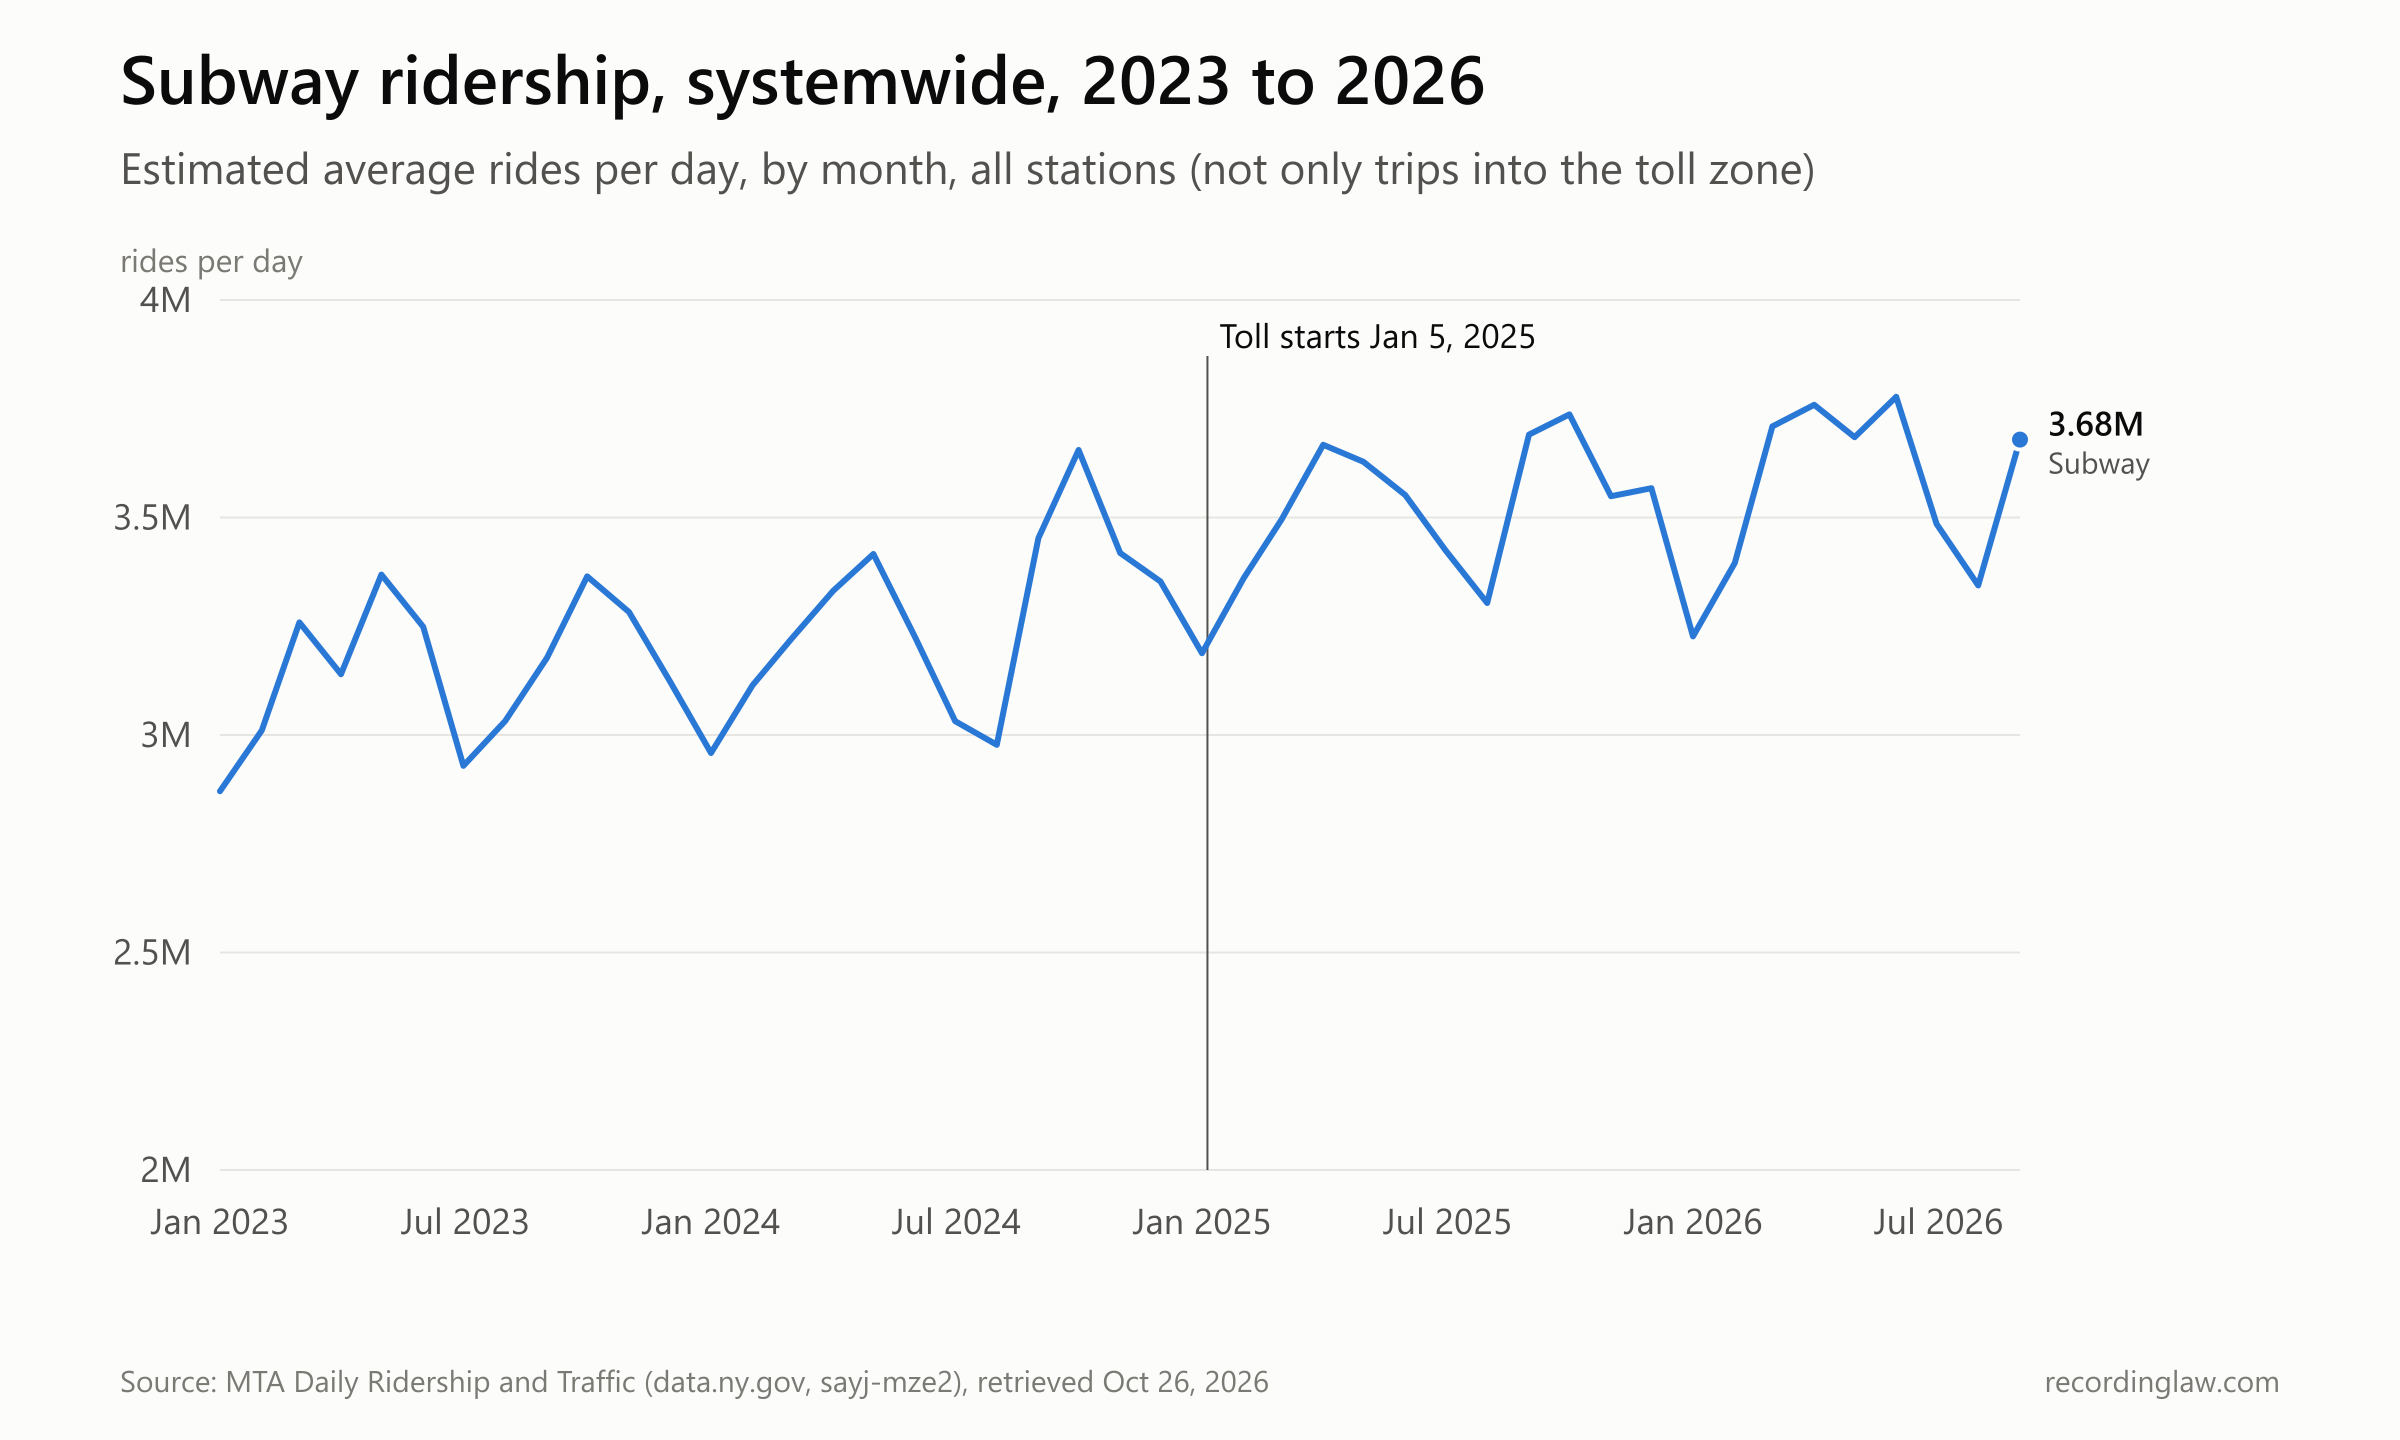
Source: MTA Daily Ridership (data.ny.gov, sayj-mze2), retrieved October 26, 2026.
| January 5 to September 30 | Subway rides | Change vs prior year |
|---|---|---|
| 2023 | 840,343,557 | |
| 2024 | 862,338,280 | +2.6% |
| 2025 | 938,681,161 | +8.9% |
| 2026 | 962,913,798 | +2.6% |
Average daily ridership in September was 3,452,625 in 2024, 3,690,550 in 2025 and 3,679,070 in 2026. The MTA's first-anniversary release reported that subway trips entering the zone rose 9%, express bus trips 7.8% and local bus trips 8.4%. We did not chart bus ridership because the systemwide bus series has an unexplained step up in September and October 2024 that would distort a year-over-year comparison.
Toll revenue
The MTA's statement of operations reports toll revenue for the tolling program each month. These figures are on an accrual basis and are before program expenses.
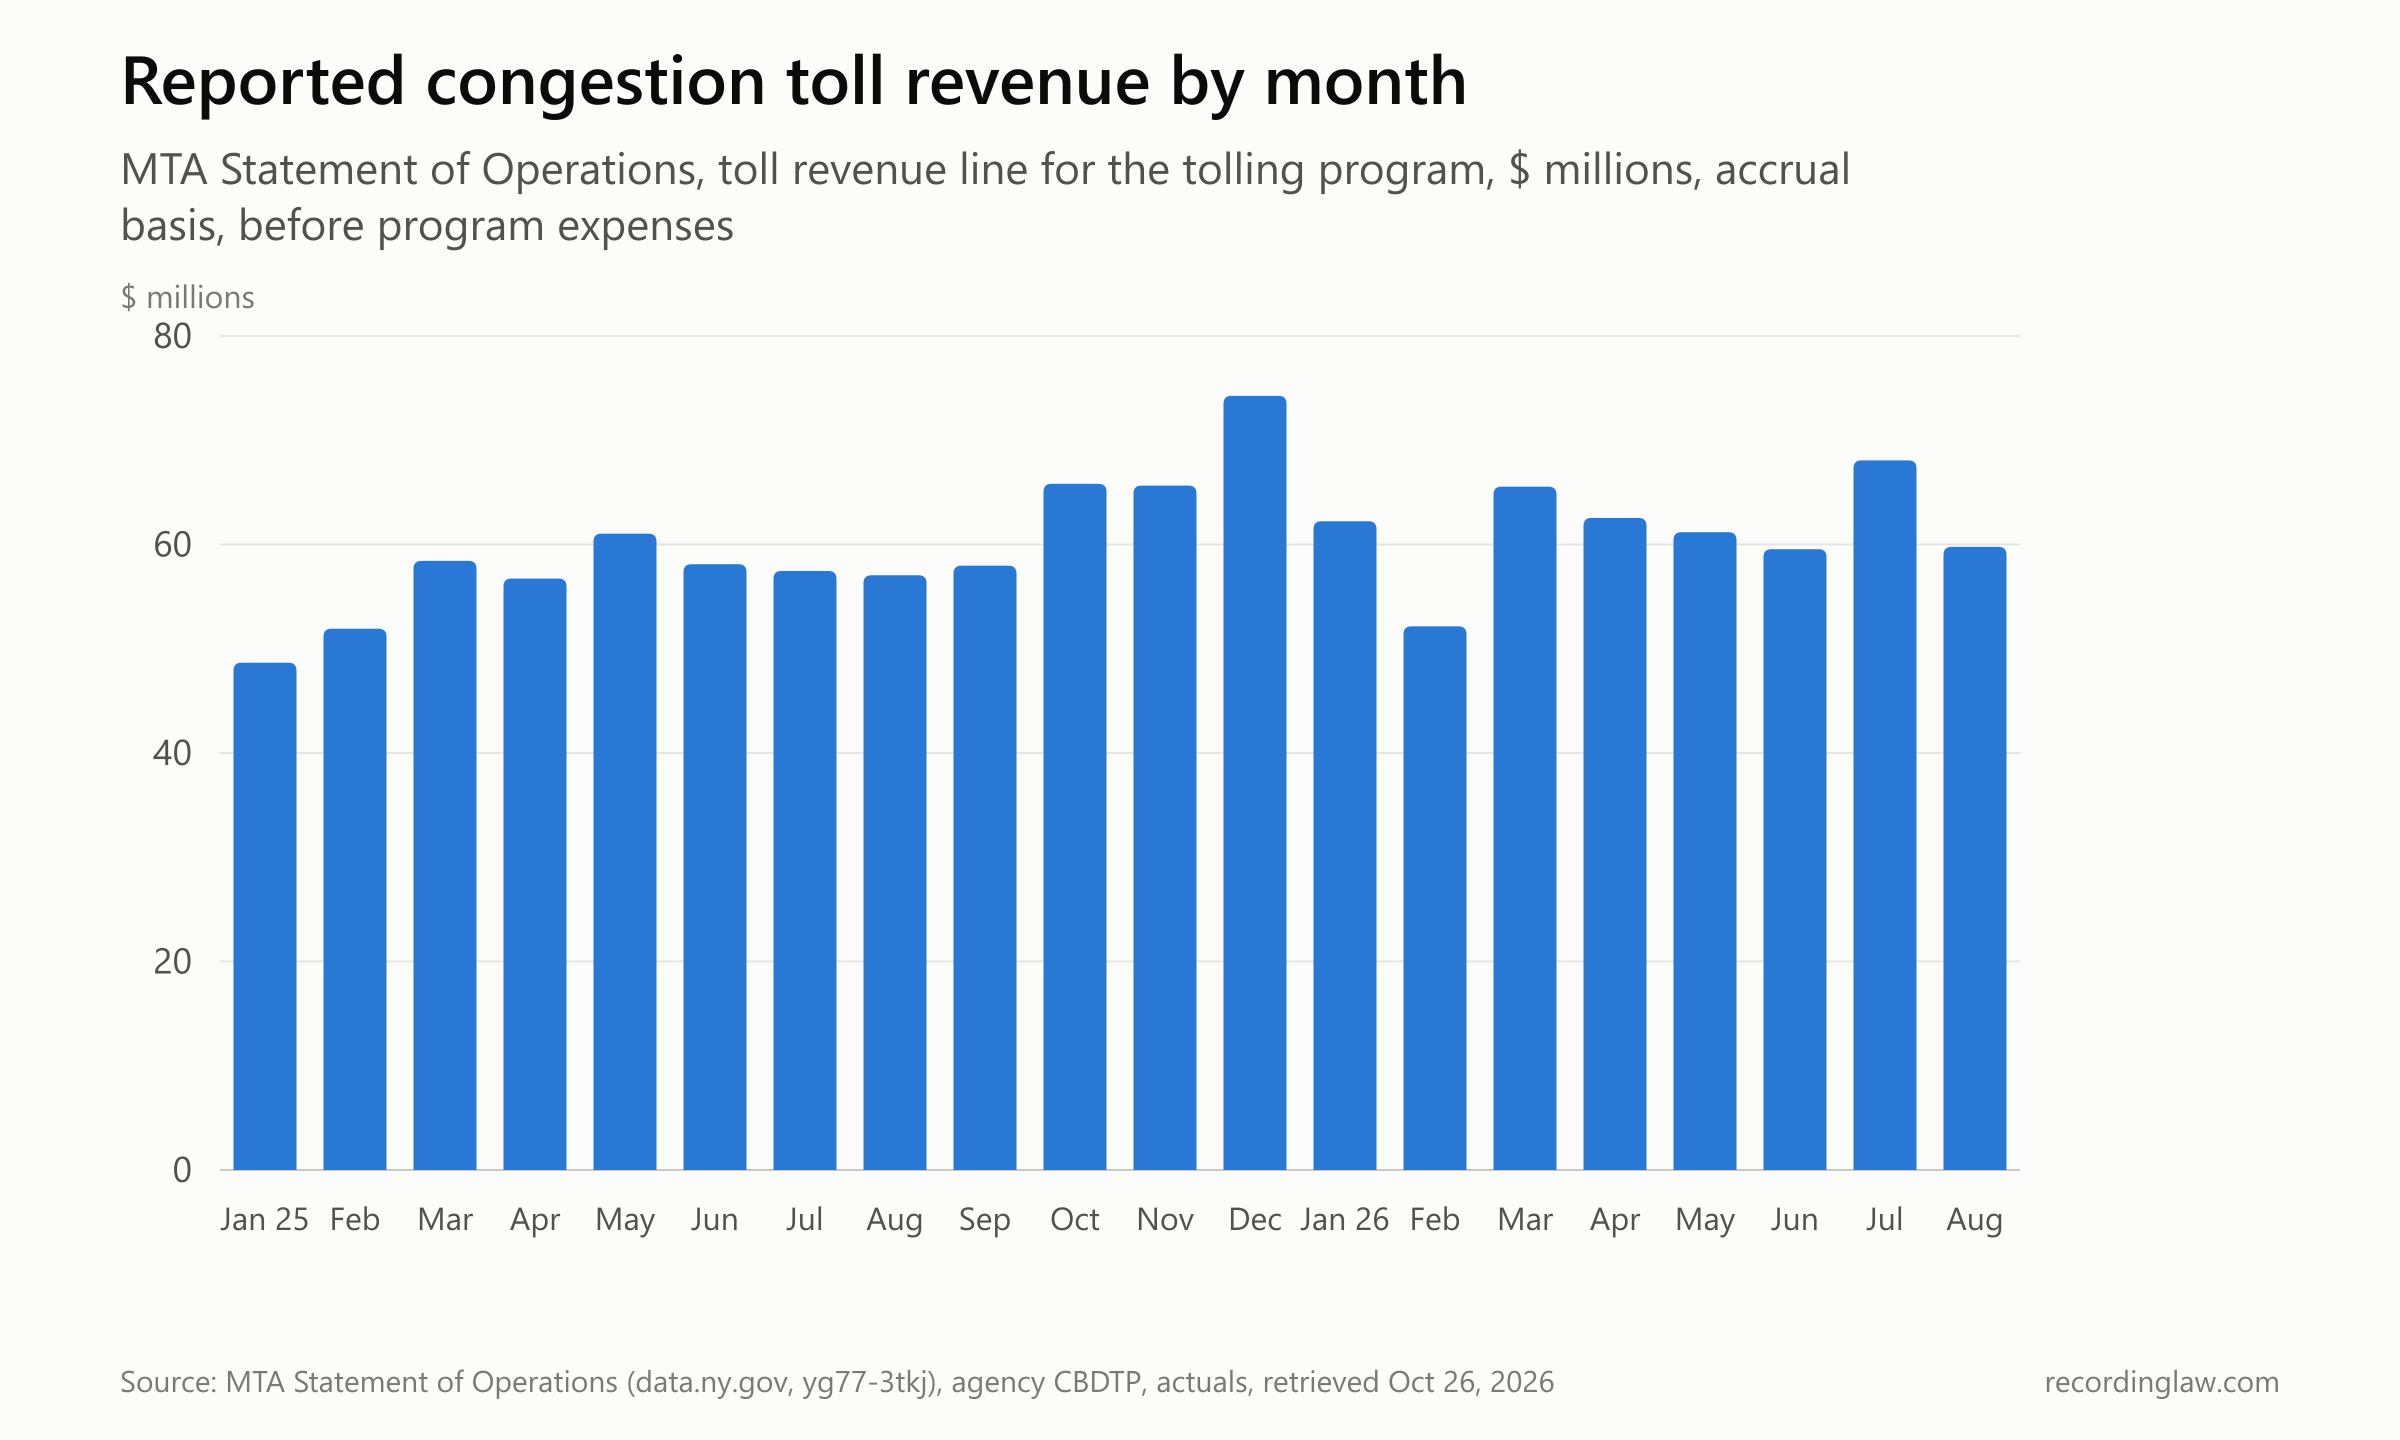
Source: MTA Statement of Operations (data.ny.gov, yg77-3tkj), retrieved October 26, 2026.
| Period | Toll revenue (accrual, before expenses) |
|---|---|
| 2025, full year | $713.1 million |
| January to August 2025 | $449.4 million |
| January to August 2026 | $491.0 million |
| Highest month (December 2025) | $74.3 million |
January 2025 covers 27 days of tolling. The same dataset shows $138.1 million in program expense rows for 2025. The MTA's January 2026 bridges and tunnels performance report gave the program's 2025 actuals as $701.2 million in total revenue, $139.2 million in program expenses and an accrued net surplus of $562.0 million. That revenue total is $11.9 million below the open dataset's $713.1 million. The open data figure is the statement of operations' "Toll Revenue" ledger line; the report's figure is labeled "Total revenue" with no further breakdown, and neither source explains the difference. The MTA's March 2026 report put January and February 2026 revenue at $114.4 million against a budget of $100.9 million, with $18.2 million in program expenses.
The federal court case
The toll took effect after federal review and approval. The Federal Highway Administration approved the program's final environmental assessment in May 2023 and signed a finding of no significant impact on June 23, 2023. On November 21, 2024, state and city transportation agencies and the bridges and tunnels authority signed an agreement with the FHWA under the federal Value Pricing Pilot Program.
On February 19, 2025, U.S. Transportation Secretary Sean Duffy sent a letter rescinding that approval and terminating the agreement, with an FHWA follow-up setting March 21, 2025 as the date tolling was to stop. The MTA and the bridges and tunnels authority sued the same day in the Southern District of New York. Judge Liman issued a preliminary injunction on May 28, 2025, and tolling continued while the case proceeded.
On March 3, 2026, in Metropolitan Transportation Authority v. Duffy, No. 25-cv-1413, the court granted the MTA's motion for partial summary judgment and granted the federal government's motion for summary judgment in part. The court declared that the Secretary may end the agreement only under its express terms, that the termination was unlawful, and that enforcing the February 19 or a later April 21 letter would be unlawful. The ruling rested on the Administrative Procedure Act. The opinion also held that the Secretary was not required to prepare an environmental impact statement before the February 19 letter.
As its remedy, the court vacated the February 19 and April 21 letters under the Administrative Procedure Act and directed entry of a declaratory judgment. It declined to enter a permanent injunction, holding that the plaintiffs had not shown one was needed in addition to vacatur.
Final judgment was entered on March 5, 2026. The federal government filed a notice of appeal, and the Second Circuit opened the appeal as No. 26-1213 on May 4, 2026. Briefing closed when the government filed its reply brief on October 7, 2026. As of the docket's October 16, 2026 update, no argument date or decision is listed.
How we measured
Zone entries. We summed the crz_entries field of the MTA Congestion Relief Zone Vehicle Entries dataset (data.ny.gov, t6yz-b64h) by week, month, vehicle class and detection group, using server-side queries. Weeks run Sunday to Saturday. Entries on the excluded roadways are a separate field and are not included. The dataset notes that it should not be used for revenue, because it lacks exemption status, payment method and repeat-entry information. Year-over-year comparisons use January 5 to October 17 in both years.
Pre-toll check. From the MTA Bridges and Tunnels hourly crossings dataset (ebfx-2m7v), we summed northbound Hugh L. Carey Tunnel and westbound Queens Midtown Tunnel crossings into Manhattan for 40 weeks, aligning each 2024 and 2026 week to the same week of 2025 (week 1 begins January 5, 2025). These counts include vehicles that stayed on the excluded roadways. There is no public pre-toll count for the other 10 entry points: Port Authority's open data for the Lincoln and Holland tunnels ends in 2015, and we did not obtain New York City bridge counts.
Vehicle miles. The MTA's vehicle miles dataset (jbxx-kxff) is a model estimate. We report the published average index and the two underlying model series separately because they diverge. Monthly figures run January 2024 to June 2026.
Subway ridership. From the MTA daily ridership dataset (sayj-mze2), mode "Subway," systemwide, summed for January 5 to September 30 and averaged by complete month. It is not limited to trips into the zone. The 2024 window has 270 days, against 269 in the other years, because of February 29; per day, 2024 was 2.2% above 2023 and 2025 was 9.3% above 2024.
Revenue. From the MTA statement of operations (yg77-3tkj), the tolling program's toll revenue line, actuals, accrual basis, gross of program expenses. Our gross-minus-expense arithmetic from this dataset does not match the $562.0 million net surplus in the MTA's January 2026 report, so we report the MTA's net figure as the MTA stated it.
What this data cannot show. It cannot show the zone-wide change from before the toll, where diverted trips went, or how much of any change came from the toll rather than weather, office attendance, transit service, the January 2026 fare and toll increases or the economy. Daylight-saving weeks contain 23 or 25 hours. We did not analyze crashes, air quality or parking, and we report none of the claims made on those subjects.
Frequently Asked Questions
How much is the Manhattan congestion toll?
Most cars, pickups and small commercial vehicles with E-ZPass pay $9 during peak hours (5 a.m. to 9 p.m. weekdays, 9 a.m. to 9 p.m. weekends) and $2.25 overnight, charged once per day. Single-unit trucks pay $14.40 and multi-unit trucks $21.60 at peak. The MTA says the car toll will rise to $12 in 2028 and $15 in 2031.
Did congestion pricing reduce traffic by 11 percent?
That is the MTA's figure: it reports 27 million fewer vehicles in the first year, an 11% reduction, measured against a baseline built from October 2023 data with seasonal adjustments. That baseline is not in the open data, and we could not reproduce it. The open data shows a 4.1% decrease in zone entries from the first year of tolling to the second, over January 5 to October 17.
Is there any public pre-toll traffic count to compare against?
Only for two MTA tunnels, the Hugh L. Carey and Queens Midtown, which carry about 13% of zone entries. Crossings into Manhattan there were 1.4% lower over 40 weeks of 2025 than the same weeks of 2024, and 5.3% lower in 2026 than in 2024. That covers too small a share of entries to test the zone-wide figure.
Which vehicles changed the most?
Comparing January 5 to October 17, 2026 with the same dates in 2025, cars, pickups and vans fell 7.4%, multi-unit trucks fell 24.7% and motorcycles fell 32.3%. Taxi and for-hire vehicle entries rose 1.6%.
Did subway ridership go up because of the toll?
Systemwide subway ridership rose 8.9% in 2025 and 2.6% in 2026 over the January 5 to September 30 period, and the MTA reports that subway trips into the zone rose 9% in the first year. Ridership was already rising before the toll, and the systemwide counts cannot separate the toll from other factors.
How much money has the toll raised?
The MTA's January 2026 bridges and tunnels report put 2025 tolling-program revenue at $701.2 million, program expenses at $139.2 million and the accrued net surplus at $562.0 million. The MTA's statement of operations open data shows $713.1 million in toll revenue for 2025, a figure neither source reconciles with the report, and $491.0 million for January to August 2026.
Is congestion pricing still legal?
On March 3, 2026, a federal judge in Manhattan ruled that the U.S. Department of Transportation's February 2025 termination of federal approval was unlawful under the Administrative Procedure Act. The government appealed to the Second Circuit (No. 26-1213). As of October 2026 the appeal has not been decided, and tolling continues.
Updates
Independently fact-checked against the cited primary sources
Sources and References
- MTA Congestion Relief Zone Vehicle Entries: Beginning 2025 (data.ny.gov, t6yz-b64h)(data.ny.gov).gov
- MTA Bridges and Tunnels Hourly Crossings (data.ny.gov, ebfx-2m7v)(data.ny.gov).gov
- MTA Vehicle Miles Traveled in the Central Business District (data.ny.gov, jbxx-kxff)(data.ny.gov).gov
- MTA Daily Ridership (data.ny.gov, sayj-mze2)(data.ny.gov).gov
- MTA Statement of Operations (data.ny.gov, yg77-3tkj)(data.ny.gov).gov
- MTA, Congestion Relief Zone tolling rates(congestionreliefzone.mta.info).gov
- MTA press release, congestion pricing first anniversary (January 2026)(mta.info).gov
- MTA press release, granular data on traffic patterns after launch (January 30, 2025)(mta.info).gov
- MTA Bridges and Tunnels, March 2026 performance metrics report(mta.info).gov
- Adam Schmidt, Citizens Budget Commission, presentation at the Transportation Research Board webinar NYC Congestion Pricing: Modeling a New Reality (June 9, 2026)(onlinepubs.trb.org)
- Metropolitan Transportation Authority v. Duffy, No. 25-cv-1413 (S.D.N.Y. Mar. 3, 2026), opinion and order(storage.courtlistener.com)
- Metropolitan Transportation Authority v. Duffy, No. 26-1213 (2d Cir.), docket(courtlistener.com)
- amNY, report on the federal notice of appeal (May 2026)(amny.com)
- N.Y. Vehicle and Traffic Law 1704-a, central business district toll(nysenate.gov).gov
- MTA Bridges and Tunnels, January 2026 key performance metrics report (2025 December year-to-date)(mta.info).gov
- MTA press release, MTA Board adopts fare and toll increases to take effect January 2026(mta.info).gov
- MTA, 2026 fare change materials (September 30, 2025)(mta.info).gov