Save Our Homes Kept $815 Billion Off Florida's 2026 Assessments; What Amendment 3 Would Change
Independently fact-checked against primary sources (last audited October 26, 2026). · 9 primary sources cited on this page. How we verify our legal content
Florida's Save Our Homes cap limits how fast the assessed value of a homestead can rise each year. In the preliminary 2026 figures from the Florida Department of Revenue, the gap it created between market value and assessed value was $815.14 billion statewide, down from a peak of $929.10 billion in 2024. That equals 14.83% of the just value of all Florida property, $5.497 trillion.
On November 3, 2026, Florida voters decide Amendment 3, which would add a $150,000, then $250,000, homestead exemption from county, city and other non-school property taxes. Florida's Revenue Estimating Conference estimated that, if approved, it would reduce local non-school property tax revenue by $4.93 billion in fiscal 2027-28, the first year with an impact, and by $11.83 billion a year on a recurring basis. The amendment needs 60% of the vote to pass.
What Save Our Homes does
Florida voters adopted Save Our Homes as Constitutional Amendment 10 in 1992. Under section 193.155, Florida Statutes, beginning in 1995 (or the year after a property first receives a homestead exemption), the assessed value of a homestead can rise each year by no more than the lower of 3% or the change in the Consumer Price Index.
Market value, which Florida calls just value, is not limited. When home prices rise faster than the cap, the gap between just value and assessed value grows. The Department of Revenue reports that gap statewide as the Save Our Homes differential. Property taxes are levied on assessed value minus exemptions, so the differential is value that is not taxed.
Florida's portability rule lets an owner move up to $500,000 of accumulated Save Our Homes benefit to a new homestead, if the owner had a homestead exemption on January 1 of any of the three preceding years. The Florida homestead exemption page covers how the current exemption works and how to file.
How the gap grew, shrank and grew again
The statewide differential was $27.82 billion in 2000. It rose to $427.45 billion in 2007 as just value climbed, then fell to $56.27 billion in 2012 while statewide just value dropped from $2.664 trillion (2007) to $1.811 trillion (2012).
It grew again from 2013. Between 2021 and 2023, statewide just value rose from $3.307 trillion to $4.853 trillion, and the differential rose from $367.55 billion to $893.24 billion. It peaked at $929.10 billion in 2024.
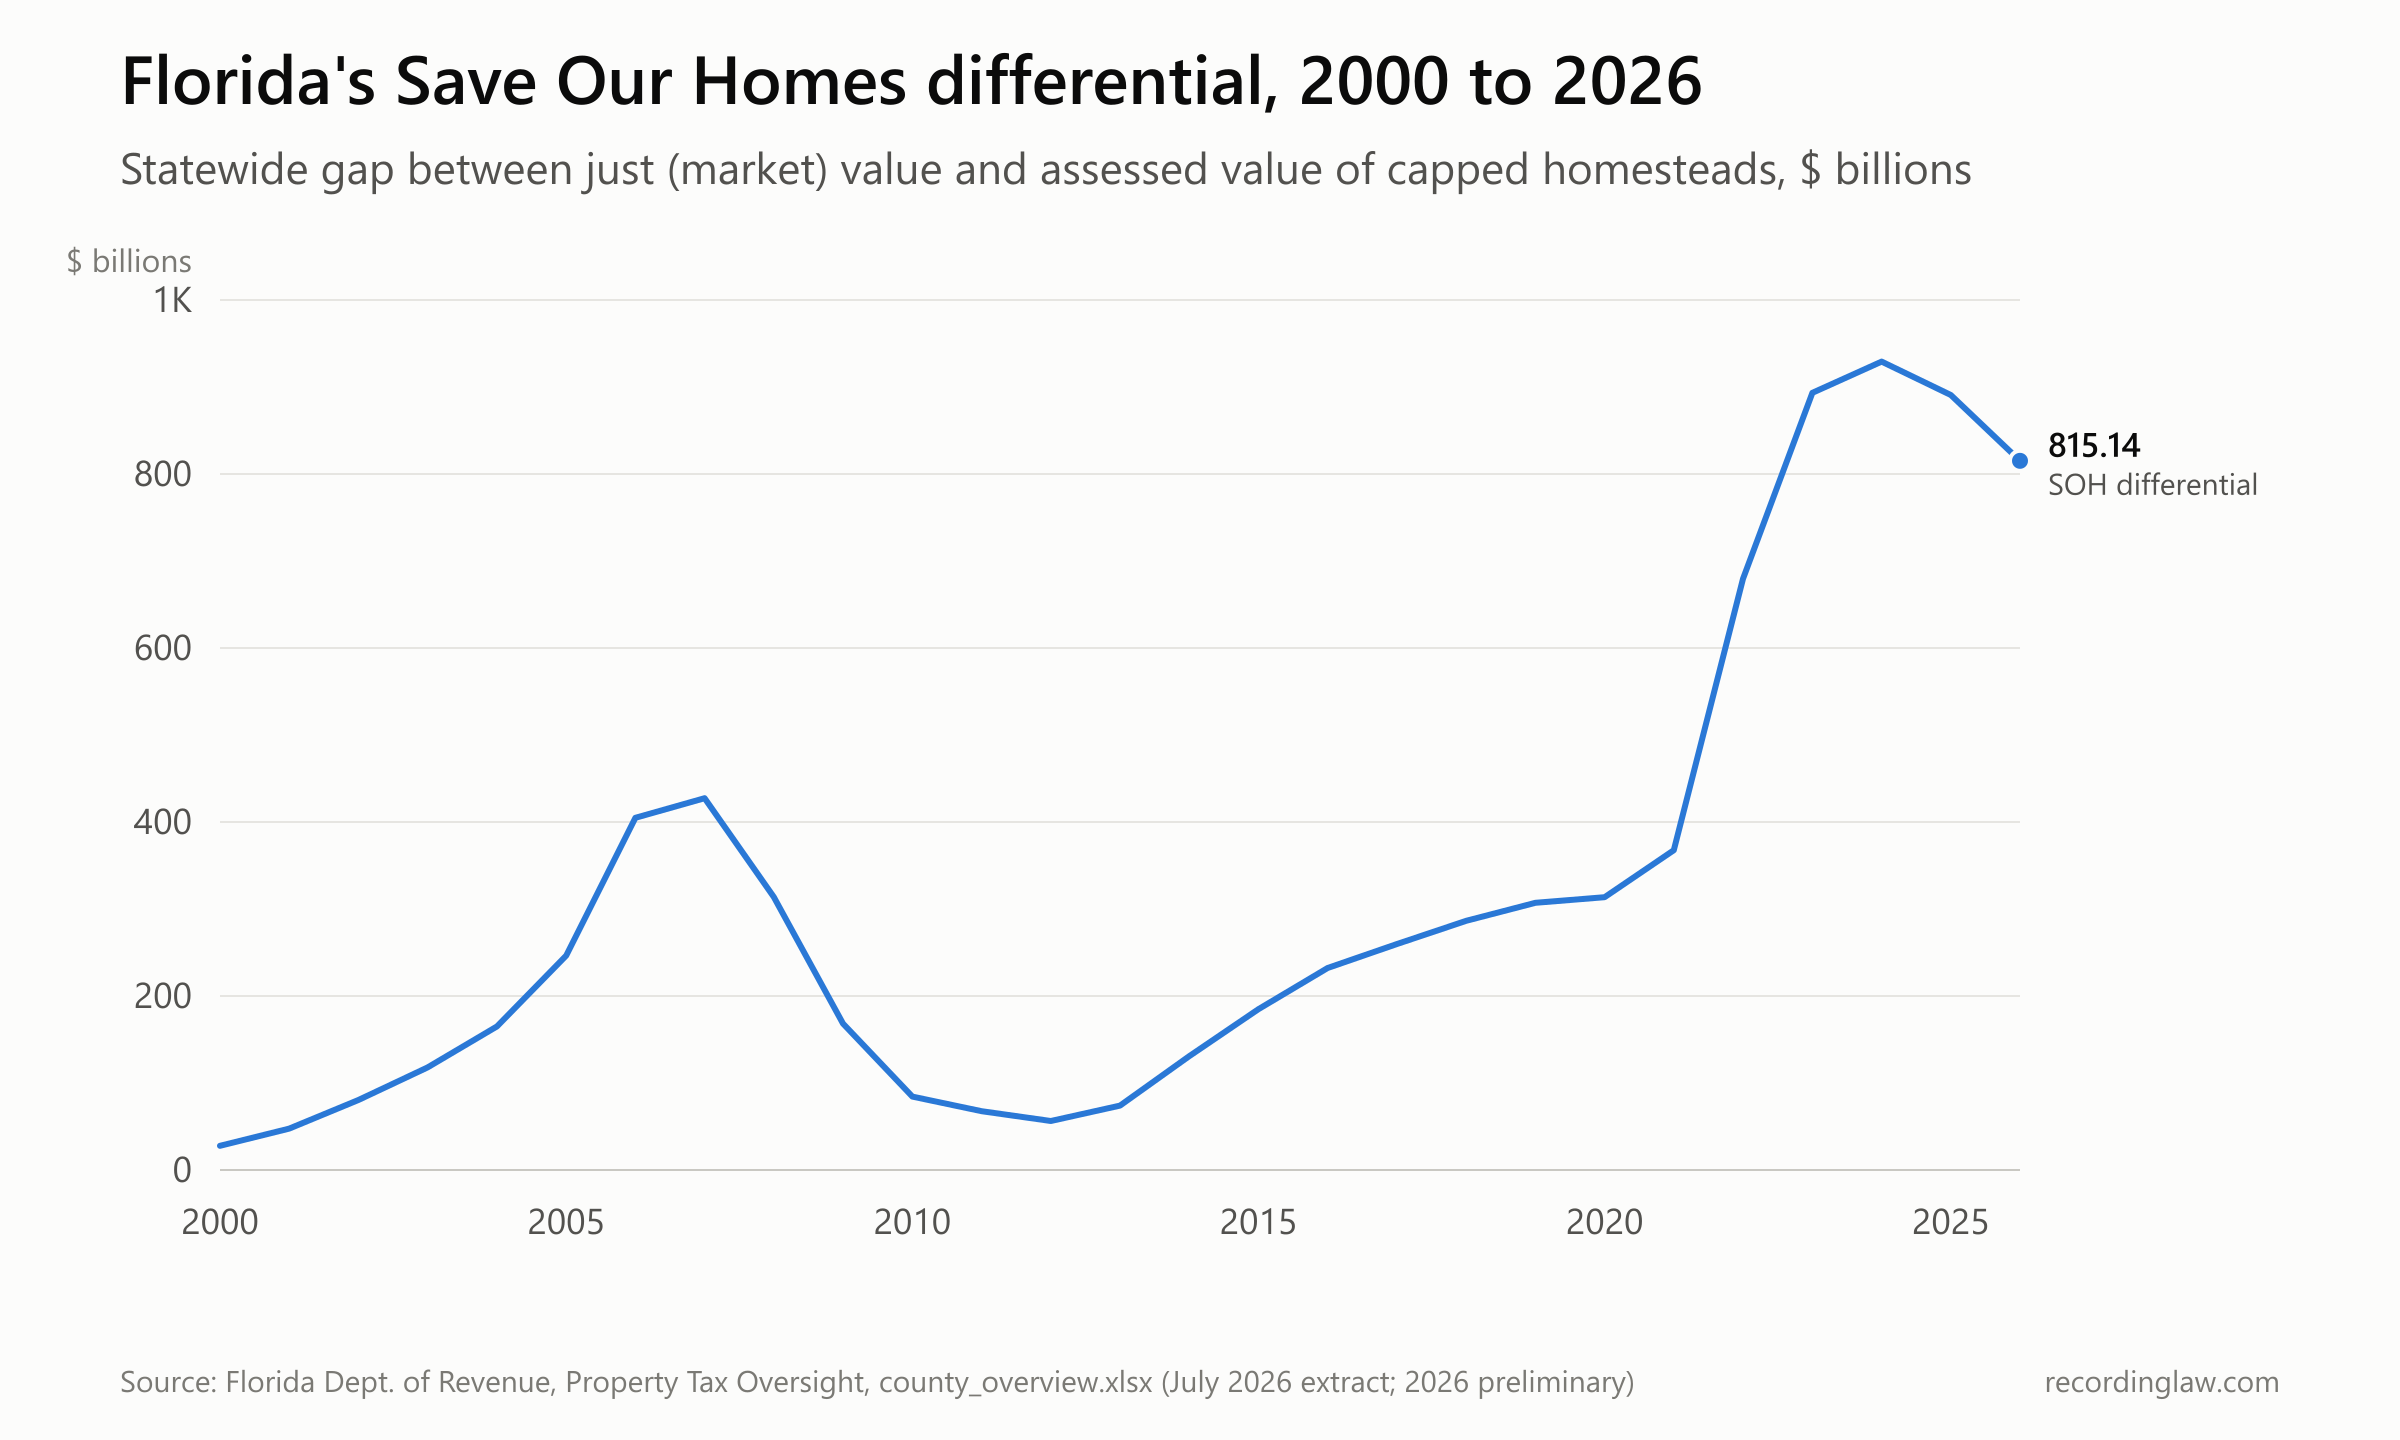
Statewide Save Our Homes differential, $ billions, 2000-2026. Source: Florida Department of Revenue, county_overview.xlsx. 2026 is preliminary.
| Year | SOH differential | Statewide just value (all property) | Differential as % of just value |
|---|---|---|---|
| 2000 | $27.82B | $1,001.26B | 2.78% |
| 2006 | $404.78B | $2,437.44B | 16.61% |
| 2007 | $427.45B | $2,663.57B | 16.05% |
| 2012 | $56.27B | $1,811.39B | 3.11% |
| 2021 | $367.55B | $3,307.36B | 11.11% |
| 2023 | $893.24B | $4,853.40B | 18.40% |
| 2024 | $929.10B | $5,172.74B | 17.96% |
| 2025 | $890.85B | $5,372.07B | 16.58% |
| 2026 (prelim.) | $815.14B | $5,497.13B | 14.83% |
From 2025 to 2026, the differential fell 8.5% while statewide just value rose 2.3%. The Department of Revenue data show the change but do not explain it, and no source we reviewed attributes it to a specific cause.
The percentage column divides the differential by the just value of all property, including businesses, rental housing and land, not homesteads alone. A separate 2025 analysis by the Legislature's Office of Economic and Demographic Research (EDR) found assessment differentials, chiefly Save Our Homes and portability, reduced homestead just value by 37.6%.
When the 3% limit applied
In most years the CPI change was below 3%, so the cap applied was the CPI figure itself. The 3% limit bound only when the CPI change used for that year was higher.
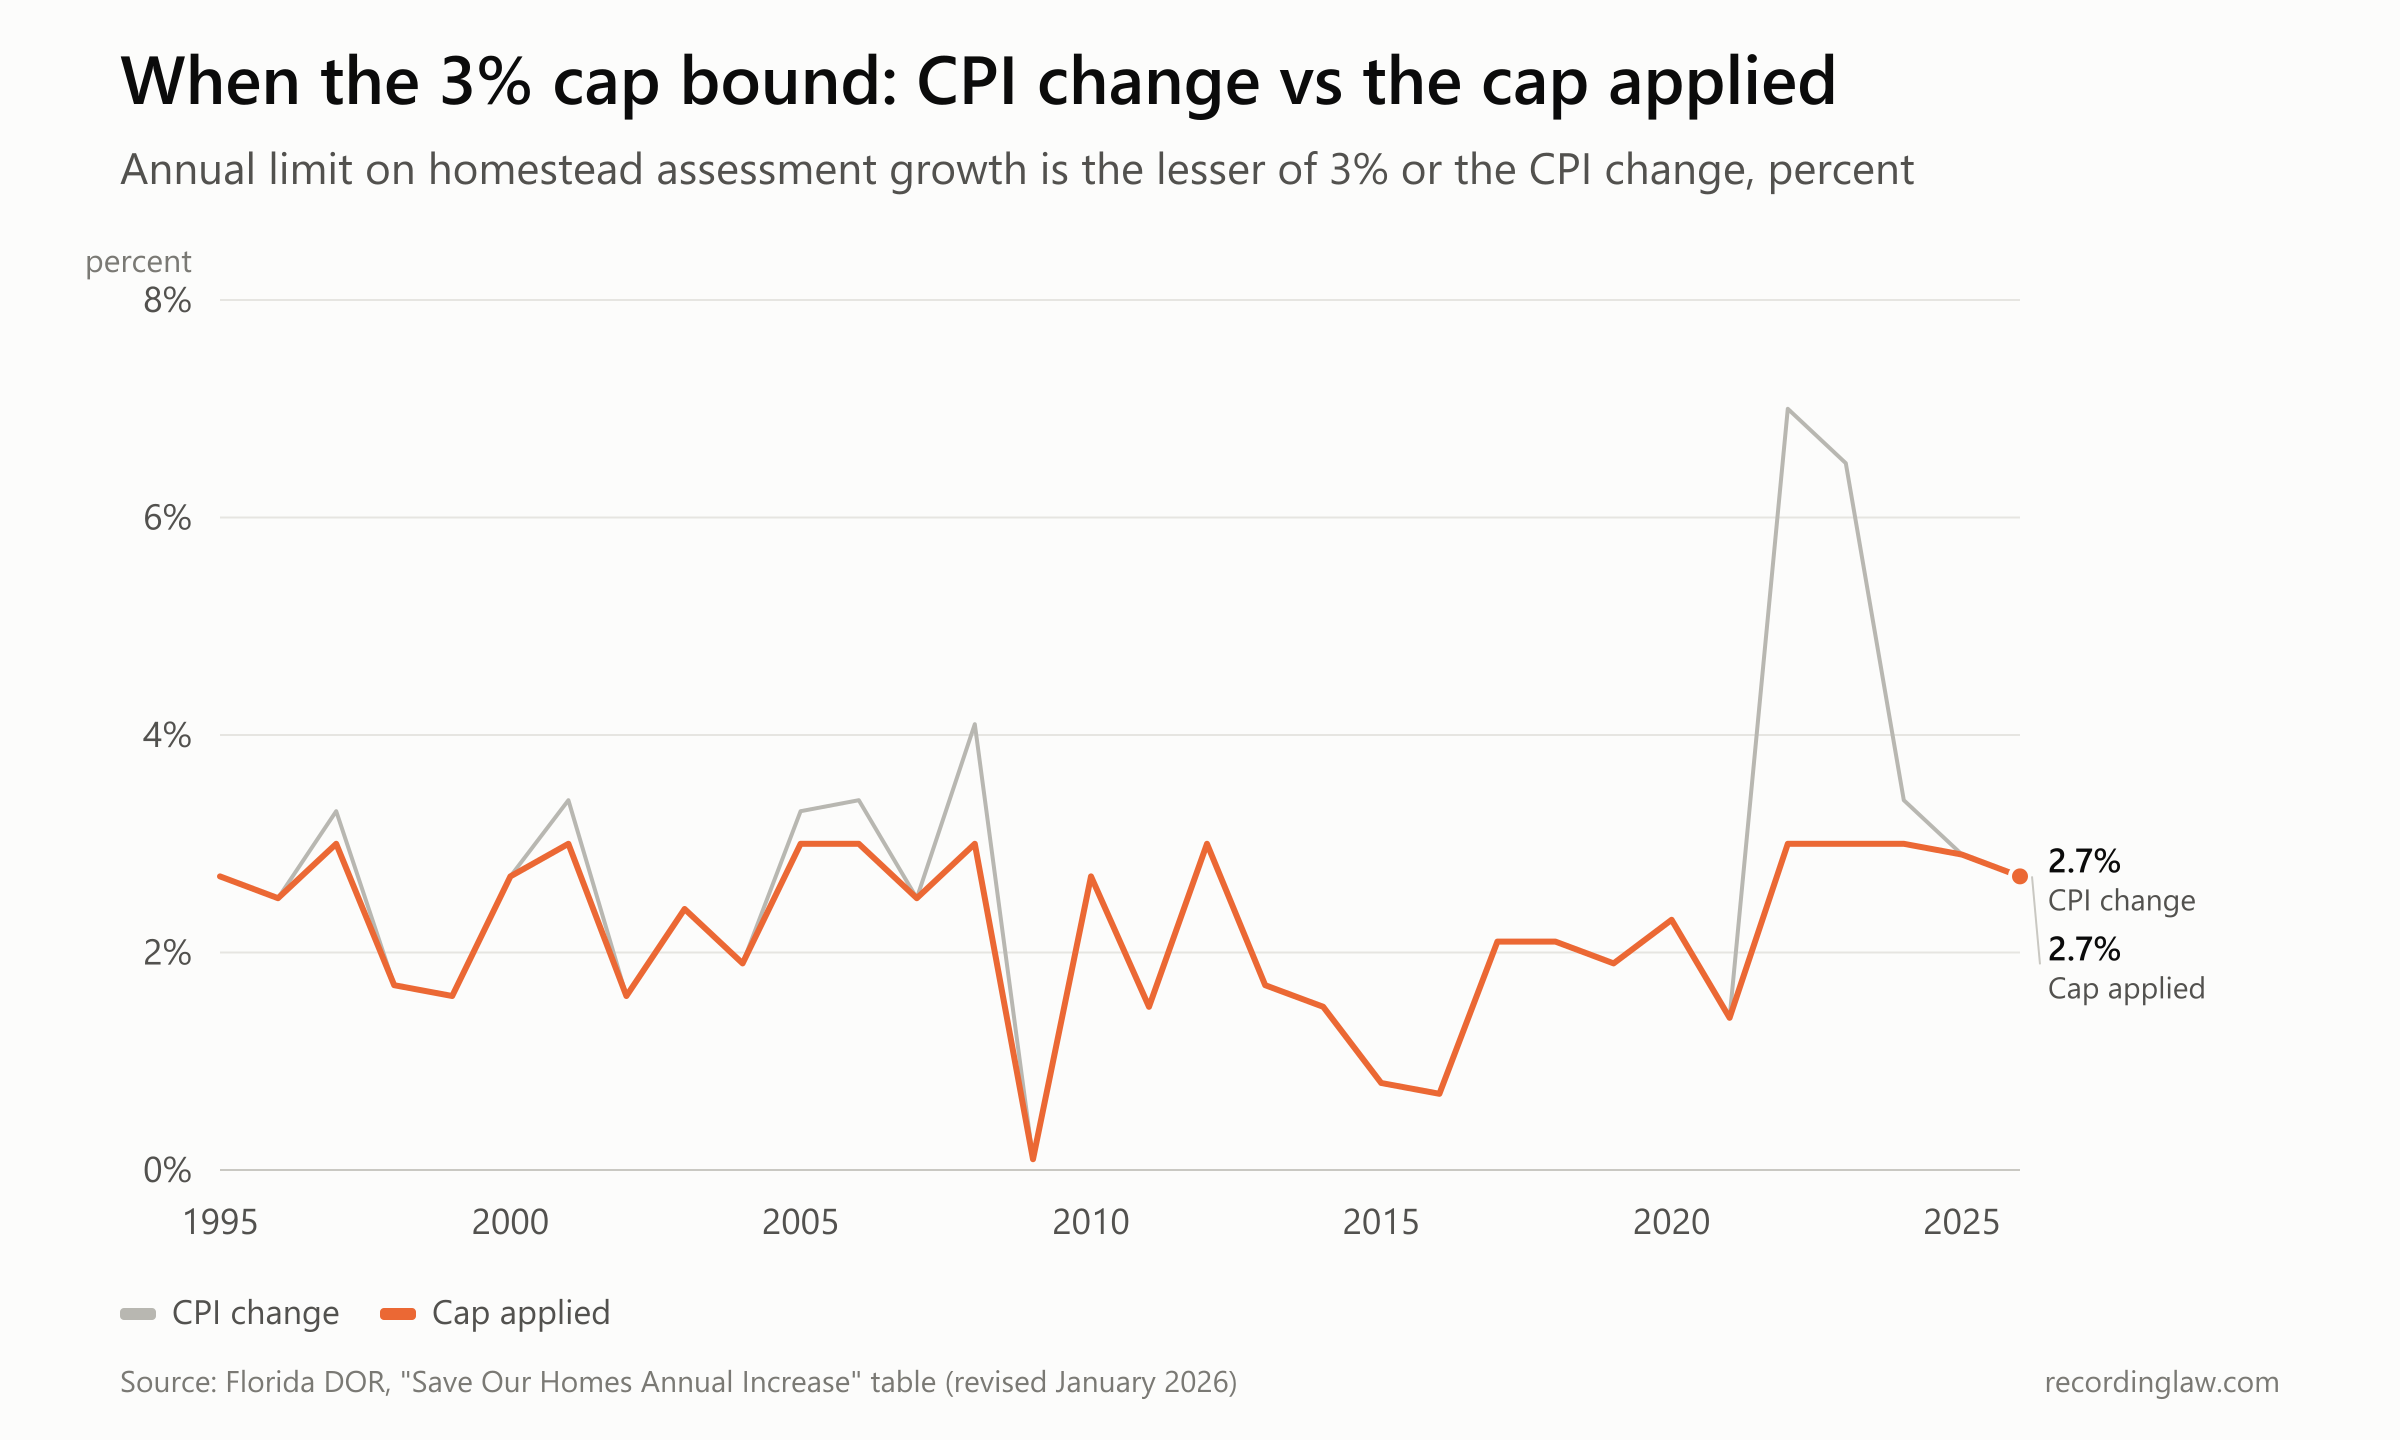
CPI change used for each assessment year vs the cap applied, 1995-2026. Source: Florida Department of Revenue, Save Our Homes annual increase table (revised January 2026).
| Assessment year | CPI change used | Cap applied |
|---|---|---|
| 1997 | 3.3% | 3.0% |
| 2001 | 3.4% | 3.0% |
| 2005 | 3.3% | 3.0% |
| 2006 | 3.4% | 3.0% |
| 2008 | 4.1% | 3.0% |
| 2009 | 0.1% | 0.1% |
| 2022 | 7.0% | 3.0% |
| 2023 | 6.5% | 3.0% |
| 2024 | 3.4% | 3.0% |
| 2026 | 2.7% | 2.7% |
The CPI change listed for each year is the change for the prior calendar year. In 2026 the cap applied is 2.7%.
Where the differential is largest
Measured against each county's just value for all property, the 2026 differential was highest in Indian River County at 19.97%, followed by Broward (19.35%) and Palm Beach (19.25%). In dollars, the largest differentials were in Miami-Dade ($134.30 billion), Palm Beach ($106.26 billion) and Broward ($97.80 billion).
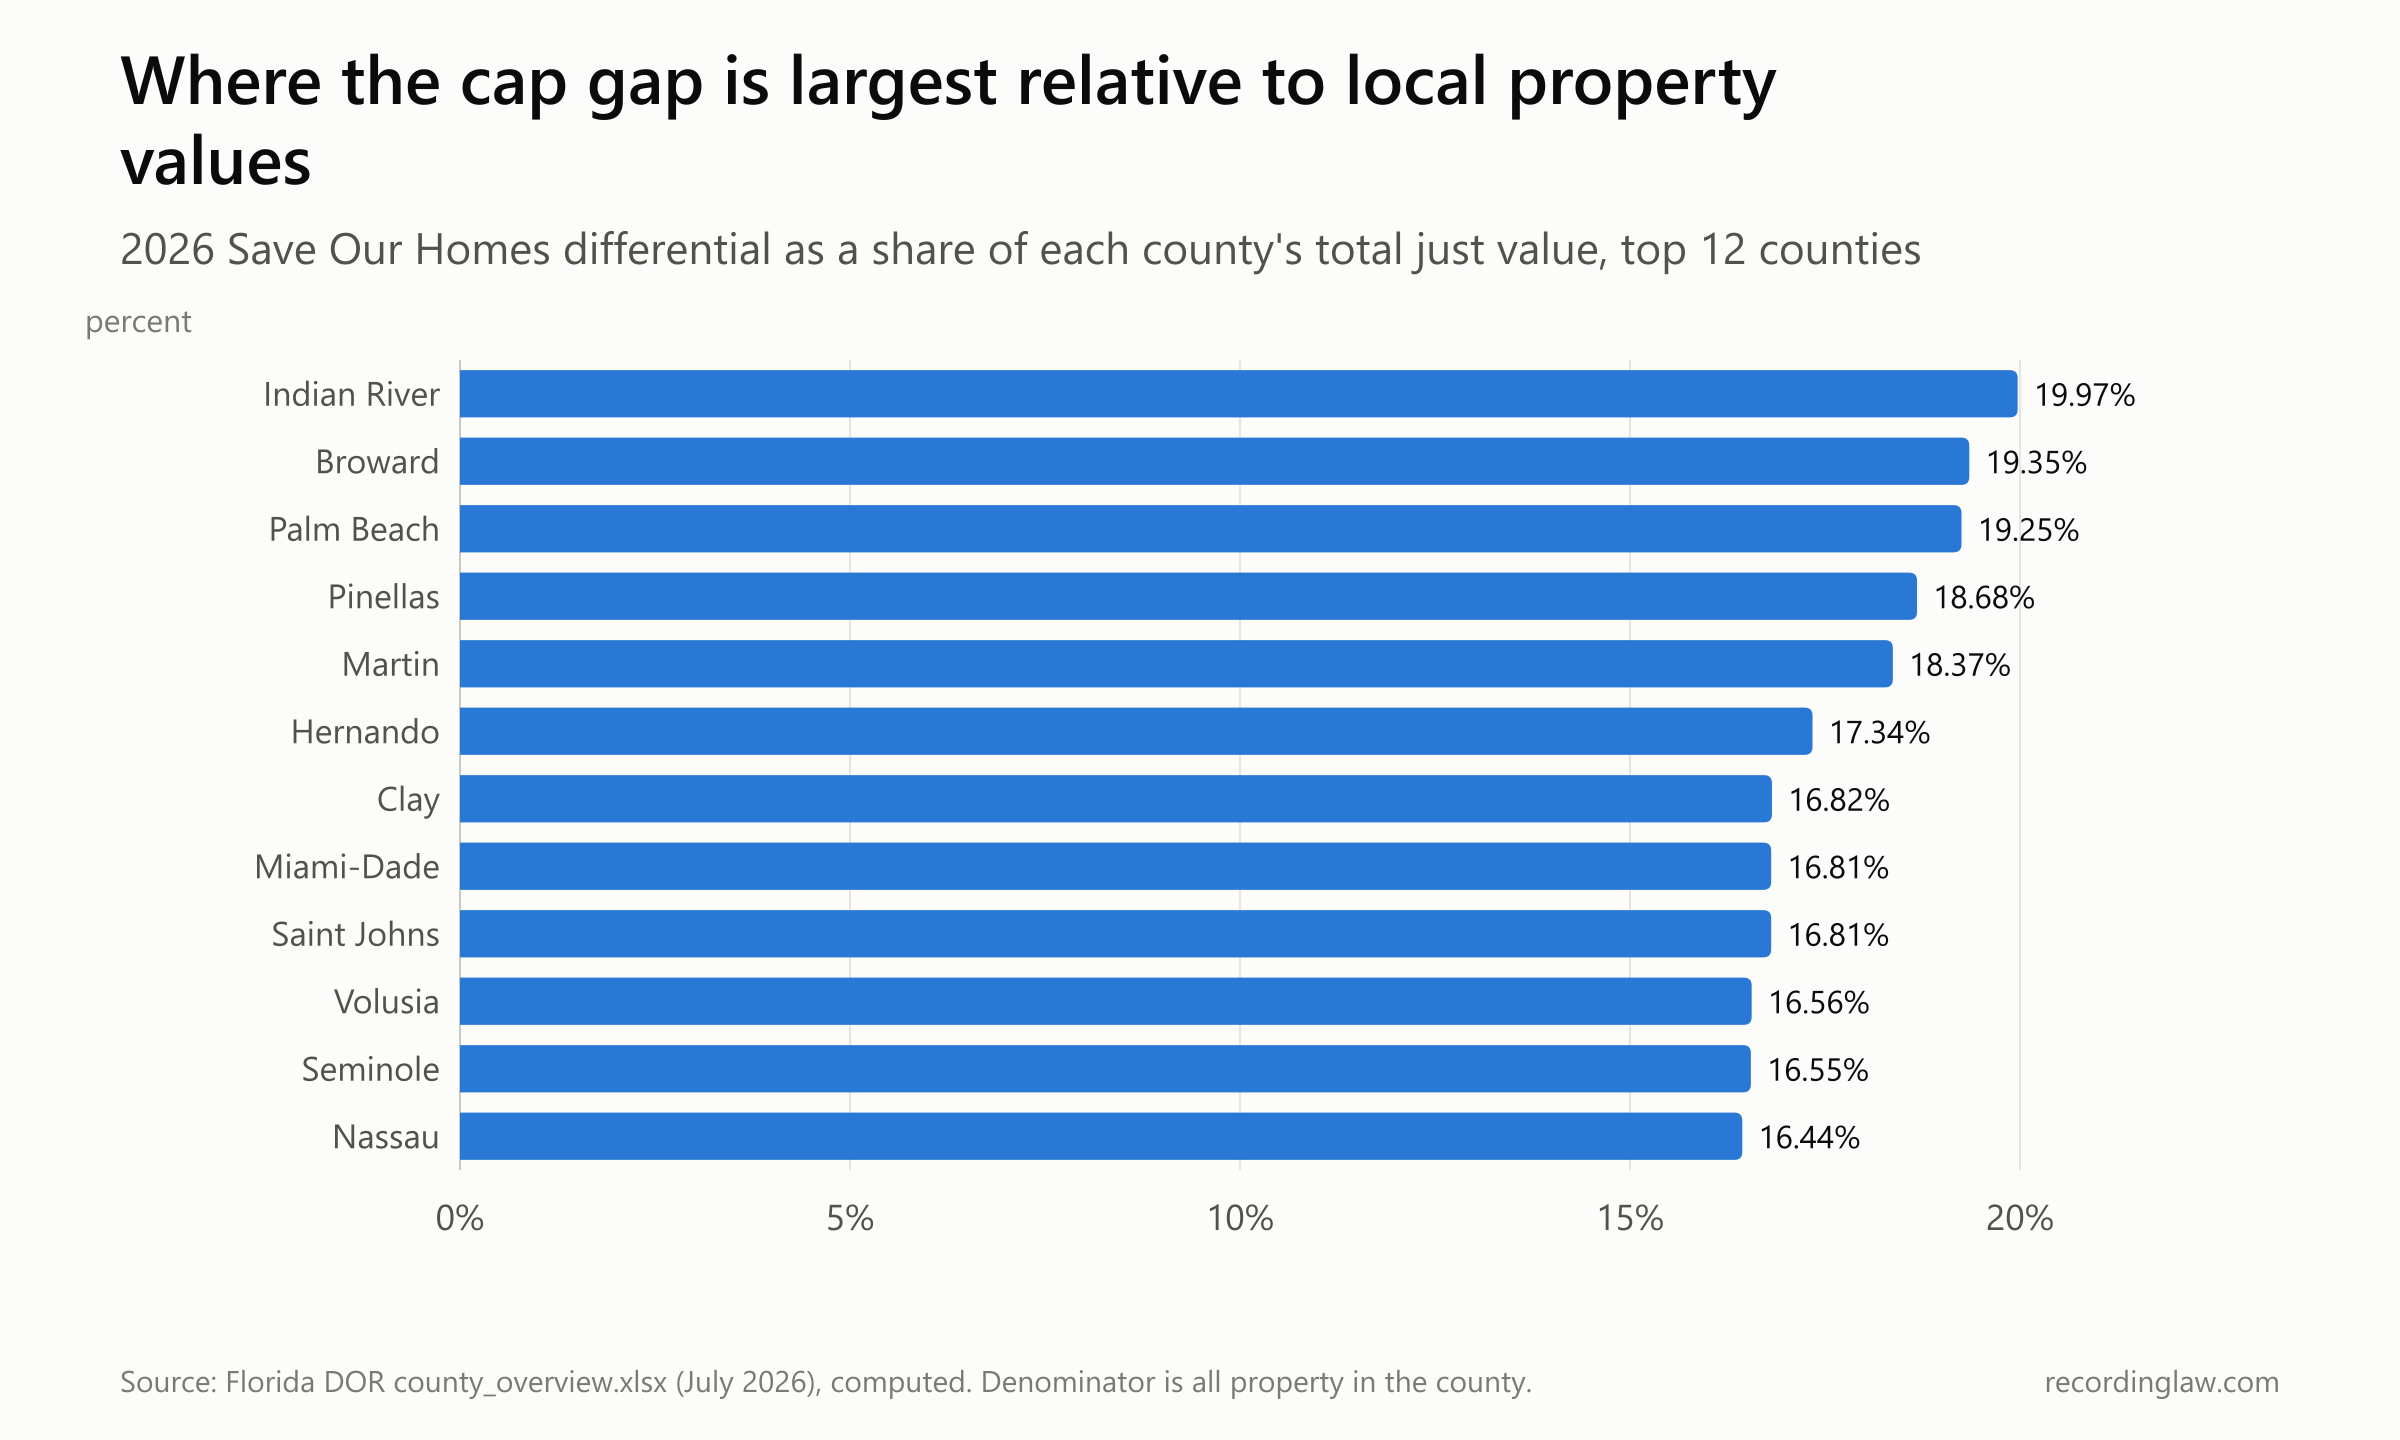
2026 Save Our Homes differential as a share of county just value (all property), top 12 counties. Source: Florida Department of Revenue, county_overview.xlsx; preliminary 2026 values.
| County | Differential as % of county just value | Differential |
|---|---|---|
| Indian River | 19.97% | $10.38B |
| Broward | 19.35% | $97.80B |
| Palm Beach | 19.25% | $106.26B |
| Pinellas | 18.68% | $41.35B |
| Martin | 18.37% | $11.62B |
| Hernando | 17.34% | $5.93B |
| Clay | 16.82% | $6.04B |
| Miami-Dade | 16.81% | $134.30B |
EDR's 2025 analysis measured the average reduction per homestead from Save Our Homes and portability together. By county it ranged from $16,725 in Union County to $579,499 in Monroe County. The four southernmost counties averaged $374,391, and the remaining counties averaged $118,749.
From market value to taxable value in 2026
The Save Our Homes differential is one of several steps between what Florida property is worth and what is taxed. The Department of Revenue's preliminary 2026 statewide totals:
| Step | Amount |
|---|---|
| Just value (all property) | $5.497 trillion |
| All assessment differentials and exceptions | minus $1,118.56 billion |
| of which: Save Our Homes differential | $815.14 billion |
| of which: 10% non-homestead cap differential | $196.59 billion |
| Assessed value | $4.379 trillion (79.7% of just value) |
| Exemptions | minus $705.99 billion |
| Taxable value | $3.673 trillion (83.9% of assessed value) |
The exemptions include $130.33 billion from the first $25,000 homestead exemption and $126.90 billion from the additional homestead exemption. Today that additional exemption applies only to non-school levies, to assessed value between $50,000 and $76,411 in 2026, so it is worth at most $26,411.
Non-homestead property, such as rental housing and commercial property, has its own cap. Its assessed value cannot rise more than 10% a year for non-school levies, and it is reassessed at just value after a change of ownership. That cap does not apply to school levies.
Homesteads made up about 47% of Florida's 11 million parcels in 2025, according to EDR, and 4.65 million homestead parcels benefited from Save Our Homes and portability. EDR found homesteads received 72.4% of all value removed by assessment differentials. The median homestead just value was $337,907.
What Amendment 3 would change
The Legislature passed the joint resolution, CS/HJR 1F, in its 2026 special session. Because it amends the Florida Constitution, it goes to voters on November 3, 2026, and needs 60% approval. Its ballot title is "INCREASED HOMESTEAD EXEMPTION; LOWER CAP ON INCREASES IN NON-HOMESTEAD PROPERTY ASSESSMENTS."
That title replaced the original. The enrolled resolution carried the title "SAVE OUR HOMES FROM EXCESSIVE PROPERTY TAXES." In early August 2026, a Leon County circuit court found the original ballot title and summary defective, and revised wording was filed in mid-August. The amendment stayed on the ballot.
According to the Revenue Estimating Conference's description of the resolution, if approved, starting January 1, 2027:
- Residents as of December 31, 2026: the second homestead exemption, which applies only to non-school taxes, becomes $150,000 in 2027 and $250,000 in 2028, then adjusts each year by CPI from 2029.
- People who were not Florida residents on December 31, 2026: the second exemption becomes $50,000 in 2027, adjusted by CPI from 2028, for four years. In the fifth year they receive the larger adjusted exemption. Beginning in 2030, a county or city can shorten the wait by a two-thirds vote of its governing body if it determines a shorter wait is "warranted for a critical local need." The ballot summary says the residency rule applies "to the extent permitted by the U.S. Constitution."
- First $25,000 exemption: applies only to school taxes.
- Non-homestead cap: the annual limit on non-school assessed value growth for non-homestead, non-agricultural parcels falls from 10% to 5%.
- Full exemption path: the Legislature must set a uniform procedure for counties and cities to raise the exemption until homesteads are fully exempt from county and municipal levies. No timeline is set. Special districts may raise it by voter referendum.
- Spending: limits the categories on which counties and municipalities can spend property tax revenue.
The resolution changes the non-homestead caps in Article VII, section 4(g) and (h), and leaves section 4(d), the Save Our Homes limit, unchanged; its other changes are to exemptions and spending.
The official revenue estimate
The Revenue Estimating Conference adopted its estimate on July 10, 2026. Its formal impact is "zero/negative indeterminate" because a joint resolution has no effect unless voters approve it. It also adopted figures for what happens if the amendment is approved, because the exemption and the new non-homestead cap would take effect without further legislation.
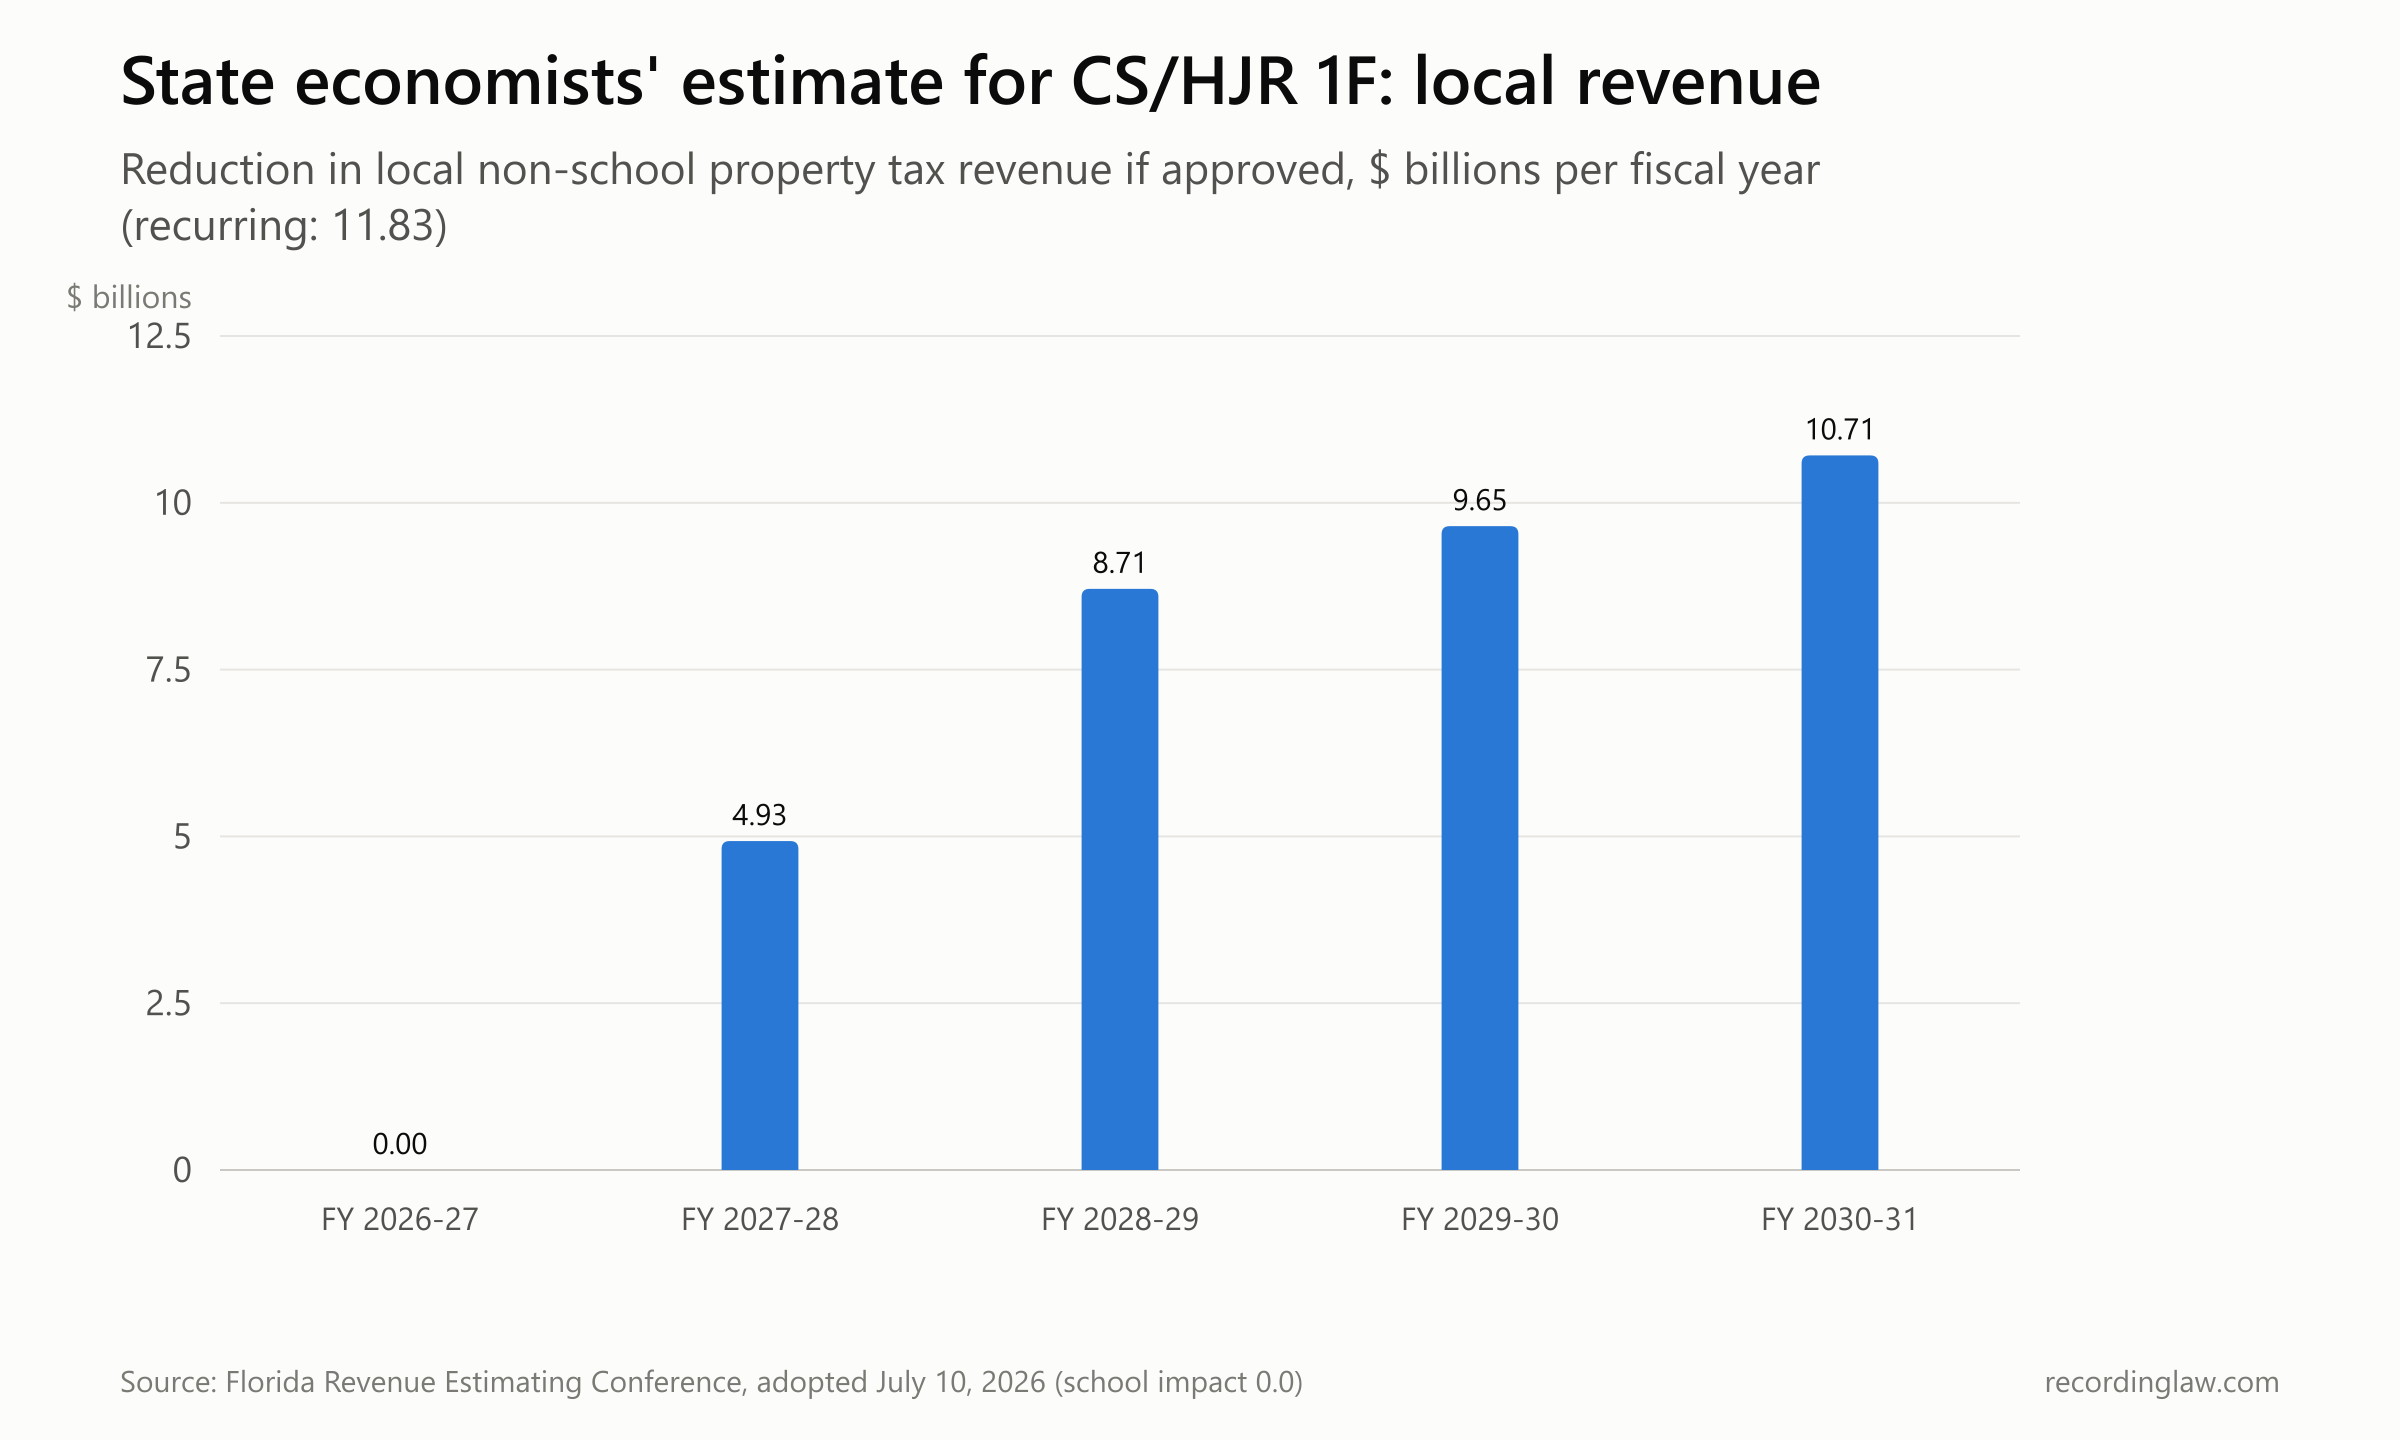
Estimated reduction in local non-school property tax revenue if CS/HJR 1F is approved, $ billions. Source: Revenue Estimating Conference, consensus estimate adopted July 10, 2026.
| Fiscal year | Estimated reduction, local non-school revenue |
|---|---|
| 2026-27 | $0 |
| 2027-28 | $4.93 billion |
| 2028-29 | $8.71 billion |
| 2029-30 | $9.65 billion |
| 2030-31 | $10.71 billion |
| Recurring (sixth year) | $11.83 billion |
The conference computed the figure by multiplying the drop in non-school taxable value by current non-school tax rates, so it measures both lower local non-school revenue and lower non-school taxes paid by property owners, before any change in local tax rates.
The estimate for school revenue is zero, since the new exemption applies only to non-school levies. The conference listed the effect of the Legislature later prescribing a full exemption as unknown, and the effect of local votes to raise the exemption as zero.
An earlier June 12 version of the analysis put the recurring figure at $11.86 billion. The adopted July analysis notes its method "may undershoot the true impact on homestead parcels unless implementing language updates section 196.031." For new arrivals, it starts from 880,354 people who moved to Florida in 2024 (American Community Survey data). That count is reduced to 40% to convert individuals to households (an average of 2.5 people each), and half of those households are assumed to eventually obtain a homestead.
How we measured
Assessment data. Statewide and county Save Our Homes differentials, just value and county taxable value come from the Florida Department of Revenue's county overview workbook (sheets "Save Our Homes Value History," "Just Value History" and "County Taxable Value History"), retrieved October 26, 2026. The 2026 waterfall comes from the department's 2026 just, assessed and taxable value table. 2026 values are the July 2026 extract and are preliminary; the department may revise them.
Shares. The differential percentages are our calculation: the Save Our Homes differential divided by the just value of all property, statewide or by county. The denominator includes non-homestead property, so the share of homestead value removed is much larger than these percentages. EDR's 2025 figure of 37.6% uses homestead value only and includes portability.
Series breaks. Earlier years are as stored in the current workbook and may differ slightly from older department releases. There is no published history for the 10% non-homestead cap differential in the files we used.
Cap history. Annual caps and CPI changes come from the department's Save Our Homes annual increase table, revised January 2026.
Amendment and estimate. Provisions come from the Revenue Estimating Conference analysis and the House final bill analysis of CS/HJR 1F. Revenue figures are the conference's July 10, 2026 adopted estimate. The ballot title and number are from the Division of Elections listing; the original title is from the enrolled resolution.
What the data cannot show. These are aggregate figures. They do not show how much tax any individual household pays or would pay, and they do not establish why the statewide differential fell after 2024. They also do not measure effects on home prices, moving decisions or rents, and this page does not model how local governments might respond to lower revenue through tax rates, other revenue or spending. Parcel-level records were not analyzed. Readers can look up their own parcel's just and assessed values through Florida property records.
For homestead rules in other states, see homestead exemption by state.
Frequently Asked Questions
What is the Save Our Homes differential?
It is the difference between the just (market) value and the assessed value of homestead property that results from the Save Our Homes cap. The Florida Department of Revenue reported it at $815.14 billion statewide in its preliminary 2026 figures.
How much can a Florida homestead's assessed value rise each year?
No more than the lower of 3% or the prior year's change in the Consumer Price Index. For 2026 the cap applied is 2.7%.
When is the vote on Amendment 3 and how much support does it need?
The vote is on November 3, 2026. As a constitutional amendment, it needs approval from 60% of voters.
Would Amendment 3 end Save Our Homes?
No. The resolution leaves the Save Our Homes limit in Article VII, section 4(d), unchanged. It adds a larger non-school homestead exemption, lowers the non-homestead cap from 10% to 5% for non-school levies, and limits how counties and cities can spend property tax revenue.
What is the official revenue estimate?
The Revenue Estimating Conference estimated local non-school revenue would fall by $4.93 billion in fiscal 2027-28 and by $11.83 billion a year on a recurring basis, if the amendment is approved. It estimated no impact on school revenue.
What exemption would new Florida residents get?
People who were not Florida residents on December 31, 2026 would receive a $50,000 non-school exemption in 2027, adjusted for inflation afterward, for four years, and the larger exemption in the fifth year. Beginning in 2030, counties and cities could shorten that wait by a two-thirds vote.
Are the 2026 figures final?
No. The 2026 values are the Department of Revenue's July 2026 extract and are preliminary.
Updates
Independently fact-checked against the cited primary sources
Sources and References
- Florida Department of Revenue, County Overview workbook (Save Our Homes, just value and taxable value history)(floridarevenue.com).gov
- Florida Department of Revenue, 2026 Just, Assessed and Taxable Value (preliminary)(floridarevenue.com).gov
- Florida Department of Revenue, Save Our Homes Annual Increase table (revised January 2026)(floridarevenue.com).gov
- Florida Revenue Estimating Conference, CS/HJR 1F impact analysis, consensus estimate adopted July 10, 2026(edr.state.fl.us).gov
- Florida Revenue Estimating Conference, CS/HJR 1F impact analysis, June 12, 2026 version(edr.state.fl.us).gov
- Florida Office of Economic and Demographic Research, Property Tax: Homestead Distribution and Benefits (2025 data)(edr.state.fl.us).gov
- Florida House of Representatives, Final Bill Analysis of CS/HJR 1F (2026F)(flsenate.gov).gov
- Enrolled CS/HJR 1F (2026F), original ballot title(flsenate.gov).gov
- Florida Division of Elections, Constitutional Amendment 3 (2026 General Election): ballot title and summary(constitutionalinitiatives.dos.fl.gov).gov