In Utah, the Only 0.05 State, the Road Death Rate Fell 14% and the Alcohol-Crash Death Rate Rose 17% From 2016 to 2024

Independently fact-checked against primary sources (last audited November 10, 2026). · 16 primary sources cited on this page. How we verify our legal content
Utah's lower drunk-driving limit took effect on Dec. 30, 2018, and the date was chosen with care. "It will be the day before New Year's Day weekend, one of the busiest drunk driving weekends of the year," Rep. Norm Thurston, the Provo Republican who sponsored the bill, told a House committee in February 2017, as transcribed in a later federal evaluation.
In the first 24 hours under the new limit, the Utah Highway Patrol made eight DUI arrests, two fewer than on the same day a year earlier. "We arrested eight individuals for driving while impaired during those 24 hours," Col. Michael Rapich, the patrol's head, said. Every one of them, KSL reported, had a blood alcohol concentration of .08 or higher, the old limit.
Nearly eight years later, Utah is still the only state where driving at a blood alcohol concentration (BAC) of 0.05 is by itself a crime, a threshold known as the per se limit. The other 49 states and the District of Columbia set the line at 0.08, according to the Insurance Institute for Highway Safety. When Thurston was asked in 2017 why Utah should go first, he predicted it would not be first at all.
This story follows a measure it calls the alcohol-crash death rate. It counts deaths in Utah crashes involving a driver at 0.05 or above, for every 100 million miles driven. The federal crash census does not have a measured BAC for every driver, so the National Highway Traffic Safety Administration fills the gaps with statistical estimates, and the deaths are estimates too.
The law's first full year looked like its sponsors' case. In 2019, by our calculation from those federal crash estimates, the alcohol-crash death rate fell to its lowest point of any year from 2010 to 2024.
Then the rate turned upward. From 2020 through 2024 it ran above its level in 2016, the last full year before the law was signed. So what did Utah get for going first, what happened to the costs its opponents predicted, and why has no other state followed?
The rise after 2019 was not Utah's alone. The same rate ran above its 2016 level in every year from 2020 to 2024 in the rest of the country, and in Utah's six neighbors: Arizona, Colorado, Idaho, Nevada, New Mexico and Wyoming. How far did each line move?
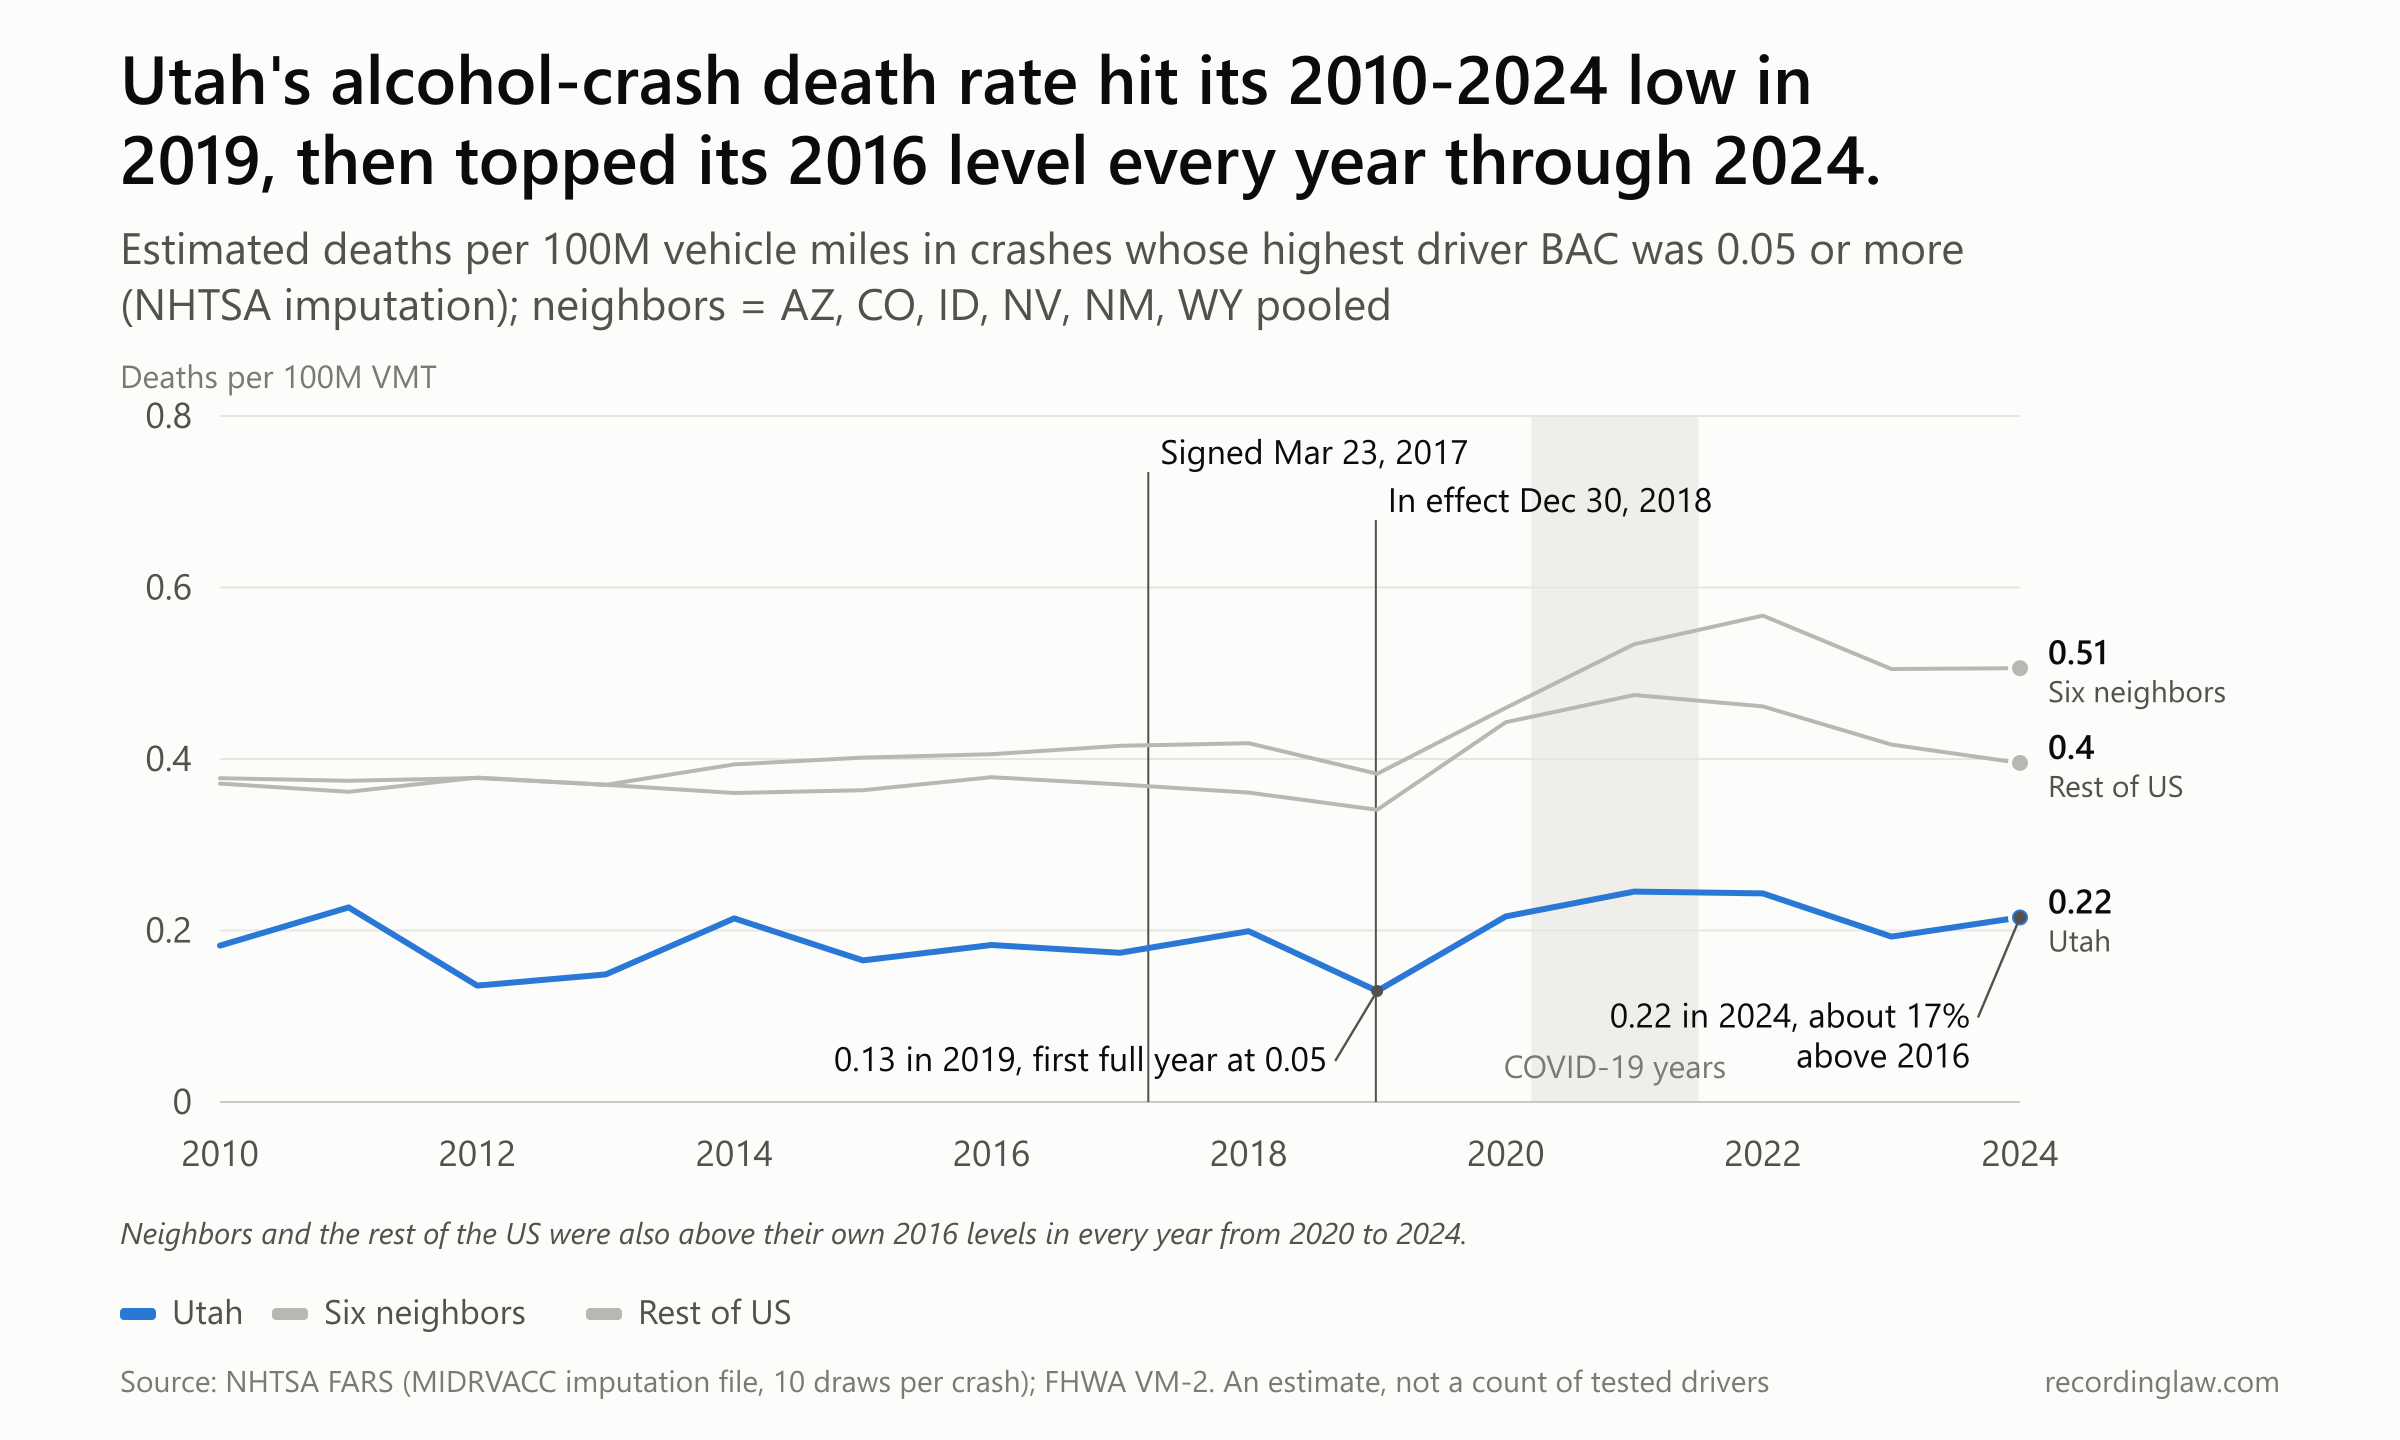
Estimated deaths per 100M VMT in crashes with a driver at 0.05+ BAC (NHTSA imputation), 2010-2024. Source: NHTSA FARS; rates are our own calculation using FHWA VM-2 mileage.
| Year | Utah | Six neighbors | Rest of US |
|---|---|---|---|
| 2016 | 0.1832 | 0.4057 | 0.3788 |
| 2019 | 0.1294 | 0.3828 | 0.3407 |
| 2020 | 0.2165 | 0.4596 | 0.4429 |
| 2021 | 0.2453 | 0.5338 | 0.4746 |
| 2022 | 0.2432 | 0.5672 | 0.4614 |
| 2023 | 0.1929 | 0.5050 | 0.4169 |
| 2024 | 0.2152 | 0.5059 | 0.3954 |
In our calculation, Utah's rate in 2016 was 0.18 deaths per 100 million miles, and it was above that level in every year from 2020 to 2024. By 2024 it was 0.22, about 17% above 2016. The six neighbors were about 25% above their 2016 level, and the rest of the country about 4% above. In estimated deaths, Utah's figure is about 78 in 2024 against about 58 in 2016.
A federal evaluation found that Utah's overall road death rate, which counts deaths in every crash, had fallen about three times as fast as the rest of the country's from 2016 to 2019, 18.3% against 5.9%. The studies that added later years differ. One, by Li and colleagues, found a similar pattern of reductions in Utah relative to its neighbors but could not rule out chance.
A 2026 study from the Insurance Institute for Highway Safety measured crashes rather than deaths. It linked the law to a lasting drop in alcohol-related crashes. With the pandemic months left out, its estimate was larger, but with less data it was not statistically significant.
The argument over those numbers started years before the law existed, with a federal recommendation no state had taken up.
Why would a state go first?
The idea came from a federal agency. On May 14, 2013, the National Transportation Safety Board, the independent federal agency that investigates crashes, recommended that every state set a per se limit of 0.05 or lower. The Associated Press noted that the board acted "on the 25th anniversary of one of the nation’s deadliest drunken driving accidents in Carrollton, Ky." Mothers Against Drunk Driving (MADD), AAA and the National Highway Traffic Safety Administration (NHTSA), the federal highway safety agency, declined to endorse it that day.
"Alcohol-impaired deaths are not accidents, they are crimes," NTSB Chairman Deborah Hersman said. "They can and should be prevented. The tools exist. What is needed is the will."
No state acted on it for more than three years. On Dec. 30, 2016, two years to the day before his law would take effect, Thurston announced by press release that he would sponsor a bill to lower Utah's limit. He did it at the NTSB's request, NPR later reported.
In a Senate committee on March 1, 2017, Sen. Jim Dabakis, a Salt Lake City Democrat, asked the question the rest of the debate turned on. He asked whether going first would "reinforce a very, very, very harmful perception that cost us millions, perhaps billions of dollars in both economic growth as well as in tourism," a perception he tied to Utah's older liquor rules, such as private clubs and the Zion curtain, a barrier that shielded restaurant diners from liquor being poured. Then he asked: "Why be the first? Why not just let another State or two to move ahead?"
Thurston answered with a forecast. "I fully anticipate that by the time this bill actually goes into effect, we won’t be first," he said, as NHTSA's evaluation transcribed it. "Hawaii is actively considering it; they will probably beat us to the punch. Washington is actively pursuing it; they will beat us to the punch."
Supporters put the promise in lives. Sen. Stuart Adams, a Layton Republican and the Senate majority whip, carried the bill in the Senate and suggested it "could save as many as 63 lives in Utah each year," KSL reported. "This is not a drinking bill. It's a driving bill. It's a public safety bill," he said.
Senate President Wayne Niederhauser said he believed other states would follow Utah's lead. "You'll be safer here because people are thinking twice about drinking and driving," he said.
The federal crash census is NHTSA's Fatality Analysis Reporting System (FARS), and its BAC gaps are filled with the statistical estimates described at the top. By those estimates, about 58 people died in Utah in 2016 in crashes involving a driver at 0.05 or above, and about 64 in 2018. The "as many as 63 lives" a year Adams cited was more than that whole total in 2016 and about equal to it in 2018. The record does not show how Adams arrived at 63 or which measure he had in mind.
The people who had studied the question were more guarded. In the same Senate committee, Dabakis asked NTSB Vice Chairman T. Bella Dinh-Zaar how confident she was in the 11% figure the board had projected. She had told the House committee in February that a 0.05 limit nationwide would mean "an 11% decrease in fatal crashes or 1,800 lives saved."
She said the research was done by Jim Fell, "one of the leading researchers in this type of research." She called the 11% "a conservative measure."
Then she added: "We do not really know. I mean that is a projection. It's a hope; it's never been done in the United States. So, it is an estimate based on other countries where it has been done."
The state's own justice officials leaned in. The executive director of the Utah Commission on Criminal and Juvenile Justice told senators the office usually did not back "tough on crime" bills, but "supports this bill because we are convinced by the evidence that it actually will prevent harmful behavior and actually will reduce deaths caused by driving while under the influence." The Highway Patrol's superintendent said, "I absolutely hope this will reduce the number of DUI arrests and reduce the number of DUI-related traffic fatalities or deaths that we investigate."
The House passed the bill 48-26 on Feb. 23, 2017. The Senate passed it 17-12 on March 8, the second-to-last day of the session.
Gov. Gary Herbert signed the bill, HB 155, on March 23, 2017, saying he believed "that this new policy will, in fact, save lives." He also said he would sign "with some caveats. I don't believe, for example, that the legislation is finished." On tourism, he said "there's no evidence that it should impact, negatively, our tourism travel," and the state tourism office told the AP it was not concerned, noting that France, Australia and Italy have similar laws.
Some business leaders backed the bill. Lane Beattie, president of the Salt Lake Chamber, predicted that "in just a few years, it will be the standard across the country." The businesses that sell drinks had already organized against it.
What the opponents said it would cost
On March 17, 2017, several dozen people stood in the Capitol rotunda holding signs that read "Don’t Hurt Utah Business" and "One Step Forward, .05 Steps BAC," KUER reported. "Our main objection is it really does nothing to serve the public good, and it's just a huge black eye to the state of Utah," said Doug Hofeling, chief operating officer of Salt Lake Brewing Company, which runs the Squatters and Wasatch breweries.
Four days later, the Utah Restaurant Association and the Salt Lake Area Restaurant Association met Herbert separately to ask for a veto. "We don’t want to be first because it creates the image that we are going to be harder on those people who may consume alcohol. It’s not a crime to consume alcohol," said Melva Sine, the state association's executive director. After Herbert announced he would sign, Michele Corigliano, who ran the Salt Lake group, predicted the limit would put independent restaurant owners out of business, KSL reported, because their margins were already slim and people would stay home to have a drink with dinner.
The loudest campaign came from outside the state. The American Beverage Institute (ABI), a Washington, D.C., group that the AP described as a national restaurant group and FOX 13 as "a restaurant and liquor industry lobbying group," took out full-page ads in both Salt Lake City dailies and USA Today on the day Herbert signed. Under a fake mugshot, the headline read: "Utah: Come for vacation, leave on probation." ABI managing director Sarah Longwell called the law "a total attack on the state’s hospitality industry, customers and the tourism industry."
Over the following months ABI ran the vacation ad, or ones like it, in newspapers in Colorado and Idaho, and planned a full-page version for the Las Vegas Review-Journal. When the Idaho ad ran in April, Herbert's communications director, Paul Edwards, said "interests in local states" would try "to misrepresent our evidence-based efforts to improve public safety." That summer ABI ran a new ad picturing 11 Utah lawmakers over 65 under the headline "Too Impaired to Drive?"
ABI's factual case was about where drunk-driving deaths happen. "Only around 1 percent of traffic fatalities involve drivers with BACs between .05 and .08," Longwell wrote to a legislative committee in June 2017. "The vast majority of alcohol-related fatalities happen at very high BAC levels. In Utah, 77 percent of alcohol-related fatalities occur at .15 or above." The letter asked the committee to recommend full repeal.
The Libertas Institute had made a similar argument in the House committee, as NHTSA summarized it: "We should focus on these offenders and give them serious penalties instead of unnecessarily criminalizing people who are not driving recklessly." ABI's representative in the Senate committee went after the researcher behind the NTSB figure. "I debate Jim Fell all the time. This guy is an anti-alcohol activist," the representative said, according to NHTSA's transcript.
At the same June 2017 committee meeting, Kaitlin Eskelson of the Utah Tourism Industry Association said room tax revenues were down slightly from a year earlier, FOX 13 reported, and that surveys put the bad national press at about $2 million worth. Adams told the same committee he thought the law was already working before it took effect. "I think there has been a chilling effect. I think people are reticent to get behind the wheel. I think they’re still drinking at restaurants and bars," he said.
Opponents expected changes before the law took effect. Bar operators and hospitality representatives said they had been promised a special session of the legislature to make changes, FOX 13 reported, "and nothing happened."
In February 2018 Herbert said he saw no chance lawmakers would repeal or delay the law, and no move toward a two-tier penalty, with a lower tier of penalties for drivers between .05 and .08. "We’re not saying people can’t drink. You can certainly access a drink, and you can drink until your eyes bug out if you want. We’re just saying don’t drive and drink," he said, as quoted by The Salt Lake Tribune.
Two weeks later a House committee rejected a bill from Rep. Karen Kwan, a Murray Democrat, to delay the law. "We need to do this right. Not fast," she said.
A Salt Lake Tribune-Hinckley Institute of Politics poll in early 2018 found 53% of voters supported the law. It took effect on Dec. 30, 2018, as written. (Its current penalties are summarized on our Utah DUI laws page, and every other state's 0.08 rules on our DUI laws by state hub.)
The first year at 0.05
By NHTSA's account, Utah did little to advertise the change. Its evaluation found no "large-scale media activities related to the passage of the .05 BAC law," and the Department of Public Safety's video about it was titled Business as Usual.
In January 2019, the first full month, Utah made 844 DUI arrests, the Department of Public Safety told FOX 13. Thirty-eight of them were for a BAC between .05 and .079. In only four of those was that BAC the only issue. Most of the rest were drivers under 21 or drivers with a prior DUI, for whom that band was already illegal.
The bigger test was the death count. In 2019 Utah recorded 248 traffic deaths, down from 281 in 2016, while its drivers covered about 5% more miles. Did the rate per mile driven fall faster in Utah than elsewhere?
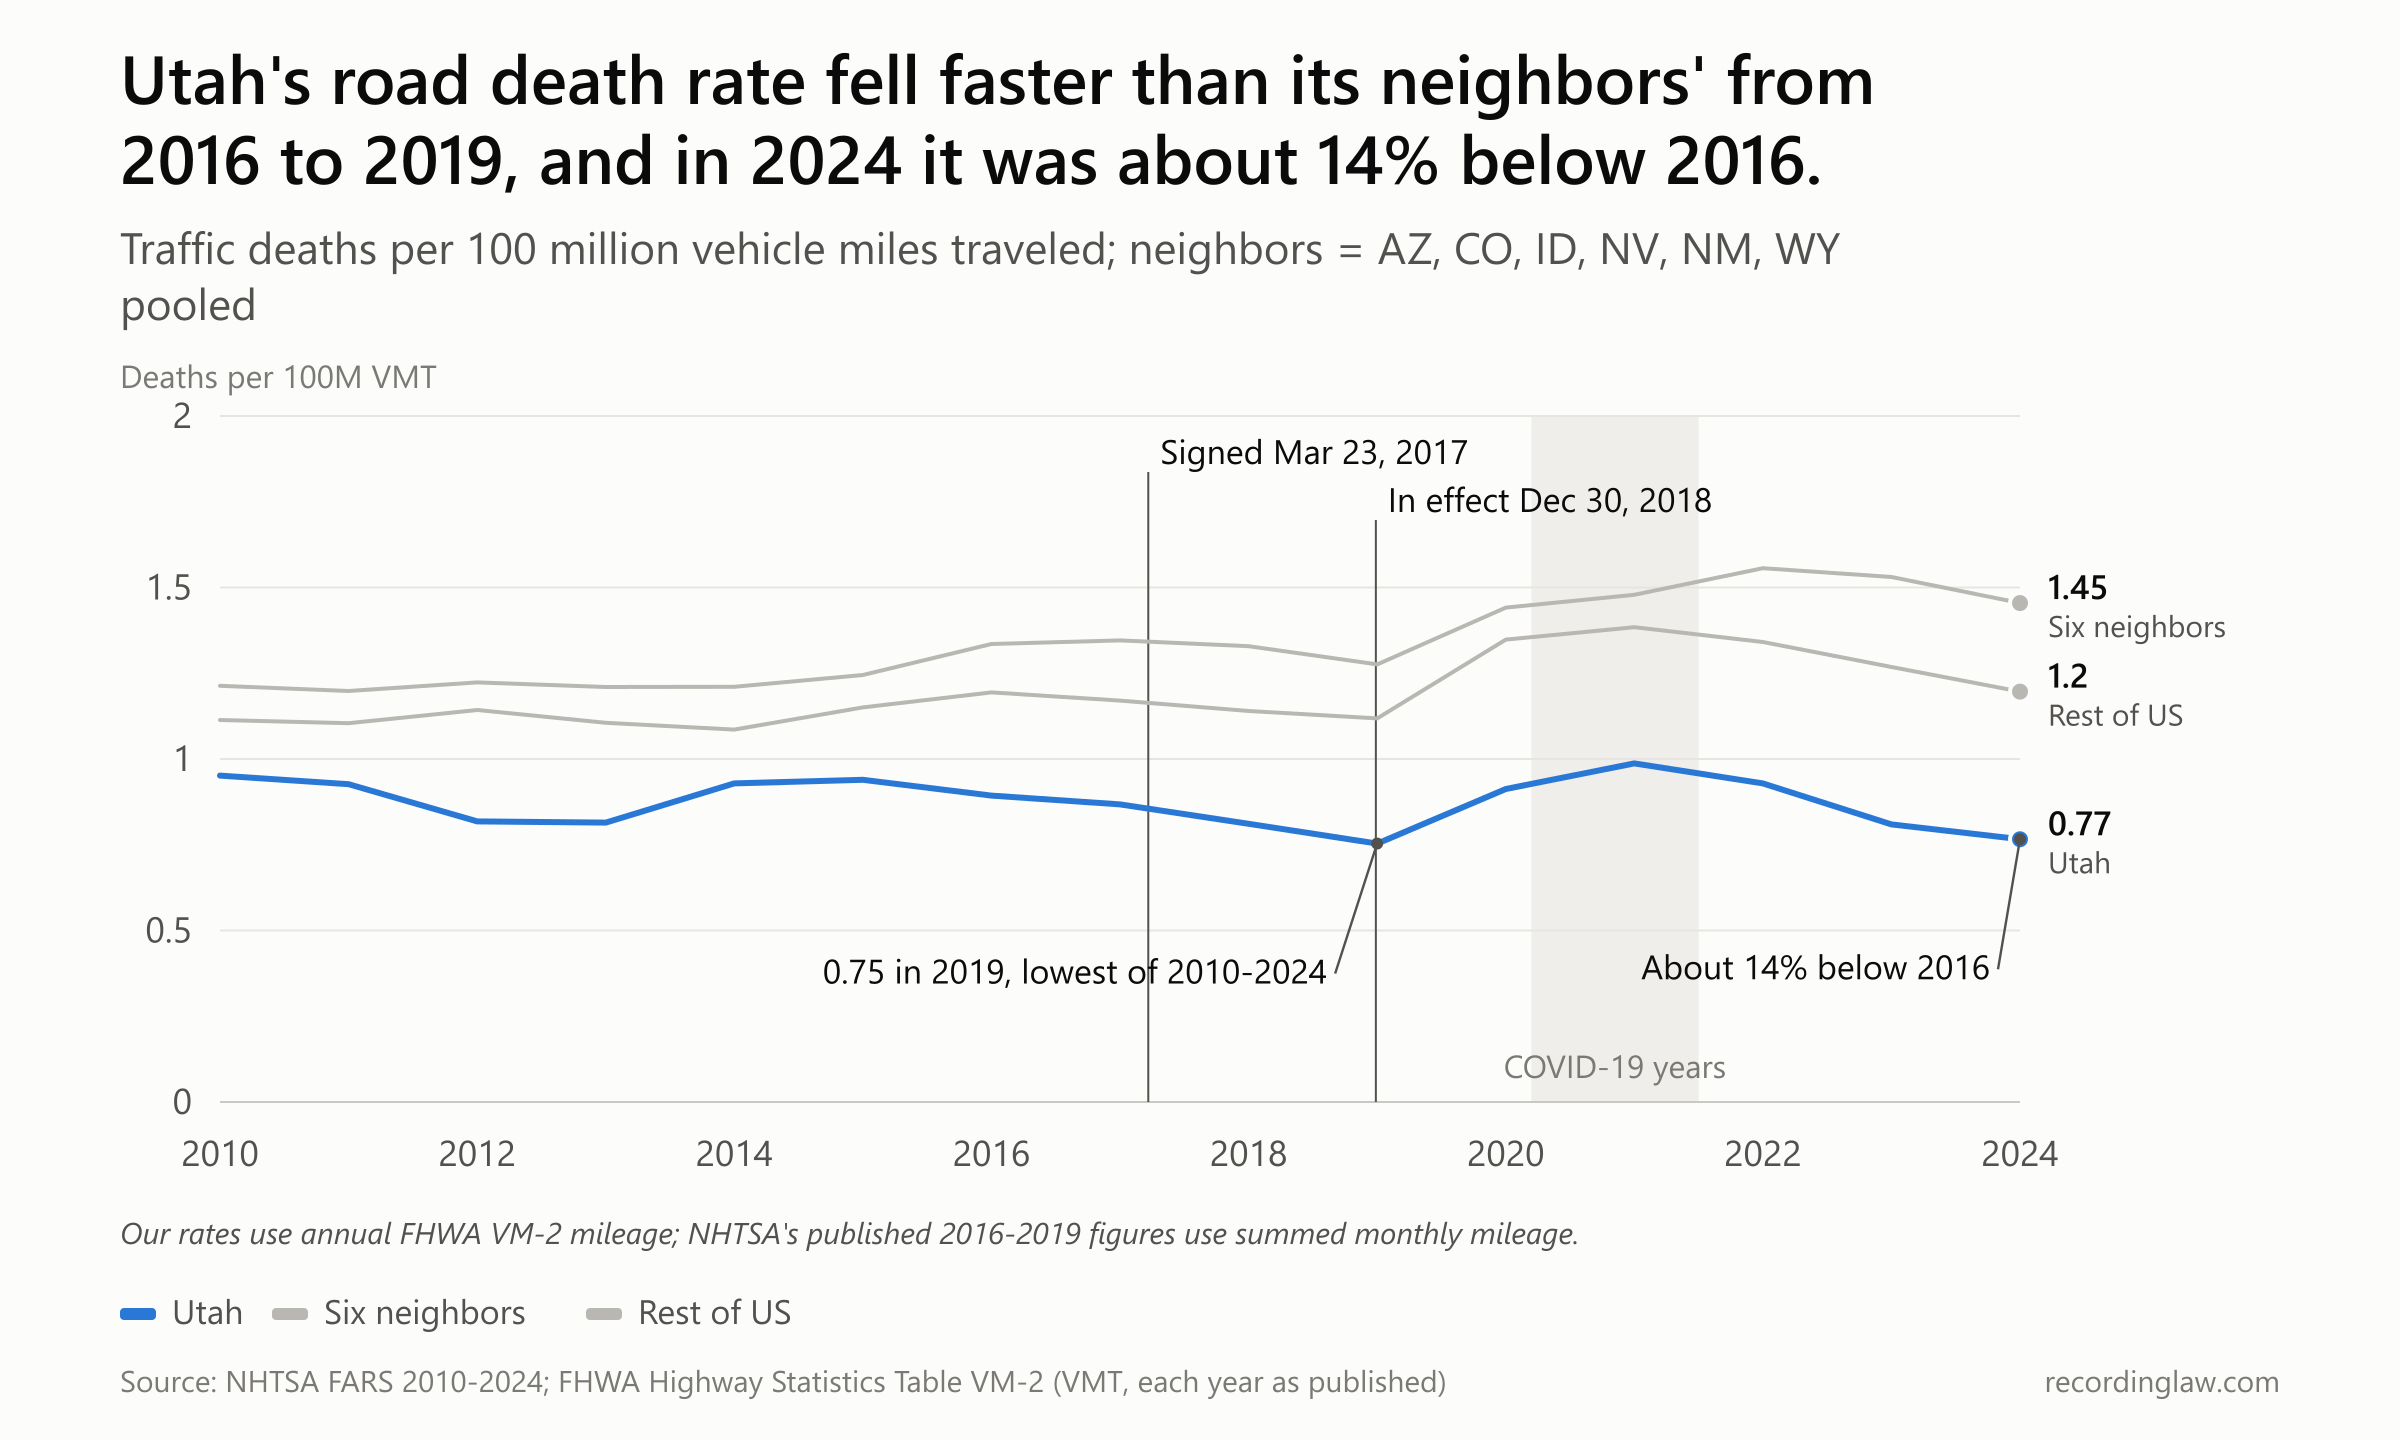
Traffic deaths per 100 million vehicle miles traveled (VMT), Utah vs six neighboring states vs rest of US, 2010-2024. Source: NHTSA FARS; rates are our own calculation using the Federal Highway Administration's annual VM-2 mileage table, which differs from the summed-monthly Traffic Volume Trends mileage NHTSA used for its -18.3% figure.
| Year | Utah | Six neighbors | Rest of US |
|---|---|---|---|
| 2016 | 0.8935 | 1.3353 | 1.1942 |
| 2019 | 0.7535 | 1.2758 | 1.1183 |
| 2021 | 0.9870 | 1.4790 | 1.3844 |
| 2024 | 0.7660 | 1.4546 | 1.1964 |
In our calculation, Utah's rate fell from 0.89 to 0.75 deaths per 100 million miles between 2016 and 2019, its lowest of the 15 years shown. The rates for the six neighbors and the rest of the country fell less.
NHTSA's evaluation, published in February 2022, put numbers on that gap. Comparing 2016 with 2019, it found that Utah's death rate per mile driven, which NHTSA calls the fatality rate, fell 18.3%. In the rest of the country it fell 5.9%.
NHTSA's rate of fatal crashes, those in which someone died, fell 19.8% in Utah and 5.6% in the rest of the country. The Insurance Institute for Highway Safety now summarizes that finding as a 20% drop in Utah against 6% elsewhere.
NHTSA computed its rates with mileage summed from the Federal Highway Administration's (FHWA) monthly traffic reports. We rebuilt them with FHWA's annual state mileage table, called VM-2. On that basis, our figure for the same years is a 15.7% drop in Utah, against 6.4% in the rest of the country and 4.5% in Utah's six neighbors.
The direction is the same, and our Utah drop is smaller than NHTSA's. Both are before-and-after comparisons of two years against other states, not tests of what caused the change.
NHTSA also ran a time-series model on Utah's own monthly crash reports from 2010 through 2019. From the years before the bill passed, the model projected what each later month's crash rate per mile driven would be. Each result is the estimated average monthly percent change from that projection. NHTSA marked the results that are statistically significant, meaning its test judged them unlikely to be chance alone.
For crashes involving a driver at .05 or above, it estimated a 24.0% drop in the 21 months after the bill passed, while the law was not yet in force. That change was significant. In the first 12 months the law was in force, the estimate for those crashes was a smaller 14.7% drop, and it was not significant.
Alcohol-positive crashes are a broader group: those with at least one driver reported by police to have had a positive BAC, at any level. For that group, the pattern ran the other way.
Their 5.8% drop before the law took effect was not significant. Their 8.9% drop after it took effect was significant. The report warned that its BAC results "should be interpreted with caution because of the overall small numbers of crash-involved drivers with reported BACs," and that one year of post-law data limited its statistical power.
The FARS estimates in the alcohol-crash chart near the top point the same way for 2019. By our calculation, the death rate in crashes involving a driver at 0.05 or above fell from 0.18 per 100 million miles in 2016 to 0.13 in 2019, a drop of about 29%. In the six neighbors the same rate fell about 6%, and in the rest of the country about 10%.
Some drinkers said they had changed their habits. In a 2019 state survey, 22.1% of drinkers said they had changed their behavior once the law took effect, most often by making sure they had a ride. "I think people are making better decisions on the front end of a night," Sgt. Nick Street of the Highway Patrol told NPR in December 2018, days before the law took effect.
The counts behind that rate are small. From 2010 to 2018, Utah's estimated deaths in crashes with a driver at 0.05 or above ranged from about 36 to about 64 a year. In 2019 the estimate was about 43, inside that range.
What set 2019 apart was the mileage. Utahns drove more miles that year than in any earlier year. About 43 deaths divided by those miles gave the lowest rate.
In a series that moves this much, one low year could be a new level or an ordinary dip. The other half of the 2017 argument, over what the law would cost bars, restaurants and tourism, could be checked sooner.
Did the bars and the tourists stay away?
Opponents had predicted that drinkers and visitors would spend less, and that part of the argument could be measured. Utah sells liquor through its own state stores, so the state's sales records are one place to look.
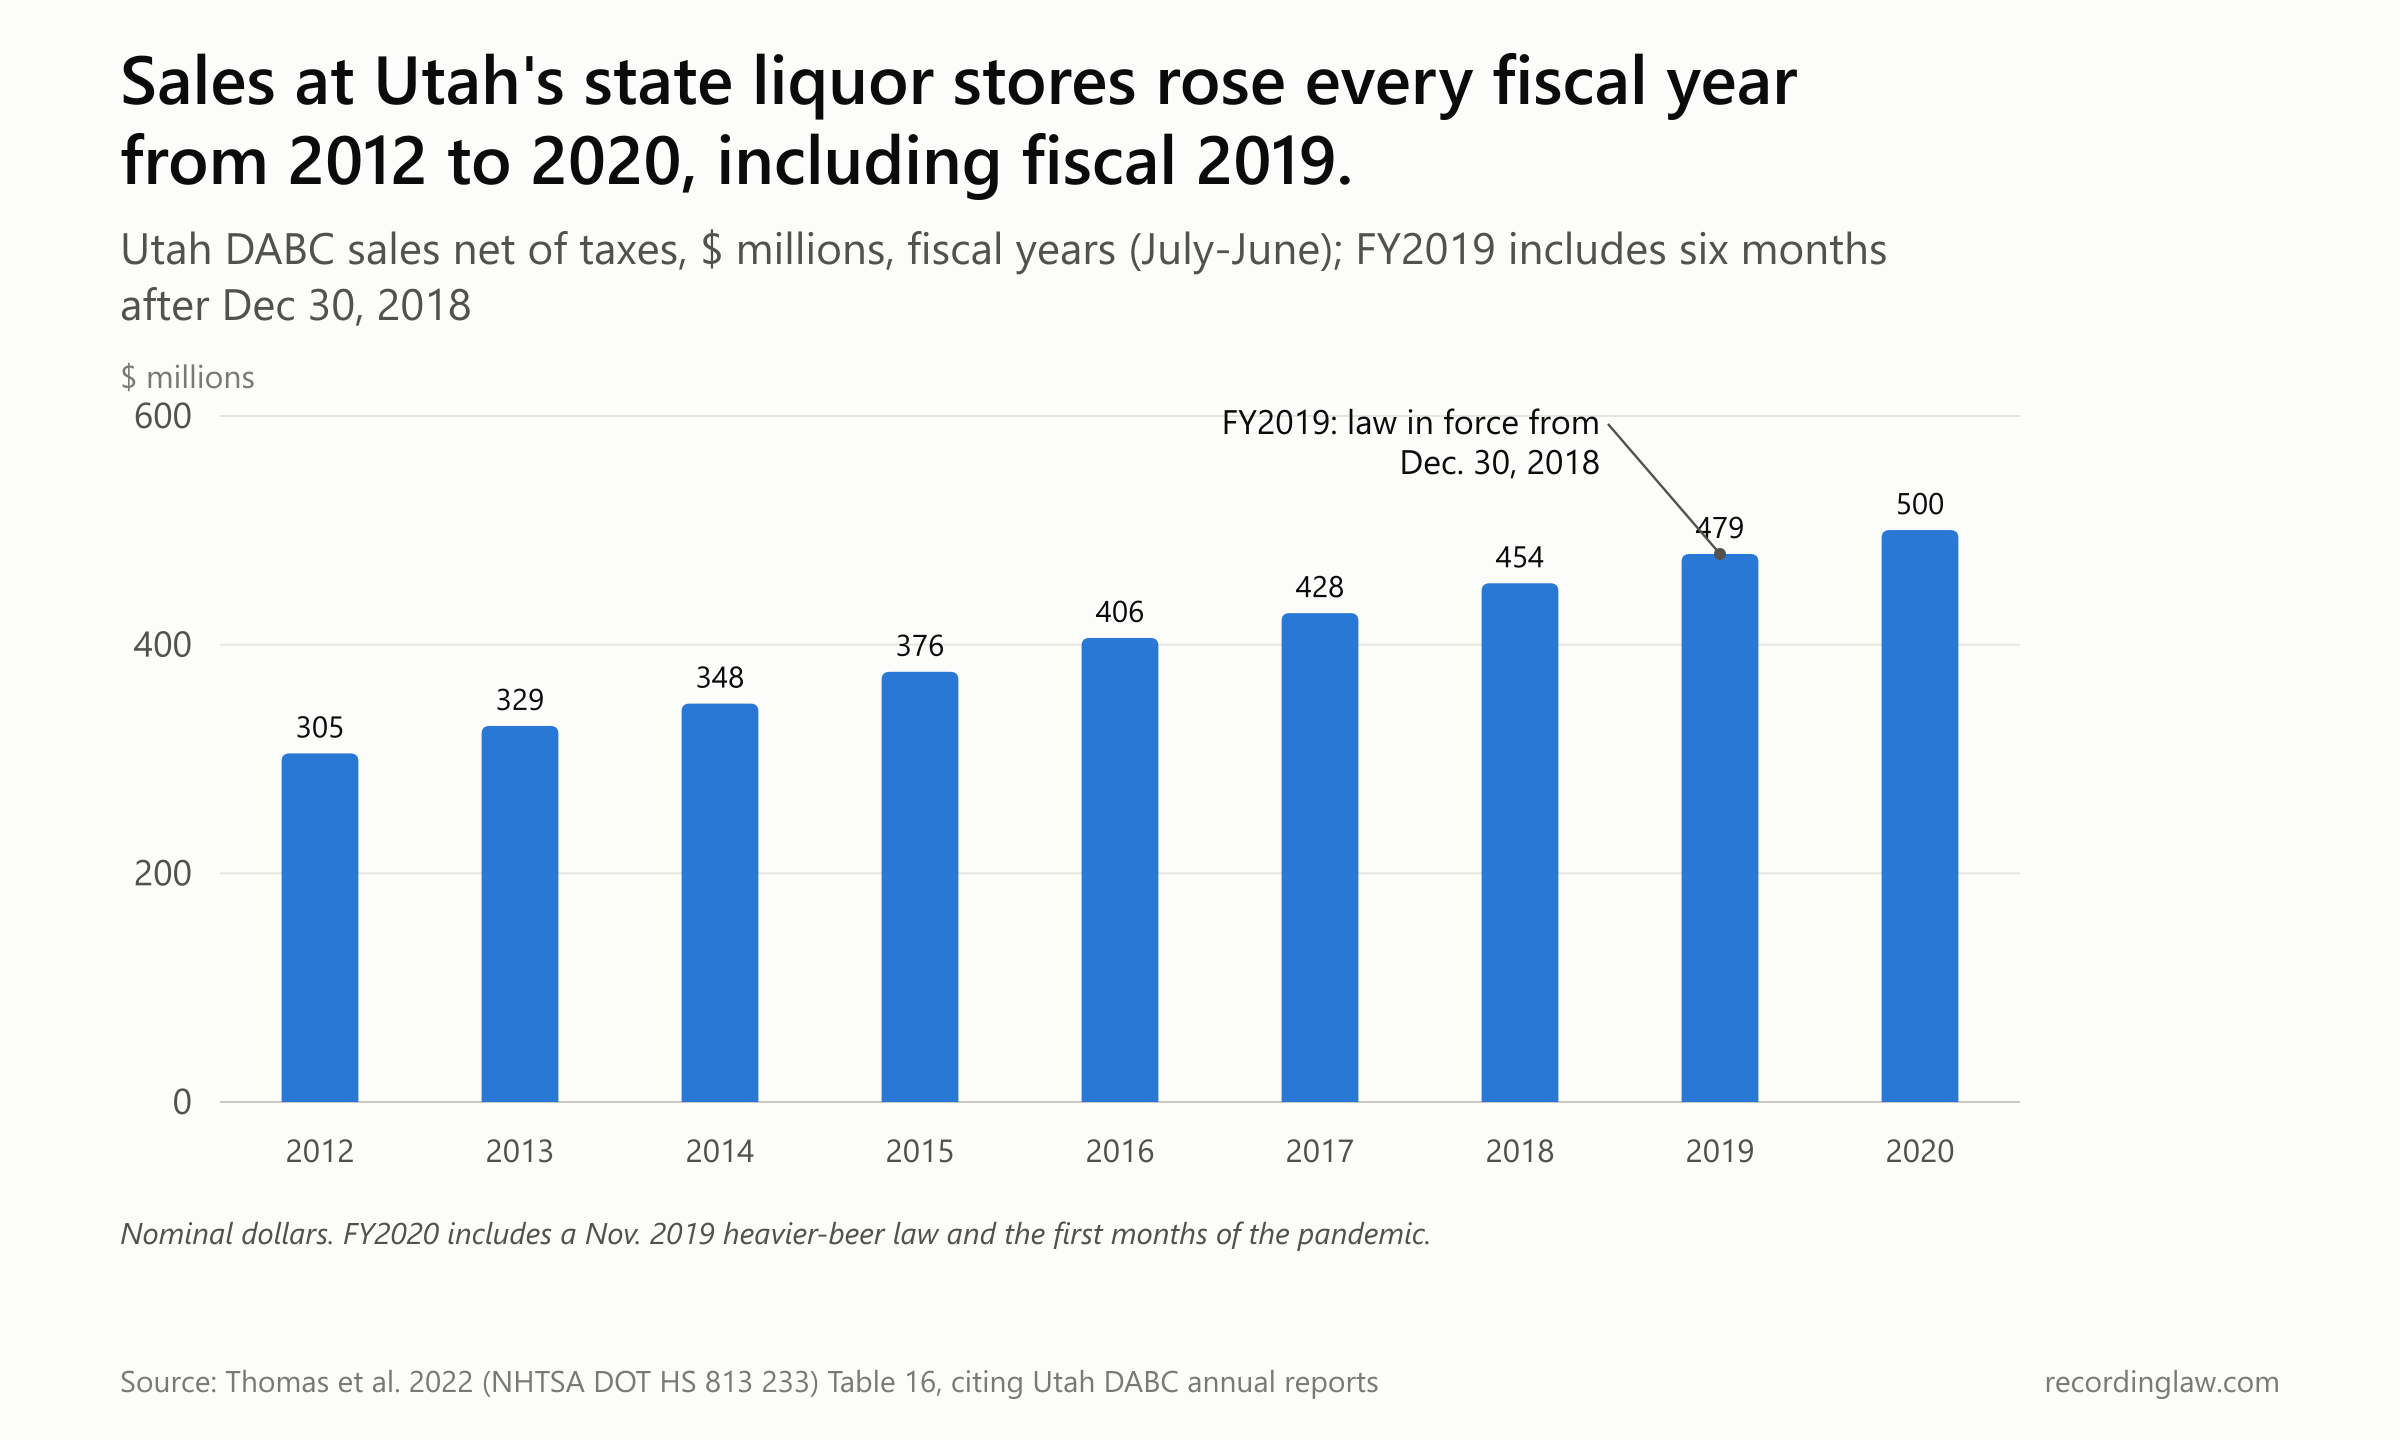
Utah DABC sales net of taxes, FY2012-FY2020, $ millions. Source: Thomas et al. 2022 Table 16.
| Fiscal year (July-June) | Sales net of taxes ($ millions) |
|---|---|
| FY2016 | 405.911 |
| FY2017 | 427.606 |
| FY2018 | 453.689 |
| FY2019 | 479.324 |
| FY2020 | 500.212 |
Sales rose every year, from $406 million in fiscal 2016 to $479 million in fiscal 2019 and $500 million in fiscal 2020. Each fiscal year runs from July to June, so the law took effect halfway through fiscal 2019. Fiscal 2020 also includes a November 2019 state law that let grocery and convenience stores sell heavier beer, which moved some sales out of state stores, and the first months of the pandemic.
NHTSA summed up its sales, tourism and arrest findings in two sentences. "The data reviewed for this study indicated none of the negative effects some projected were realized," it wrote. "In fact, alcohol sales and per capita consumption continued to increase, as did tourism and tax revenues." DUI arrests in 2019, it found, "were similar to the prior five years."
By May 2019 one of the industry's own leaders said the same. David Morris, a bar owner and president of the Utah Hospitality Association, which had started an online fundraising campaign in 2017 to help pay for lobbying to repeal or soften the law, told FOX 13: "I don’t feel it. My numbers are up. We’re busy. Our numbers are growing. Uber and Lyft have been a godsend to this industry as a whole."
Morris still wanted a lighter penalty, such as a warning or citation, for drivers between .05 and .079. How many arrests fall in that band?
A June 2024 Department of Public Safety report counts 516 DUI arrests at .05 to .07 out of 11,246 in state fiscal 2023. About three in five arrests that year had no BAC result recorded or a refused test. Among the arrests with a result, about one in nine was in the .05 to .07 range.
The FARS estimates also put the band the law added at a small share of deaths. Deaths in Utah crashes where the highest driver BAC fell between 0.05 and 0.08 made up between about 1% and 3% of the state's road deaths in each year from 2016 to 2024. In 2016 that was about five deaths.
ABI had put the figure at around 1%. But ABI's number was national, and it counted fatalities by driver BAC. Ours is for Utah alone and counts each crash's deaths by the highest BAC of any driver in it, so the two are not directly comparable.
The law's backers argued for a wider effect: people "thinking twice about drinking and driving," in Niederhauser's words, whatever their BAC. The later studies looked for that across all BAC levels.
Was 2019 a new level or a low year?
The 2019 low did not last. In 2020 the pandemic cut driving, and road death rates rose across the country. In the rest of the US, the overall death rate went from 1.12 deaths per 100 million miles in 2019 to 1.38 in 2021. Utah's alcohol-crash rate also climbed over those years, from 0.13 to 0.25, as the alcohol-crash chart near the top shows.
Of the three alcohol-crash rates in that chart, Utah's was still the lowest. In 2024 the rest of the country's rate was about 1.8 times Utah's, and the neighbors' about 2.4 times. When the Washington State Standard described Utah's record during Washington's 2026 debate, it put it this way: the 20% drop "crept back up during the COVID-19 pandemic, in line with national trends."
Comparing Utah with the national average leaves open whether Utah would have looked different without the law. One way to ask is a method called synthetic control.
We built a "synthetic Utah," a weighted blend of other states whose alcohol-crash rate tracked Utah's before the law. Then we checked whether the two lines parted afterward. For this measure, the closest blend we found was 83% Minnesota and 17% New Jersey.
In 2019, Utah's alcohol-crash rate was 0.03 deaths per 100 million miles below synthetic Utah's. In each year after, the two were within 0.015 of each other. Over 2019 to 2024 the two averaged about the same. The blend matched Utah only loosely before the law, so treat it as a rough check. The year-by-year figures are in How we measured.
Which years count?
Every published study points the same way, toward fewer alcohol-involved crashes or deaths in Utah. They differ on how sure they can be, and two of them turn on which years after the law to count. Two peer-reviewed studies published in 2026 compared Utah with its neighbors directly. Both were funded by the National Institute on Alcohol Abuse and Alcoholism, and both list Jim Fell, the researcher ABI's representative had called "an anti-alcohol activist" in 2017, among the authors.
The first, by Li and colleagues in the American Journal of Preventive Medicine, compared counties in Utah with counties in its six neighbors, 2016 against 2019. In Utah counties, the average number of drivers killed per county with a BAC of .05 or above fell from 1.52 in 2016 to 1.13 in 2019. In neighboring counties it rose from 2.75 to 3.21.
"Utah experienced significantly larger reductions in crash fatalities than contiguous states," the authors wrote, with significant differences at every BAC threshold they tested from .01 up. For drivers killed with a BAC under .01, meaning no measurable alcohol, they found no difference.
The same paper then stretched the window to 2013-2016 against 2019 and 2021-2023. "Sensitivity analyses using the longer observation period (2013–2016 vs. 2019, 2021–2023) showed a similar pattern of reductions in alcohol-involved fatalities in Utah relative to contiguous states, although the estimates were not statistically significant," they wrote.
The second, by Vaca and colleagues in Drug and Alcohol Dependence, looked only at drivers aged 21 to 24. It found a significant drop in Utah relative to its neighbors only for drivers at .15 or above, the very high BACs ABI had pointed to. That result rests on three Utah counties. The lower thresholds pointed the same way without reaching significance.
A third study, released on Oct. 27, 2026, came from the Insurance Institute for Highway Safety, a research group that says it is "wholly supported" by auto insurers and insurance associations. Its authors, Scott Tippetts and Angela Eichelberger, analyzed the first four years of crash data after the law took effect. They measured the share of crashes involving alcohol, counting crashes where a positive test was added to the report later or the driver refused a test, and compared Utah with Arizona, Colorado and Idaho.
They found the law was associated with "a nearly 9% reduction in alcohol-related crashes over the next four years." Among injury crashes, the share involving alcohol fell 12%. Relative to the three comparison states, the share of Utah crashes involving alcohol dropped 12% to 21%.
The study set out its own limits. When the researchers left out the nearly three pandemic years, the reduction was "larger but not statistically significant due to the smaller amount of data." Its abstract adds: "The uniqueness of the alcohol environment in Utah and the confounding effects of the pandemic prevent us from determining the size of the effect." It measures crashes, not deaths, so it is not the same series as the FARS death rates above.
How do the estimates line up, study by study?
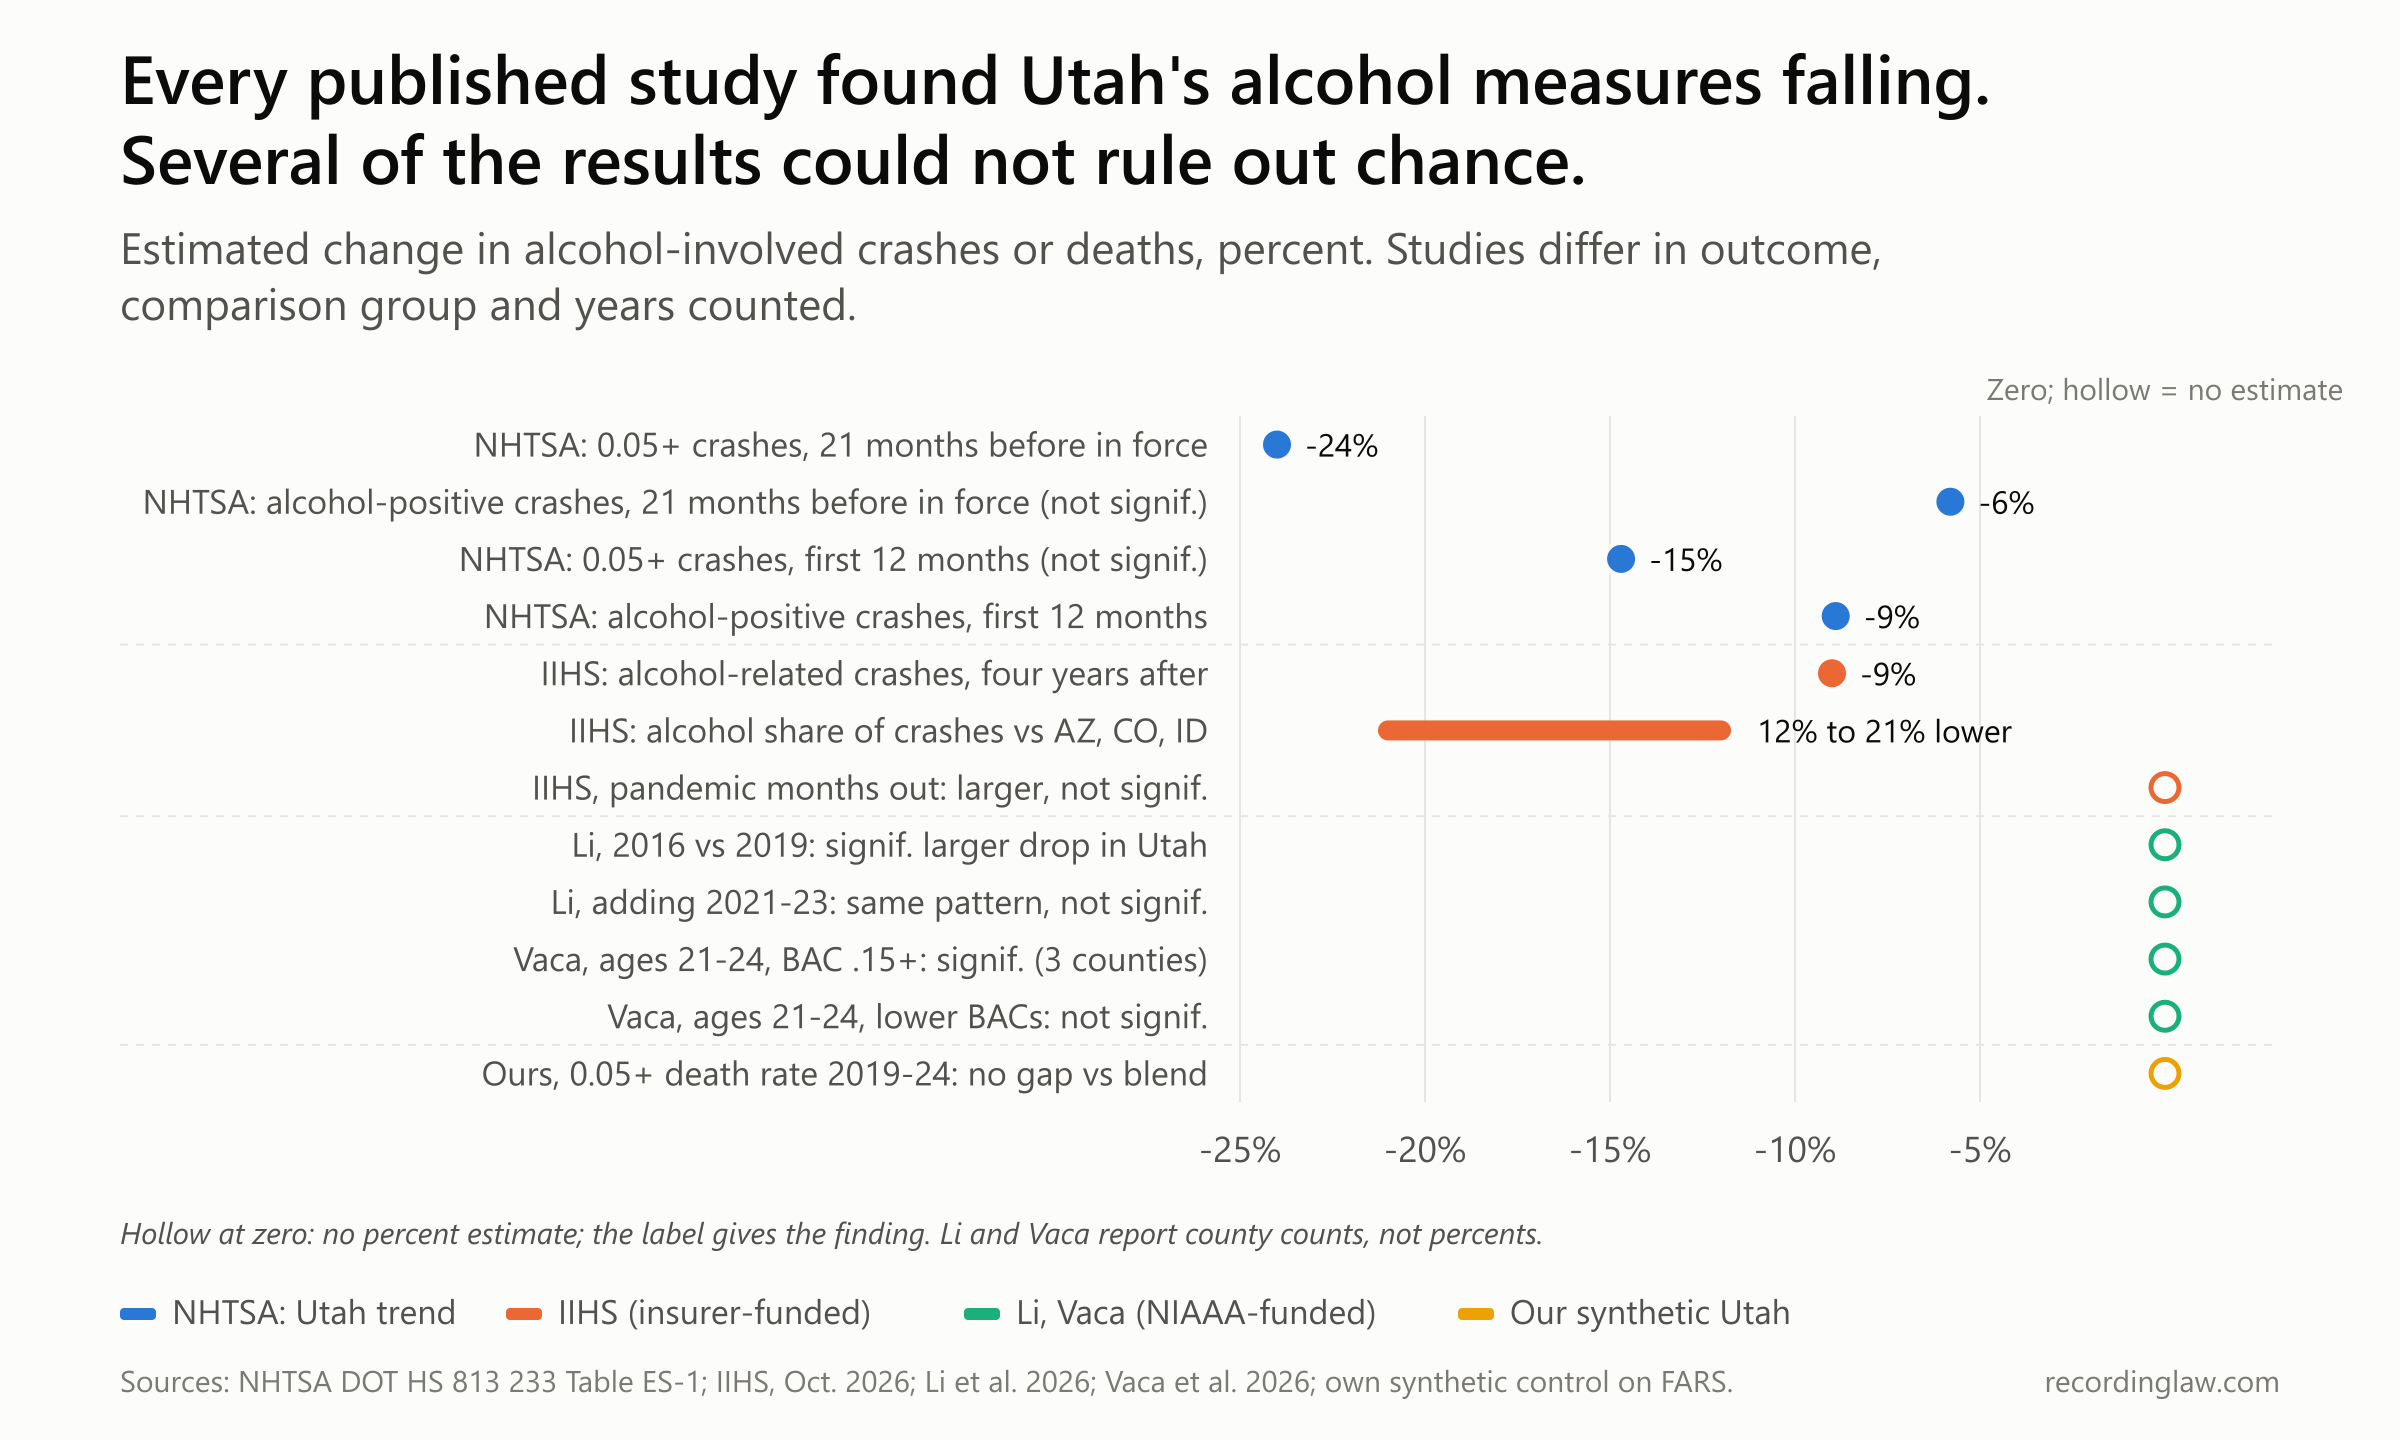
Published estimates of changes in alcohol-involved crashes or deaths in Utah after the 0.05 law, by study. Sources: NHTSA DOT HS 813 233 Table ES-1; IIHS (Tippetts and Eichelberger, October 2026); Li et al. 2026; Vaca et al. 2026; our synthetic control on FARS and FHWA VM-2.
| Study | Measure and window | Finding |
|---|---|---|
| NHTSA (2022) | Crashes with a driver at .05+, 21 months after passage, before the law took effect | -24.0%, average monthly change per mile (significant) |
| NHTSA (2022) | Same crashes, first 12 months in force | -14.7% (not significant) |
| NHTSA (2022) | Alcohol-positive crashes, first 12 months in force | -8.9% (significant); -5.8% before it took effect (not significant) |
| IIHS (2026) | Alcohol-related crashes, four years after | Nearly 9% reduction |
| IIHS (2026) | Share of crashes involving alcohol vs Arizona, Colorado, Idaho | 12% to 21% lower; injury crashes involving alcohol -12% |
| IIHS (2026) | Pandemic months left out | Larger, not statistically significant |
| Li et al. (2026) | Drivers killed at .05+, Utah vs neighboring counties, 2016 vs 2019 | -0.86 per county (significant) |
| Li et al. (2026) | 2013-2016 vs 2019, 2021-2023 | Similar pattern, not significant |
| Vaca et al. (2026) | Drivers 21 to 24, .15+ | Significant drop (3 Utah counties) |
| Vaca et al. (2026) | Drivers 21 to 24, lower BACs | Negative, not significant |
| Our synthetic Utah | .05+ crash death rate, 2019-2024 | About the same as the blend |
The research also disagrees about how much Utah publicized the law. NHTSA found no large-scale state media effort. Li's paper says "Extensive media campaigns and visible enforcement in Utah likely amplified these effects." The IIHS study says the state "passed its 0.05% BAC law with great fanfare more than a year before it was implemented."
Where did the overall drop come from?
Utah's overall road death rate, counting deaths in every crash, followed a different path. By 2024 it was back down to 0.77 per 100 million miles in our calculation, about 14% below 2016, while the rest of the country was back at its 2016 level and the six neighbors were about 9% above theirs.
Was that lower than Utah would have seen anyway? A second synthetic Utah, built for the total death rate, gives a rough answer (year-by-year figures in How we measured).
Against a blend weighted toward Minnesota, Washington, Massachusetts, Wyoming and New Jersey, Utah's total death rate ran between about 0.14 and 0.20 deaths per 100 million miles below the blend in 2022 to 2024. To see whether a gap that size is unusual, we built a synthetic version of every other state the same way, as if each had passed the law. Then, for each state, we compared two things: how far it drifted from its blend after 2019, and how closely the blend had matched it before. Thirteen states drifted at least as far as Utah did, so Utah's gap does not stand out from chance.
Splitting Utah's deaths into two groups shows where the drop came from. In crashes without a driver at 0.05 or above, the death rate fell from 0.71 in 2016 to 0.55 in 2024, the lowest of the 15 years. In crashes with such a driver, the rate rose over the same years.
From 2016 to 2024, the rate outside those crashes fell by about 0.16 deaths per 100 million miles. The rate inside them rose by about 0.03. Taken together, the two changes left Utah's overall rate about 0.13 lower, so the whole net drop came from crashes without a driver at 0.05 or above. The share of Utah's road deaths in crashes with a driver at 0.05 or above went from about 21% in 2016 to about 28% in 2024.
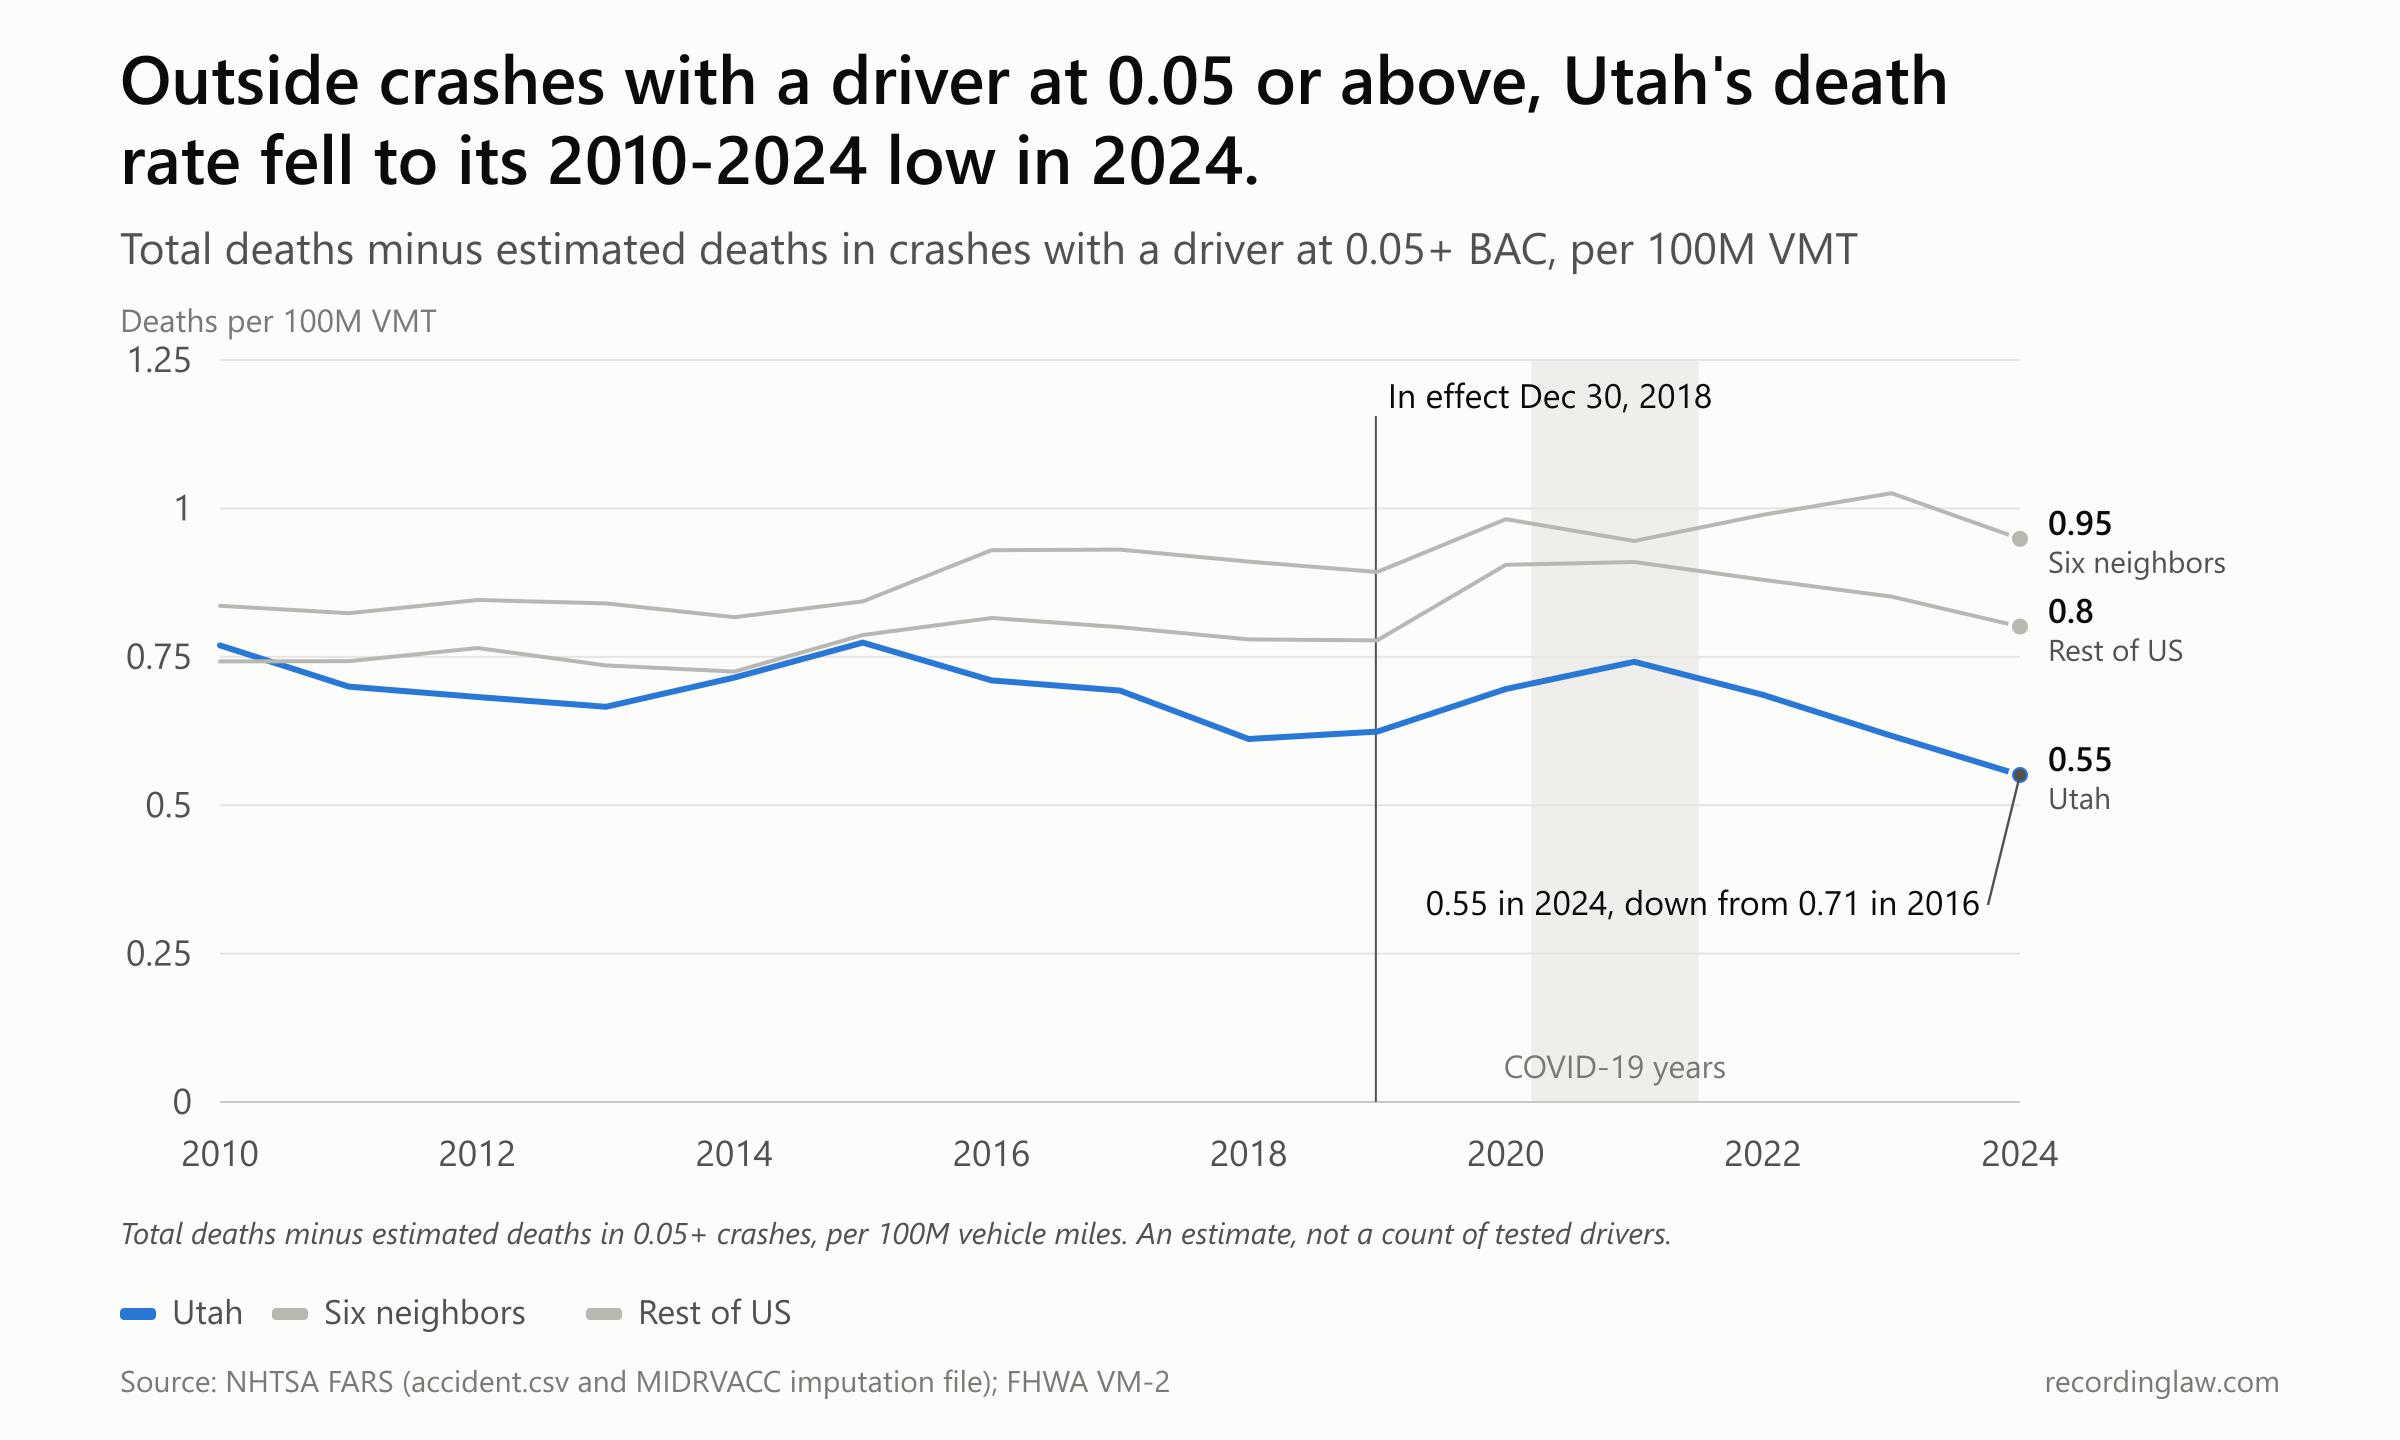
Deaths outside estimated 0.05+ driver crashes per 100M VMT, 2010-2024. Source: NHTSA FARS; rates are our own calculation using FHWA VM-2 mileage.
| Year | Utah | Six neighbors | Rest of US |
|---|---|---|---|
| 2016 | 0.7104 | 0.9296 | 0.8154 |
| 2019 | 0.6241 | 0.8930 | 0.7775 |
| 2021 | 0.7417 | 0.9452 | 0.9098 |
| 2024 | 0.5509 | 0.9487 | 0.8010 |
Why has no state followed?
One national group did shift. MADD's national office had declined to endorse 0.05 in 2013 and again in 2017. In June 2017, MADD's Utah chapter president, Art Brown, told the legislative committee, "For our part here in Utah, we chose not to oppose House Bill 155." By February 2022, MADD's national office said it "supports states that want to pursue lowering the per se law to .05 BAC, such as Hawaii and New York."
Thurston had named the two states he expected to beat Utah. The AP reported the week Herbert signed that bills in Washington and Hawaii "appear dead." Nine years on, both states have come back to the idea, and both have stalled.
In 2026, Washington moved first of the two. By the time its Senate voted, the federal crash data showed Utah's alcohol-crash rate had dropped in 2019 and then risen in 2020, as rates rose nationally. NHTSA had also found none of the business losses opponents predicted. The synthetic comparisons in this story are our own 2026 analysis.
On Jan. 28, Washington's Senate passed SB 5067 by 26-23, "the first time such a measure cleared either chamber" in that state, the Washington State Standard reported. Its sponsor, Sen. John Lovick, a Mill Creek Democrat, is a former State Patrol trooper and Snohomish County sheriff. A survey commissioned by the Washington Traffic Safety Commission found 54% of 850 residents supported a 0.05 limit, rising to 71% after they were given more information.
Opponents raised arguments Utah had heard. "In the Senate, foes questioned the ability to determine if one is legally drunk and worried enacting the change would drive away customers of bars, wineries and other hospitality businesses," the Standard reported, while progressive Democrats worried about police profiling. A nearly identical House bill, HB 2362, cleared the House Community Safety Committee 5-4 but was not heard in Transportation.
On Feb. 24 the Senate bill stalled in the House Community Safety Committee, the panel that had backed the House bill. Its chair, Rep. Roger Goodman, a Kirkland Democrat, said he could not corral enough Democratic support to advance it, the Standard reported. The Washington Brewers Guild, a craft-brewer trade group, thanked supporters who had contacted legislators: "every little bit helped stop this bill." Lovick said he was not discouraged: "we’ll get there."
Hawaii's Senate passed SB 2463 by 25-0 on March 10, 2026. A House transportation committee approved it 9-0, and on March 30 it went to the Judiciary and Hawaiian Affairs Committee, where its status page shows no further action. In Illinois, HB 4333 was sent back to the House Rules Committee on March 27, 2026. In New York, S53 has sat in the Senate Transportation Committee since it was referred there on Jan. 7, 2026.
In Oklahoma, SB 1914, which would have set 0.05 for drivers 21 and older from June 1, 2028, was referred to the Senate Judiciary Committee on Feb. 3, 2026, with no further action shown.
Another New Year's weekend at 0.05
The next dated chance for a second state is Washington's 2027 legislative session, where Goodman has pledged to work through his caucus's concerns in hopes of passing the lower limit.
On Dec. 30, 2026, Utah's limit turns eight, on the eve of another New Year's weekend at 0.05, the weekend Thurston picked partly because it is "one of the busiest drunk driving weekends of the year." More than nine years after he told senators that Hawaii and Washington would beat Utah to the punch, neither has, and no other state has either.
How we measured
Deaths. Traffic deaths are the sum of FATALS in NHTSA's FARS accident file for each state, 2010-2024, from the national CSV downloads. FARS 2024 is NHTSA's Annual Report File (first released April 1, 2026), not the final file, so 2024 counts can change slightly.
FARS 2025 had not been released as of Nov. 6, 2026. Our recount matches NHTSA's published Utah figures for 2016 (259 fatal crashes, 281 deaths) and 2019 (225 fatal crashes, 248 deaths).
Mileage and rates. Our rates divide deaths by vehicle miles from FHWA Highway Statistics Table VM-2, each year from its own edition, with no later revisions applied. NHTSA's evaluation instead summed FHWA's monthly Traffic Volume Trends figures, which it calls "unadjusted," and warns that results "may be different if alternative sources of VMT data are utilized."
That is why NHTSA reports an 18.3% drop in Utah's fatality rate from 2016 to 2019 (5.9% for the rest of the US) and our VM-2 figures show 15.7% (6.4% for the rest of the US). The fatal crash rate drop is 19.8% in NHTSA's figures and 17.0% in ours. "About three times as fast" is 18.3 divided by 5.9. We did not recompute NHTSA's figures on its mileage basis.
Pooled neighbor and rest-of-US rates are total deaths over total miles, so larger states weigh more. The rest of the US is the other 49 states plus DC.
Alcohol involvement. FARS does not have a measured BAC for every driver, so NHTSA publishes ten imputed BAC values per crash, which are statistical estimates of the BAC. For each crash we took the share of the ten in which the highest driver BAC was at or above 0.05 (or 0.08) and multiplied by the crash's deaths. The result is an estimate, not a count of tested drivers, and it covers drivers of all ages and vehicle types, while Utah's law applies to drivers 21 and over in noncommercial vehicles.
Deaths "between 0.05 and 0.08" are the 0.05-and-above estimate minus the 0.08-and-above estimate. Deaths outside 0.05+ crashes are total deaths minus the 0.05-and-above estimate.
From 2016 to 2024 Utah's total rate fell by 0.128 deaths per 100 million miles. In the same years the alcohol-crash rate rose by 0.032, and the rate outside those crashes fell by 0.160, which is why we say the overall drop came entirely from crashes without a driver at 0.05 or above. Shares of deaths: 57.6 of 281 in 2016 (20.5%) and 77.8 of 277 in 2024 (28.1%).
Why not Utah's own alcohol-death counts. Utah's Department of Public Safety reports state-defined alcohol-related deaths, but driver BAC was not required on the state crash report until 2020, so that series jumps partly because of the reporting change. We use FARS for every trend.
NHTSA's time-series results come from its Table ES-1: an ARIMA model (the time-series model described above) of Utah's monthly state crash data, January 2010 to December 2019, giving the estimated average monthly percent change per mile driven in two windows: 21 months after passage (before the law took effect) and 12 months after it took effect. NHTSA marks significance at p under .05, two-tailed.
Crashes with a driver at .05 or above: -24.0 (significant), then -14.7 (not significant). Alcohol-positive crashes: -5.8 (not significant), then -8.9 (significant). NHTSA left 2020 out because of the pandemic.
Synthetic control. For each measure we fitted non-negative weights summing to one across the 49 other states (DC excluded) to match Utah's 2010-2018 rates, then compared 2019-2024. Total death rate blend: Minnesota 0.196, Washington 0.184, Massachusetts 0.184, Wyoming 0.172, New Jersey 0.111, Alaska 0.044, Connecticut 0.035, Idaho 0.028, New York 0.019, Nevada 0.018, plus under 0.01 each on Illinois and New Hampshire. Alcohol-crash blend: Minnesota 0.826, New Jersey 0.174.
For inference we ran the same fit for every state and compared the ratio of post-2019 to pre-2019 fit error, that is, how far each state's blend missed it after 2019 divided by how far it missed before. Utah's total-death-rate ratio (5.2 in the placebo run) ranked 14th of 50. Its alcohol-crash ratio (0.37) ranked 50th of 50, the smallest of any state, so neither stands out from chance.
The fit is our own implementation and indicative only. A pool of only the Mountain West states could not match Utah's lower pre-law level and is not used.
Total death rate per 100 million miles, Utah vs synthetic Utah (49-state donor pool; source: NHTSA FARS, FHWA VM-2, own calculation):
| Year | Utah | Synthetic Utah | Gap |
|---|---|---|---|
| 2019 | 0.7535 | 0.8515 | -0.098 |
| 2020 | 0.9124 | 0.9595 | -0.047 |
| 2021 | 0.9870 | 0.9713 | 0.016 |
| 2022 | 0.9291 | 1.0723 | -0.143 |
| 2023 | 0.8096 | 1.0106 | -0.201 |
| 2024 | 0.7660 | 0.9480 | -0.182 |
Estimated death rate in crashes with a driver at 0.05 or above, Utah vs synthetic Utah (Minnesota 83%, New Jersey 17%):
| Year | Utah | Synthetic Utah | Gap |
|---|---|---|---|
| 2019 | 0.1294 | 0.1574 | -0.028 |
| 2020 | 0.2165 | 0.2294 | -0.013 |
| 2021 | 0.2453 | 0.2567 | -0.011 |
| 2022 | 0.2432 | 0.2546 | -0.011 |
| 2023 | 0.1929 | 0.1879 | 0.005 |
| 2024 | 0.2152 | 0.2083 | 0.007 |
The 2026 studies. Li and colleagues compared Utah counties with counties in Arizona, Colorado, Idaho, Nevada, New Mexico and Wyoming, 2016 against 2019, using FARS imputed BAC and driver deaths only. Their estimates (-0.67 to -1.17 across BAC thresholds, -0.86 at .05 and above) are differences in the average number of drivers killed per county, not percentages.
Li's sample was 7,930 drivers, 741 of them in Utah. Vaca and colleagues used the same design for drivers aged 21 to 24 (820 drivers); their significant .15-and-above result rests on three Utah counties. Both were funded by NIAAA grants R56AA031271 and R01AA032274.
The IIHS study (Tippetts and Eichelberger, October 2026) looked at the share of crashes involving alcohol in Utah over four years after the law, with the period between passage and effect treated separately and two post-law windows, one before the pandemic and one including it. It compared Utah with Arizona, Colorado and Idaho. IIHS lists its funders as auto insurers and insurance associations.
Sales and arrests. Liquor sales are the "net of taxes" row of NHTSA's Table 16, which draws on the state liquor agency's annual reports, in nominal dollars for fiscal years ending in June. The agency's later reports state gross sales instead (for example, $551.35 million in fiscal 2025), which are not comparable with this series, so the chart stops at fiscal 2020.
Arrest counts by BAC come from the Department of Public Safety's June 2024 report. For fiscal 2023, 1,449 arrests had a refused test and 5,272 had no BAC result reported, leaving 4,525 with a result. Of those, 516 (11.4%, about one in nine) were at .05 to .07. Fiscal 2019 (July 2018 to June 2019, half of it before the law took effect) was 370 of 5,086 with a result (7.3%). The January 2019 breakdown of 38 arrests at .05 to .079 (7 under 21, 24 alcohol-restricted drivers with a prior DUI, 2 with drugs, 1 refusal, 4 with that BAC as the only issue) is from the Department of Public Safety via FOX 13.
What comes next. The newest FARS year is 2024, released in April 2026 as NHTSA's Annual Report File, the version that comes before the final file and can still be revised. As of Nov. 6, 2026, NHTSA had not posted the 2025 file, and it says the 2025 annual and final files will be available within two years. When they arrive, Utah's law gets its seventh year of data, and the synthetic comparisons above can be run again.
What this cannot show. Utah has one treated state and a short, pandemic-interrupted post-law period. Its road death rate was already well below the national rate, and its mileage grew about 15% from 2016 to 2024. None of the comparisons here, ours or the published ones, can isolate the law from everything else that changed.
Frequently Asked Questions
Which states have a 0.05 BAC limit?
Only Utah. Since Dec. 30, 2018, it has been a crime in Utah for drivers 21 and over in noncommercial vehicles to drive with a blood alcohol concentration of 0.05 or higher. The other 49 states and the District of Columbia use 0.08.
Did Utah's 0.05 law reduce traffic deaths?
The answer depends on the years compared. Using summed monthly Traffic Volume Trends mileage, NHTSA found Utah's fatality rate, deaths per 100 million miles driven, fell 18.3% from 2016 to 2019, against 5.9% in the rest of the country. Our recalculation with annual FHWA VM-2 mileage gives 15.7% and 6.4%. A 2026 study by Li and colleagues found significantly larger drops in alcohol-involved driver deaths in Utah than in neighboring states over the same years. When Li's study added 2021 to 2023, it found a similar pattern of reductions that was no longer statistically significant. A 2026 IIHS study of crashes reported a lasting reduction in alcohol-related crashes, which was larger, but with less data not statistically significant, once the pandemic months were left out. None of these comparisons can fully separate the law from other changes.
Is Utah's drunk-driving death rate higher or lower than before the law?
By our calculation from FARS estimates and FHWA VM-2 mileage, the death rate in Utah crashes with a driver at 0.05 or above was 0.18 per 100 million miles in 2016, 0.13 in 2019 and 0.22 in 2024. Utah's overall road death rate was 0.89 in 2016 and 0.77 in 2024, below the rest of the country in both years.
Did alcohol sales or tourism fall in Utah after the 0.05 law?
Not in the years studied. Utah state liquor-store sales net of taxes rose from about 406 million dollars in fiscal 2016 to about 500 million dollars in fiscal 2020, and NHTSA reported that tourism and tax revenues also kept rising. Restaurant and tourism groups had predicted losses.
How many drinks does it take to reach 0.05?
Estimates differ by source. In 2017 the American Beverage Institute, which the AP described as a national restaurant group, said a 120-pound woman could exceed 0.05 after one drink. In 2024 Tao Kwan-Gett, chief science officer of the Washington Department of Health, told legislators it takes at least three drinks for a 137-pound woman and four for an average 170-pound man in two hours on an empty stomach. Food, body weight and timing all change the result.
Which other states are considering a 0.05 limit?
Washington's Senate passed SB 5067 in January 2026, but it stalled in a House committee whose chair hopes to pass the lower limit in 2027. Hawaii's SB 2463 passed its Senate 25-0 and was last referred to a House committee in March 2026. Illinois HB 4333, New York S53 and Oklahoma SB 1914 were in committee as of 2026.
When will new crash data for Utah be available?
The newest federal FARS file covers 2024 and was first released in April 2026. NHTSA says the 2025 annual and final files will be available within two years. As of November 2026 the 2025 file had not been posted.
Updates
Reworded for readability. No figures, quotes, sources or findings changed.
Restructured as a feature: chart titles state the finding, side details moved to How we measured. Every figure and quote was re-checked against its source.
Independently fact-checked against the cited primary sources
Independently fact-checked against the cited primary sources
Sources and References
- Utah Legislature, HB 155 (2017 General Session), Driving Under the Influence and Public Safety Revisions: enrolled text, votes and effective date(le.utah.gov).gov
- NHTSA, Evaluation of Utah’s .05 BAC Per Se Law (DOT HS 813 233, February 2022), including Appendix A legislative testimony and Tables ES-1, ES-2 and 16(rosap.ntl.bts.gov).gov
- NHTSA, Fatality Analysis Reporting System (FARS) national CSV files, 2010-2024(static.nhtsa.gov).gov
- NHTSA, FARS 2024 release notes (first release of the 2024 annual file, April 1, 2026)(static.nhtsa.gov).gov
- FHWA, Highway Statistics, Table VM-2 (vehicle miles traveled by state), 2010-2024 editions(fhwa.dot.gov).gov
- Insurance Institute for Highway Safety (wholly supported by auto insurers and insurance associations), Alcohol and drugs(iihs.org)
- Li K, Fell JC, Hosseinichimeh N, Hu S, Vaca FE. Utah’s Move From 0.08 to 0.05 Blood Alcohol Concentration Per Se Policy: Effects on Driver Crash Fatalities Compared With Contiguous States. American Journal of Preventive Medicine, 2026(pmc.ncbi.nlm.nih.gov).gov
- Vaca FE, Fell JC, Loose P, Hosseinichimeh N, Li K. Evaluating Utah’s .05 BAC law: Alcohol-involved crash fatalities among 21-24y/o drivers compared to contiguous states. Drug and Alcohol Dependence, 2026(pmc.ncbi.nlm.nih.gov).gov
- Utah Department of Public Safety, Report on Utah’s 0.05 BAC Law: Enforcement Outcomes, Arrests and Alcohol-Related Crash Data (revised June 30, 2024)(wtsc.wa.gov).gov
- Utah Department of Alcoholic Beverage Services, 90th Annual Report (fiscal 2025)(abs.utah.gov).gov
- American Beverage Institute letter to the Utah Legislature’s Transportation Interim Committee (June 21, 2017)(le.utah.gov).gov
- Utah Education Network, Gov. Gary Herbert monthly news conference transcript (March 2017)(uen.org)
- The Spokesman-Review (Associated Press), Board recommends lowering drunk driving threshold (May 14, 2013)(spokesman.com)
- NPR, Utah first in the nation to lower its DUI limit to .05 percent (Dec. 26, 2018)(npr.org)
- KSL, Legislature makes Utah’s DUI threshold lowest in nation at .05 percent (March 8, 2017)(ksl.com)
- KSL, Utah restaurant associations ask governor to veto .05 DUI law (March 21, 2017)(ksl.com)
- KSL, Herbert signs bill lowering blood alcohol limit to .05 percent (March 23, 2017)(ksl.com)
- KSL, National beverage group likens Utah’s .05 DUI law to driving while old (July 2017)(ksl.com)
- KSL, Troopers make 8 arrests in 24 hours after Utah’s new DUI law (Dec. 31, 2018)(ksl.com)
- The Gazette (Associated Press), Utah getting toughest drunken driving limit in the US (March 24, 2017)(gazette.com)
- KUER, Opponents step up pressure on governor to veto BAC bill (March 17, 2017)(kuer.org)
- FOX 13, Ad running in Idaho urges people not to vacation in Utah over new .05 DUI law (April 25, 2017)(fox13now.com)
- FOX 13, Tourism, restaurant groups worry about impact of Utah’s new .05 DUI law (June 21, 2017)(fox13now.com)
- The Salt Lake Tribune, Gov. Herbert says new toughest-in-nation DUI law will stand without major changes (Feb. 15, 2018)(sltrib.com)
- FOX 13, Bill to delay .05 DUI fails to pass (Feb. 28, 2018)(fox13now.com)
- FOX 13, The Utah State Legislature is going to take another look at .05, but it’s here to stay (May 7, 2019)(fox13now.com)
- MADD, press release on Utah’s .05 BAC law (Feb. 11, 2022)(madd.org)
- Washington State Standard, Lower drunk driving limit approved by WA Senate (Jan. 28, 2026)(washingtonstatestandard.com)
- Washington State Standard, Drunk driving limit will not be lowered in Washington this year (Feb. 25, 2026)(washingtonstatestandard.com)
- Washington Beer Blog, Update from the Washington Brewers Guild on the 2026 legislative session (Feb. 26, 2026)(washingtonbeerblog.com)
- Hawaii State Legislature, SB 2463 (2026) status(capitol.hawaii.gov).gov
- Illinois General Assembly, HB 4333 (104th General Assembly) status(ilga.gov).gov
- New York State Senate, S53 (2025-2026 session)(nysenate.gov).gov
- Insurance Institute for Highway Safety, Utah's stricter alcohol limit linked to lasting drop in alcohol-related crashes (Oct. 27, 2026)(iihs.org)
- Tippetts AS, Eichelberger AH. Extended evaluation of the effects of Utah's 0.05% BAC per se law on crashes: an update with additional years and regional contrasts (IIHS, October 2026)(iihs.org)
- Insurance Institute for Highway Safety, Member groups (funding)(iihs.org)
- NHTSA, DOT HS 813 829 (2026): 2024 FARS Annual Report File and timing of the 2025 annual and final files(crashstats.nhtsa.gov).gov
- The Salt Lake Tribune (June 13, 2017), Group fighting Utah's tough 0.05 alcohol limit gathers 10,000 signatures, as filed with the Utah Legislature's interim committee(le.utah.gov).gov
- Oklahoma Legislature, SB 1914 (2026) status(oklegislature.gov).gov