Ending Cambridge Rent Control Added $2 Billion to Home Values From 1994 to 2004, Economists Estimate. Most Went to Homes Never Under It.

Independently fact-checked against primary sources (last audited November 10, 2026). · 6 primary sources cited on this page. How we verify our legal content
On election night in November 1994, volunteers for the campaign to end rent control held a potluck supper at the VFW post on Huron Avenue in Cambridge, Massachusetts, and watched the returns on television. By midnight victory seemed assured, Robert P. Moncreiff later wrote in his history of the campaign. Some stayed until all the returns were in, then formed "a small caravan to drive by the houses of Cambridge Civic Association city councillors and blow their car horns." The Cambridge Civic Association had backed rent control.
The city they drove through had voted the other way. Question 9 was the statewide ballot question to end rent control, and Cambridge voters rejected it by 18,631 to 13,309, about 58% to 42%, according to the official count. Boston and Brookline, the only other places in the state with rent control, voted no as well. Statewide, the measure passed by 53,863 votes out of more than 2 million cast on it.
Rent control came to Cambridge in 1970. Edward A. Crane, a city councillor and four-time mayor who was its principal opponent among the city's politicians, predicted then that if the city adopted rent control it "would never get rid of it," Moncreiff recounts. For nearly a quarter of a century that looked right. Then the rest of Massachusetts settled the question, and the controls ended in January 1995.
What followed was later measured block by block. Rents for tenants of formerly controlled units rose 40% in three years, and the households living in those units changed faster than those in never-controlled units. Economists from MIT and UC Berkeley later estimated that property values rose by about $2 billion more than they otherwise would have. By their estimate, most of that went to homes that had never been under rent control at all.
Thirty-two years after the vote, their study came back in a 2026 fight over a statewide rent cap. The state's highest court took that cap off the ballot in June. Who gained and who paid when the state ended Cambridge's rent control? And what can the record tell voters and legislators now?
The house next door
To find out who gained, David Autor and Parag Pathak of MIT and Christopher Palmer, later of UC Berkeley, followed Cambridge property values through the repeal. They measured each property's exposure to rent control, which is the share of residential units within a fifth of a mile that were controlled. Then they compared properties with more and less exposure, before and after 1994.
They used the city's assessed values (the values it sets for property tax) and sales from 1988 to 2005. The research was funded by the Alfred P. Sloan Foundation, the Lincoln Institute for Land Policy, the National Science Foundation and the Rappaport Institute for Greater Boston.
Two results came straight from the buildings that had been controlled. During the rent-control years, those properties were valued at a discount of about 50% to comparable never-controlled properties in the same neighborhoods. After rent control ended, their assessed values rose by about 18% to 25% relative to the rest.
The larger finding was about the houses next door. A house at the average level of exposure, where 34% of nearby units had once been controlled, rose in value by roughly 12% more than a house with no controlled neighbors. Nearby cities without rent control, Somerville, Malden and Medford, showed "no consistent evidence of similar differential rises in property prices in comparison neighborhoods," the authors wrote.
How did the added value divide between the homes that had been controlled and the homes that never were? The study exists in two versions, a 2012 working paper and a 2014 journal article, and their totals differ. Where the two differ, this story shows both and prefers the published version for headline figures.
The authors published their summary of the journal article as a 2014 Cato Institute research brief. The editor of that series was Jeffrey Miron, a Boston University economist who had prepared a survey for the committee campaigning to end rent control in 1994. The brief itself is the authors' own text.
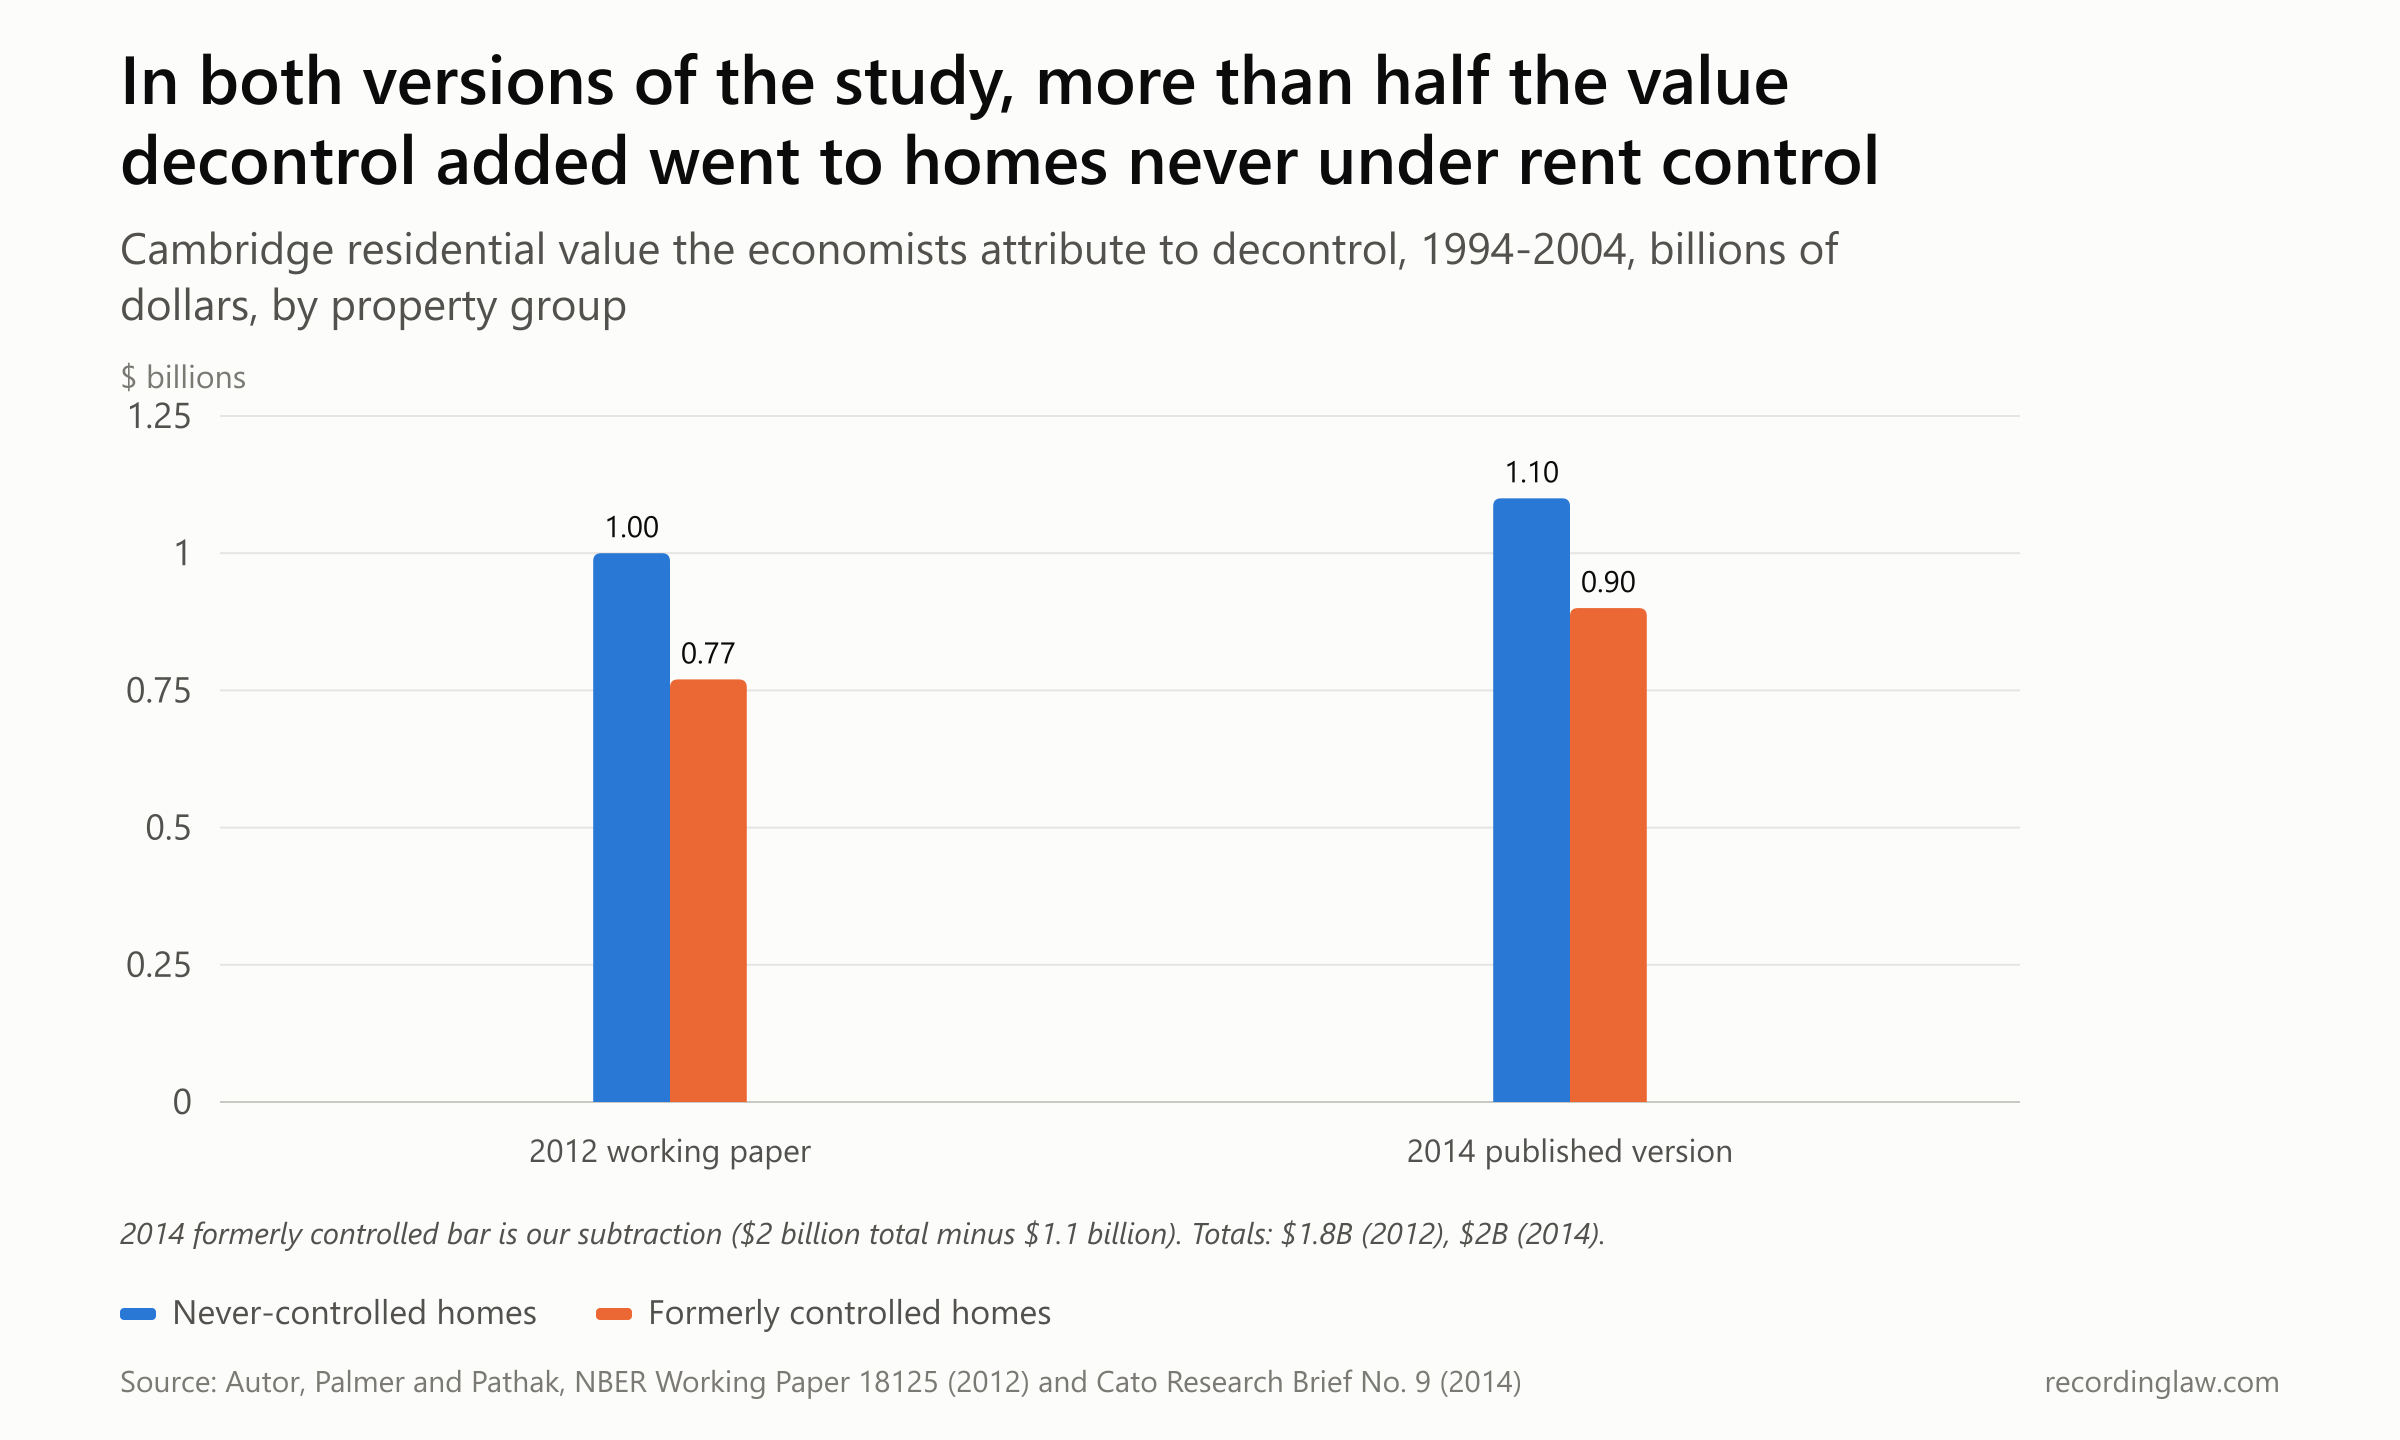
Source: Autor, Palmer and Pathak, NBER Working Paper 18125 (June 2012), Section 8, and the authors' summary of the 2014 published version in Cato Institute Research Brief No. 9. The 2014 formerly controlled figure is our subtraction.
| Estimate, Cambridge residential property, 1994 to 2004 | 2012 working paper | 2014 published version (authors' summary) |
|---|---|---|
| Total value added by decontrol | $1.8 billion | $2 billion |
| Total residential appreciation | $7.7 billion ($6.0 billion never-controlled plus $1.7 billion formerly controlled, our sum) | $7.7 billion |
| Gain at never-controlled properties attributed to decontrol | $1.0 billion of $6.0 billion appreciation | $1.1 billion |
| Gain at formerly controlled properties attributed to decontrol | $770 million of $1.7 billion appreciation ($567 million direct, $203 million spillover) | $300 million direct effect, plus about $600 million indirect ($1.7 billion minus $1.1 billion, our subtraction) |
| Share borne by or accruing to never-controlled owners | 57% of the decontrol-induced increase | 55% of the capitalized cost of rent control |
On who gained, both versions agree. More than half of the added value landed on homes that had never been under rent control. The journal's abstract says the effect accounted for "a quarter of the $7.8 billion" in appreciation, and that "the majority of this contribution stems from induced appreciation of never-controlled properties." The authors' 2014 summary gives that total appreciation as $7.7 billion.
By the working paper's figures, the 7,426 never-controlled houses were worth $7.3 billion in 2004. Without decontrol, they would have been worth $6.5 billion. That difference of $0.8 billion comes to roughly $100,000 a house on average.
The 1994 campaign had been fought over a different question, who was living in the controlled apartments. It began with a landlord group's plan to go around the city where those tenants lived, by way of a statewide vote.
A city law, decided by the whole state
The Small Property Owners Association, a Cambridge landlord group founded in 1987, started with one stated mission. "The founding mission of the Small Property Owners Association was to abolish rent control laws in the city of Cambridge," reads the finding aid for its founders' papers at History Cambridge. Its route around the city was a statewide ballot initiative. Denise Jillson, a co-chair of the association until 1993, led it through the 1993 signature drive.
The law they wanted gone covered Cambridge rental property built before 1969. The ordinance capped rents on that fixed set of buildings from 1970 until the repeal, so controlled and uncontrolled homes stood side by side on the same streets.
On the eve of repeal, roughly a third of the city's homes were controlled, according to Autor, Palmer and Pathak. In neighborhoods with older housing that share often passed 60%. In 1994 the executive director of the city's Rent Control Board put it in households instead. By the director's count, a ban would affect 16,000 of them, "half its rental stock," and "a quarter of the city's population," the Harvard Crimson reported.
Controlled apartments were cheap by local standards. Citing the economist David Sims, the economists' 2012 working paper said they "typically rented at 25 to 40 percent below the price of nearby non-controlled properties." Their 2014 summary put the gap at "over 40 percent."
The Massachusetts Association of Realtors underwrote about $10,000 of the first signature drive's expenses, according to Moncreiff. In 1993, John Melley of that association framed the repeal as "just a fundamental private property rights issue." Tenants, as the Christian Science Monitor summarized their view, called it "undemocratic" to put the question "to a statewide vote when only a few cities have such rent-control regulations." If it passed, the Monitor noted, "Massachusetts would be the 27th state to pass an anti-rent-control initiative."
The City of Cambridge went to court on that point. It argued, as the Crimson reported, "that it would be unfair for the entire citizenry of Massachusetts to make a decision that would impact just three cities."
On July 14, 1994, the Supreme Judicial Court, the state's highest court, ruled that a statewide referendum on rent control did not violate the home-rule provision of the state constitution. That provision is the part that protects a city's power over its own local affairs. The question would go to every voter in Massachusetts.
What each side said rent control was doing
The Yes campaign was the side asking voters to end rent control. Its consultant, Dennis Dyer, built the message around a spring 1994 poll, Moncreiff wrote: "that rent control is a well-intentioned but failed policy that unfairly benefits affluent tenants at the expense of property owners of modest means."
Jillson, who chaired the Yes committee, the Massachusetts Homeowners Coalition, put numbers on it the day before the vote. "Upwards of 87 percent of people on rent control are advantaged - white, single, college-educated, and in their prime earning years," she told the Monitor. "Rent control places the burden of providing affordable housing on property owners and in many cases the property owners are less affluent than the tenants."
Jeffrey Miron, a Boston University economist who prepared a survey on rent control for the coalition, made the same case in policy terms. "There's nothing in the way rent control was set up to insure that it's needy people who get units," he said. "There is no means testing." On bumper stickers and yard signs, the message was shorter: a house in black and white under a red legend that read "Get Gov't Out."
The tenant side argued about displacement and about who would decide. A Cambridge tenant told the Monitor the Rent Control Board had intervened when her landlord wanted to raise the rent substantially. "How can you ask someone who brings home $800 a month to pay $800 in rent? It's baffling. If rent control is voted out, I don't have any hope."
"The ballot question dumps a lot of people out of their housing summarily as of January," said the Cambridge mayor, Kenneth Reeves. The Monitor's next sentence noted that he probably would not be one of them. Reeves earned $43,000 and lived in a $400-a-month controlled apartment, which Yes supporters cited as their example.
Steve Meachem, of the coalition fighting the question on the No side, answered the complaints about bureaucracy. "The Rent Control Board has loosened up a lot in favor of property owners," he said. Patricia Cantor wrote about the campaign from the tenant side in Shelterforce. According to her, the No committee, which defended rent control, chose after focus group research to stress how losing rent control would affect elderly tenants, especially in Boston.
The two campaigns were not evenly funded, by Moncreiff's reading of the filings. The Yes committee raised and spent more than $1 million.
Of the Yes committee's money, "about 75 percent of the contributions amounted to $300 or less," Moncreiff wrote, but "the real estate industry probably accounted for more than 75 percent of the dollars." The Cambridge-based opponents appear, by his reading, to have raised and spent less than $200,000. Of all the state's newspapers, only The Boston Globe and The Patriot Ledger opposed the question.
The vote Cambridge lost
On November 8, 1994, Question 9 passed with 1,034,599 votes for and 980,736 against, about 51% to 49% of those who answered it. Voters outside the rent-control cities carried it. Middlesex County, which contains Cambridge, voted yes by 280,810 to 232,126.
Jillson had said the outside vote should not surprise anyone. About 75% of the people who signed the petition to put rent control on the ballot came from outside the Boston area, she told the Crimson that August. In Cambridge itself, rent control was, in the Monitor's words the day before the vote, "perhaps the most powerful symbol of this left-wing city."
The repeal did not take effect right away. A Superior Court judge blocked the ballot results, because the question summaries had been left off the ballot. Then Appeals Court Justice Christopher J. Armstrong kept the hold in place for Question 9 alone.
The Crimson's editorial board argued in December that "Question 9 should be allowed to take effect as called for under state law." On December 27 the Supreme Judicial Court ruled that leaving the summaries off had been acceptable. Even so, the injunction against Question 9, the court order keeping it from taking effect, stayed in force through the end of the legislative session.
At a council meeting on December 12, Reeves called it "an emergency." He predicted that "30,000 people in Cambridge are not just going to wait for the landlord to evict them" and would begin planning to move. Gov. William Weld had vetoed the city's home-rule petition to exempt Cambridge from the vote. "I don't think the Governor gives a damn about the tenants of Cambridge," said Councillor Timothy J. Toomey Jr.
The legislature passed a narrower transition law in the last hours of its lame-duck session in early January 1995, and Weld signed it. Cantor, writing from the tenant side, called it "the real estate industry law that killed rent control in Cambridge, Boston, and Brookline."
Under that law, disabled, elderly and low-income renters stayed under control for one or two years, depending on the building. During that time, landlords could raise their rents 5% a year. For everyone else, controls ended that January, two months after the vote.
Who was living in the controlled apartments?
The Yes campaign's central claim was that rent control unfairly benefited affluent tenants, and the first test of it came within a year. In early 1995 the Rent Control Board invited tenants who qualified for the transition law's protection to file for "protected status." Of about 16,200 units controlled at the end of 1994, tenants in 1,523, or 9.4%, had done so by December 31, 1995, according to board records reported by Moncreiff.
Moncreiff, who as a councillor in 1970 had voted for rent control, gave two readings of that number. The income limits were strict: $21,550 for a tenant living alone and $30,800 for a family of four. Many eligible tenants, he wrote, may not have bothered because rents rose modestly at first. He also wrote that the low figure gave "credence to the assertion of opponents of rent control that it had become an entitlement program for middle- and upper-income tenants."
Other measures point the other way. A 1998 survey commissioned by the City of Cambridge found that tenants who had stayed in formerly controlled units earned on average $35,650 in 1997, against $43,630 for tenants of market-rate units and $41,340 for newcomers to formerly controlled units. Sims, working from the American Housing Survey, calculated that 67% of residents of controlled units in Boston, Brookline and Cambridge were in the bottom half of the income distribution. He also found that Black residents were underrepresented in those units.
The two figures count different things. The 9.4% counts the tenants who filed for a status with strict income limits. The city survey compares the average earnings of tenants who stayed with those of their market-rate neighbors, and the stayers earned less.
When the protection ran out
The protection itself ran out at the end of 1996 for about 1,500 Cambridge households. The same week, in Boston Housing Court, Judge E. George Daher urged a landlord and 11 tenants facing increases of 45% to 91% to settle. "You can't just make that Herculean jump," he told the Associated Press. "Can't you have some sort of gradation, a slow increase of rents?"
For tenants of the formerly controlled apartments, the change arrived in the rent. How much did their rents move, compared with tenants who had never been under control?
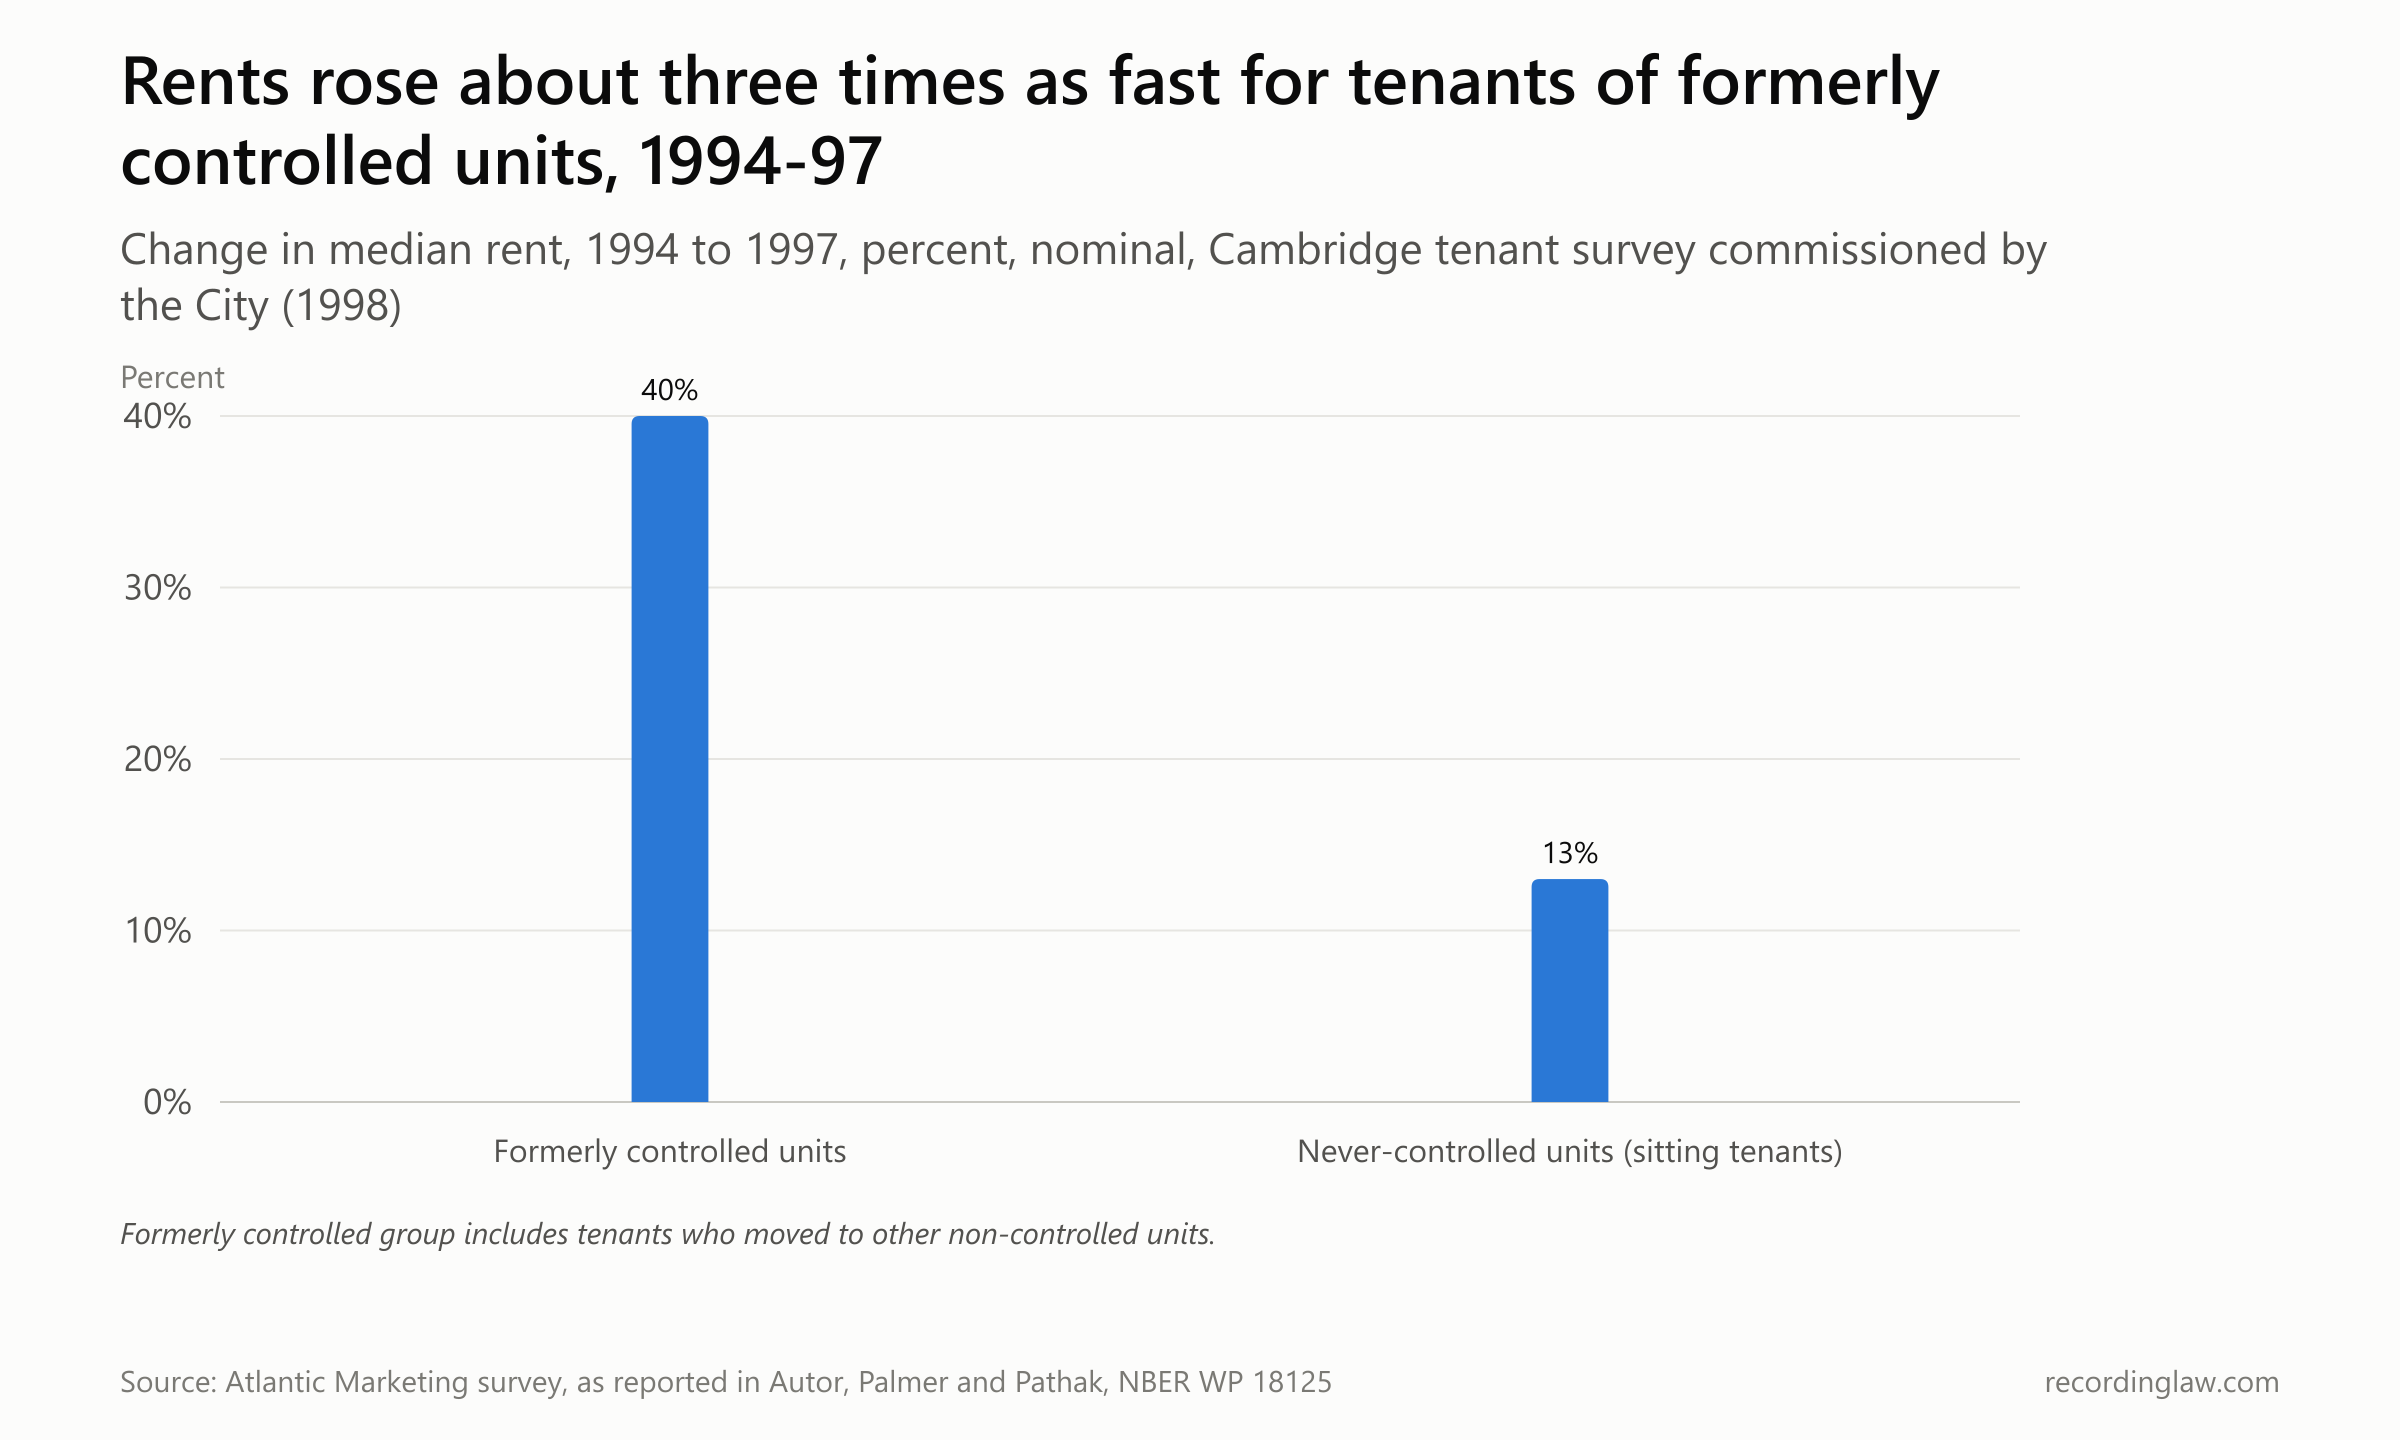
Source: 1998 Atlantic Marketing Research survey commissioned by the City of Cambridge, as reported in Autor, Palmer and Pathak, NBER Working Paper 18125 (2012).
| Tenant group, Cambridge | Nominal median rent change, 1994 to 1997 |
|---|---|
| Tenants of formerly controlled units (stayed, or moved to other non-controlled units) | +40% |
| Sitting tenants of never-controlled units | +13% |
Each survey figure is the change in a group's rent at the median, the middle value when all are lined up in order. The survey is one city's count. Across the Massachusetts towns the ballot decontrolled, Sims estimated an average rent increase of $84 a month from 1993 to 1998, in 1998 dollars, 21% over an average monthly rent of $398.
The households in formerly controlled apartments also changed. Using city voter-registration books from 1991 to 2000, keyed by address, the economists found that turnover at formerly controlled units rose 4 percentage points relative to never-controlled units in 1995. The gap is counted in percentage points, the plain difference between two percentages (from 10% to 12% is two points).
Three years later the gap was 10 points, and it stayed there through 2000. Averaged over the years after repeal, the difference was 5.4 points.
The data cannot say where those residents went or why each one left. They show that the households living in formerly controlled apartments changed faster after 1994 than the households in the rest of the city. That turnover matters for the value gain, because the economists trace the gain mainly to the change in who lived on each block.
Fixing up the buildings, or changing the neighbors?
One explanation for the jump in values is that owners started fixing up buildings they could now rent at market rates. Did permitted spending on homes rise enough to account for it?
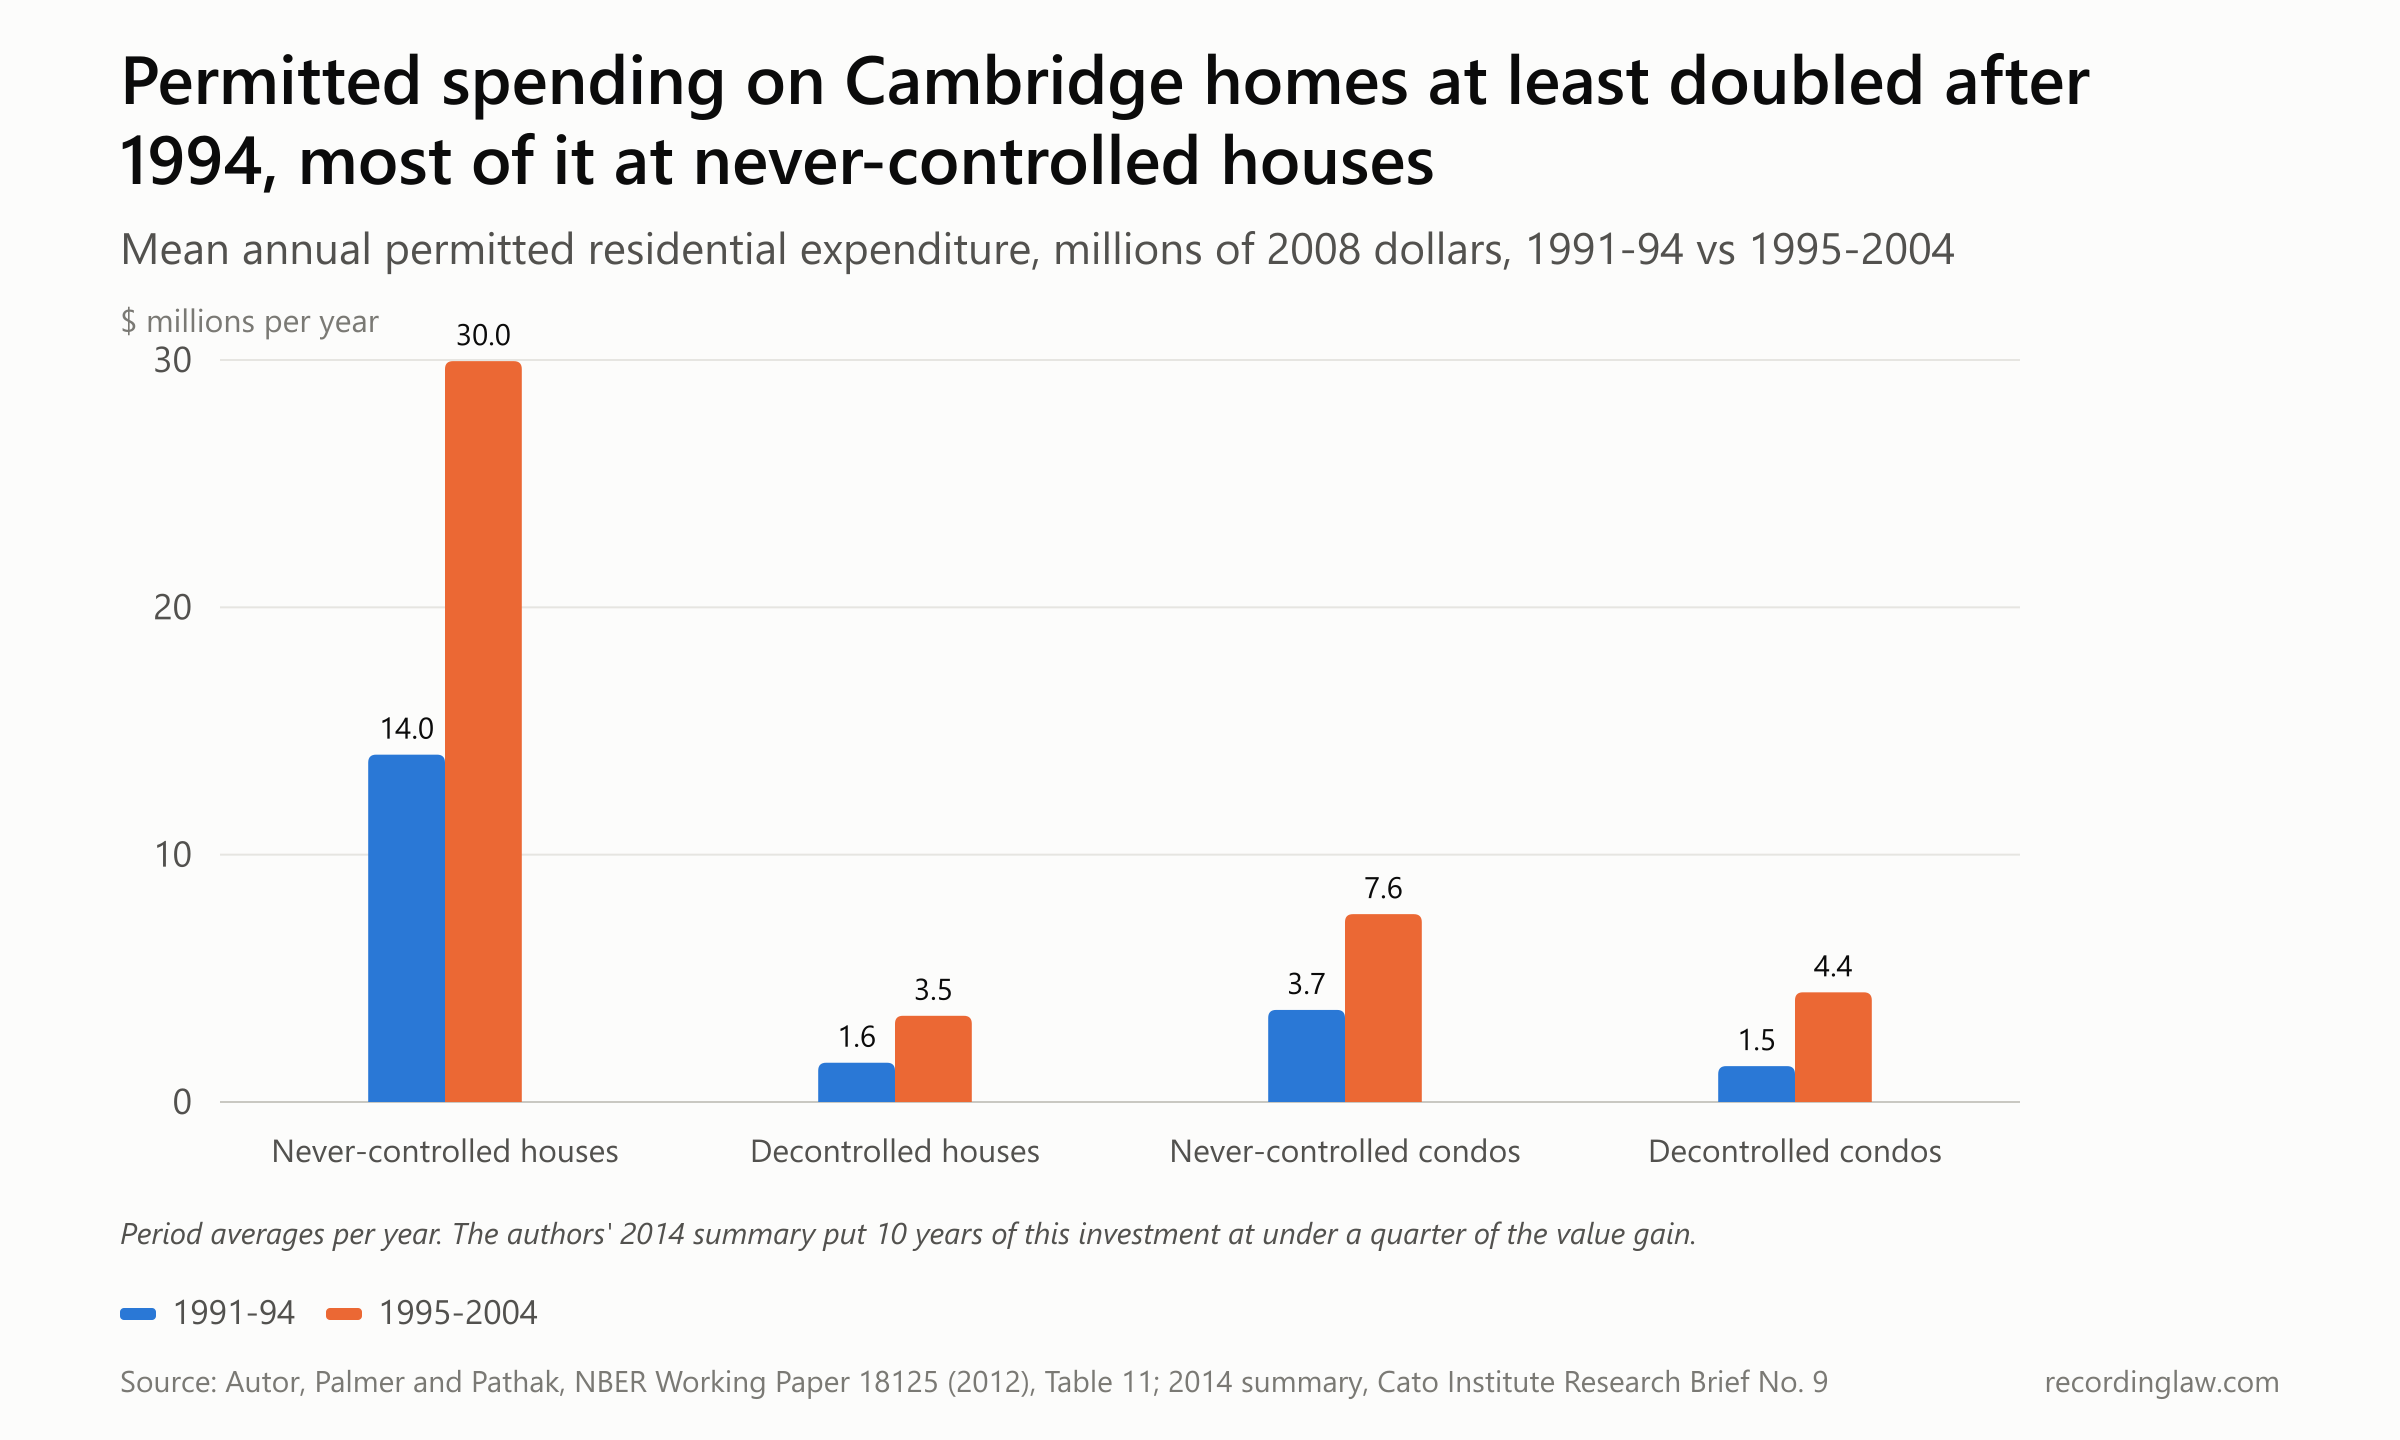
Source: Autor, Palmer and Pathak, NBER Working Paper 18125 (2012), Table 11. Period averages, not annual values.
| Property group | 1991-94, $ millions a year (2008 dollars) | 1995-2004, $ millions a year (2008 dollars) |
|---|---|---|
| Never-controlled houses | 14.044 | 29.954 |
| Decontrolled houses | 1.588 | 3.486 |
| Never-controlled condominiums | 3.723 | 7.595 |
| Decontrolled condominiums | 1.451 | 4.435 |
| Total | 20.8 | 45.5 |
Permitted spending at least doubled in every group, from about $21 million a year before repeal to $45 million a year after. Most of the money went into houses that had never been controlled.
It was still small next to the value gain. The total value of Cambridge residential investments over those 10 years, the authors wrote in their 2014 summary, "was less than one-quarter as large as the estimated increase to Cambridge residential housing values induced by rent-control removal." The working paper concluded that "the allocative rather than the investment channel is the more important explanation." In plain terms, the change in who lived in the neighborhoods mattered more, in their reading, than the spending on the buildings.
A later paper by the same economists measured one of those changes. Using Cambridge police incident data from 1992 to 2005, they estimated that decontrol cut overall reported crime by 16%, about 1,200 crimes a year, mostly property crime. They estimated that this drop in crime accounted for about 15% of the value growth they attributed to decontrol.
The authors put a price on the policy and then set it beside Cambridge's own vote. The findings, they wrote in 2012, "imply that the efficiency costs of Cambridge's rent control policy were large relative to the size of the transfers made to residents of controlled units." In the next sentence they noted that most Cambridge voters chose to keep it, so "the median Cambridge voter perceived the benefits of rent control to exceed the costs."
The study's main comparison is inside Cambridge, between blocks with more and fewer controlled units, with nearby cities as a check. That design separates the repeal from a boom across the whole city or region. It cannot rule out every other change that reached the neighborhoods dense with rent control in those years.
Jillson, now executive director of the Harvard Square Business Association, credits both the repeal and the Kendall Square biotech boom for the city's financial turnaround. "Then when rent control went away, as well as the advent of Kendall, with all the biotech, we now have a city," she told the Crimson in 2025.
Cambridge after control
Within a year, rent control had nearly dropped out of Cambridge politics. The 1995 platform of the Cambridge Civic Association, which had backed rent control, did not mention it, Moncreiff wrote, and an attempt to restore it through a 1996 statewide ballot measure "expired with no more than a whimper."
In November 2003, nine years after repeal, Cambridge voted on a home-rule petition to bring rent control back. Passage required yes votes from a third of the city's registered voters, the Crimson had noted. The petition drew 7,218 votes in favor, short of the 18,809 it needed, with 11,010 against, Cambridge Day reported. The city that voted 58% to keep rent control in 1994 voted about 60% against restoring it in 2003.
The housing stock changed shape too. The number of condominiums in Cambridge rose 32% in the decade after rent control ended, according to Autor, Palmer and Pathak. The spillovers they measured, gains in value that came from nearby units being decontrolled, were "large, precise, and robust for houses" but "not as consistent for condominiums."
The next push for rent limits came from Boston. Its mayor, Michelle Wu, sent the legislature a 2023 home-rule petition to cap yearly rent increases at inflation plus 6%, up to 10%. The bill, H.3744, stayed in the Joint Committee on Housing until September 2024, when it was sent to a study order, which ends a bill for the session.
The 2026 cap fight, and the Cambridge study's return
Rent control's next statewide test was a cap on increases, not a ban. Homes for All Massachusetts gathered signatures for a 2026 initiative that would have capped rent increases statewide at inflation or 5%, whichever was lower. Five polls compiled by Ballotpedia from November 2025 to May 2026 found support between 56% and 69%.
Through November 5, 2026, committees supporting the cap reported $753,862 in contributions, mostly in-kind. Opponents reported $458,234, most of it from three real estate groups: NAIOP Massachusetts, the Greater Boston Real Estate Board and the Massachusetts Association of Realtors.
The Cambridge study came back into the argument. In March 2026 the Center for State Policy Analysis at Tufts University projected that the cap could cut Massachusetts property values by 14% over a decade, about $300 billion. The report was commissioned by the Greater Boston Real Estate Board, which opposed the measure.
GBH News reported that its author, Evan Horowitz, based it on two studies, of St. Paul, Minnesota and of Cambridge. Carolyn Chou, executive director of Homes for All, called it "premature" to reach a determination on property values.
The governor opposed the cap. Gov. Maura Healey said in March that it had "already halted housing production in our state." The Small Property Owners Association, the group that organized the 1994 repeal, opposed it too. Its president, Amir Shahsavari, said in May, State House News Service reported, that a cap of 5% or inflation, whichever was lower, was "not enough for us to keep up with expenses, and therefore housing falls into disrepair and problems ensue for both tenants, owners and other stakeholders."
On June 23, 2026, the Supreme Judicial Court took the question off the ballot without reaching rent control at all. The petition exempted facilities operated solely for religious purposes. "Because of this exemption, we conclude that the petition 'relates to religion, religious practices or religious institutions,' an excluded matter under art. 48 of the Amendments to the Massachusetts Constitution," Justice Frank Gaziano wrote for a unanimous court. Article 48 is the part of the state constitution that sets the rules for ballot initiatives.
The Attorney General, whose office had certified the question, said afterward: "We acknowledge we got it wrong and will continue to work diligently to meet our obligations in the ballot question process." Greg Vasil, CEO of the Greater Boston Real Estate Board, said the religion issue had been "an absolute glaring, blinking red light." Chou said, "So we were struck down on a technicality."
The two campaigns drew opposite lessons from the ruling. "While we disagree with the court's interpretation, the issue raised by the court is easily fixable, and doesn't affect the substance of our proposal," said Noemi Ramos, chair of Keep Massachusetts Home, the Yes campaign for the cap. Opponents of the cap, in Housing for Massachusetts, said the decision "puts the issue to rest and protects our housing pipeline and our communities from the proven damage that rent control inflicts."
Healey and Lt. Gov. Kim Driscoll had hosted negotiations between the two sides, with NAIOP at the table, CommonWealth Beacon reported. It wrote that the ruling halted those compromise talks and "essentially guarantees the status quo will remain in place."
Who decides next time
The 1994 ban, which voters in Cambridge, Boston and Brookline rejected, remains Massachusetts law. One proposal would let those places choose for themselves. S.1447, Sen. Patricia D. Jehlen's "Act enabling cities and towns to stabilize rents and protect tenants," was reported favorably by the Joint Committee on Municipalities and Regional Government on July 13, 2026, and sent to the Senate's Ways and Means committee.
The legislature's site listed no later action on it as of November 10, 2026. Its House companion, H.2328, filed by Representatives Rogers of Cambridge and Montaño of Boston, went to a study order on August 13, 2026, which ends it for the session.
Under the legislature's joint rules, formal business in the session's second year had to end by July 31, 2026, apart from narrow exceptions such as conference reports and veto overrides. The two-year session ends in early January 2027. A bill still pending then would have to be filed again in the next session, in the filing window that opens when the new legislature convenes that month. Supporters of the 2026 cap have said the court's objection is fixable, but we found no announcement of a new filing for the 2028 ballot as of November 10, 2026.
Edward Crane predicted in 1970 that Cambridge would never get rid of rent control. It took the votes of the whole state to do it, over the city's 58% no. In 2026, explaining his opposition to a new statewide cap, House Speaker Ron Mariano told reporters there had already been a statewide vote on the issue, more than 30 years earlier.
How we measured
The economic study, and which version. The value, rent, turnover and permit figures come from David Autor, Christopher Palmer and Parag Pathak, "Housing Market Spillovers: Evidence from the End of Rent Control in Cambridge, Massachusetts." Unless labelled otherwise, figures are from NBER Working Paper 18125 (June 2012), the version we could read in full.
The peer-reviewed version appeared in the Journal of Political Economy 122(3), June 2014, pages 661 to 717. We could not read its full text, so 2014 figures come from the journal abstract (via RePEc) and from the authors' own summary in Cato Institute Research Brief No. 9 (September 2014). Where the two differ (total effect $1.8 billion vs $2 billion; direct effect on formerly controlled units $567 million vs $300 million, within a working-paper total of $770 million there including spillovers; total appreciation $7.7 billion in the brief and $7.8 billion in the abstract), we show both and prefer the published version for headline figures.
How the versions split the gain at formerly controlled buildings. The working paper put $770 million there, spillovers from nearby decontrolled units included, of which $567 million was the direct effect of decontrol. The version published in the Journal of Political Economy in 2014, as the authors summarized it that year, put the "direct effect" at $300 million and assigned $1.7 billion to indirect effects, meaning gains that came from nearby units being decontrolled, $1.1 billion of it at never-controlled units.
By our subtraction, that leaves about $600 million of indirect effect at the formerly controlled buildings, or about $900 million there in all. That $0.9 billion is the 2014 formerly controlled bar in the first chart; it equals the $2 billion total minus the $1.1 billion at never-controlled properties.
Method. The study compares Cambridge properties by "rent-control exposure," the share of residential units within 0.20 mile that were controlled, before and after 1994, using assessed values (with sale prices from 1988 to 2005 as a robustness check). Nearby Somerville, Malden and Medford serve as comparisons.
The design attributes differential appreciation to decontrol. It cannot rule out every Cambridge-specific change in the same years. Assessed values are the main outcome, not sale prices. The study's controlled-unit discount is "about 50 percent" in the working paper and "about 45-50 percent" in the 2014 summary.
Per-house arithmetic. "Roughly $100,000 a house" is the working paper's 2004 assessed value of never-controlled houses with and without decontrol ($7.3 billion minus $6.5 billion, so $0.8 billion) divided by 7,426 houses, about $108,000. The inputs are rounded to a tenth of a billion, so we round the result.
Rents and turnover. The 40% and 13% rent changes are nominal medians from a 1998 Atlantic Marketing Research survey commissioned by the City of Cambridge, as reported in the working paper; we did not find its sample size. The formerly controlled group includes tenants who stayed and tenants who moved to other non-controlled units. "About three times as fast" is 40 divided by 13.
Sims (Journal of Urban Economics, 2007) used the American Housing Survey for 1993 to 1998 across decontrolled Massachusetts towns; we read his figures only as reported by Autor, Palmer and Pathak. Turnover comes from city voter-registration books, 1991 to 2000, keyed by address; the working paper gives the year-by-year differential only as a plotted figure, so we report the points stated in its text.
Permits. Permitted residential spending is from working-paper Table 11, in 2008 dollars, as averages per year over two periods of different length (four years and 10 years). The four groups total $20.8 million a year in 1991-94 and $45.5 million a year in 1995-2004, matching the paper's "$21 million" and "$45 million."
Crime. The crime estimate is from the authors' NBER Working Paper 23914 (2017), published in AEA Papers and Proceedings in 2019, using Cambridge police incident data from 1992 to 2005. We read the working-paper abstract.
Votes. The 1994 Question 9 totals are the official Secretary of the Commonwealth results (yes 1,034,599, no 980,736, blank 216,870); percentages and the 53,863-vote margin are our arithmetic. Moncreiff's history prints slightly different totals (1,034,594 to 980,723). We use the official figures.
Local counts: Cambridge yes 13,309 and no 18,631; Boston yes 57,308 and no 65,195; Brookline yes 9,188 and no 11,689; Middlesex County yes 280,810 and no 232,126. The 2003 Cambridge count comes from a Cambridge Day editor's update; we did not open the city clerk's record.
Sources with a side. Moncreiff (New England Journal of Public Policy, 1996) voted for rent control as a councillor in 1970 and wrote largely from the accounts of Yes-campaign leaders. His campaign-finance figures are his reading of state filings. Patricia Cantor (Shelterforce, 1995) wrote from the tenant side.
The authors published that summary of the journal article as a 2014 Cato Institute research brief. The editor of that series was Jeffrey Miron, the economist who had prepared a survey for the Yes committee in 1994. The brief itself is the authors' own text.
The Tufts projection was commissioned by the Greater Boston Real Estate Board; we read GBH News's account of it, not the report. The 2026 polling and campaign-finance figures are Ballotpedia's compilations.
What comes next. S.1447 had no recorded action after July 13, 2026, on the legislature's site as of November 10, 2026. The 194th General Court's two-year session ends in early January 2027. A local-option bill would have to be filed again in the next session's filing window, which opens when the new legislature convenes that month.
What the data cannot show. No public annual series of Cambridge assessed values for the 1990s was available to us, so we could not chart values year by year. The record does not say where departing tenants went, how their housing costs changed after they left, or how the city's income mix would have moved without repeal.
The official 1994 voter guide arguments were not available online. All dollar figures are nominal unless marked as 2008 or 1998 dollars.
Frequently Asked Questions
When did rent control end in Cambridge, Massachusetts?
Massachusetts voters approved Question 9, the statewide ballot question to end rent control, on November 8, 1994. Controls ended in January 1995. A transition law kept disabled, elderly and low-income tenants under control through the end of 1995 or 1996, depending on the building, with rent increases of 5% a year allowed.
How did Cambridge vote on the 1994 rent control ban?
Cambridge voted against the ban, 18,631 to 13,309, about 58% to 42%. Boston and Brookline also voted no. The measure passed statewide 1,034,599 to 980,736.
How much of Cambridge was under rent control before 1994?
Roughly a third of Cambridge homes were controlled, according to economists David Autor, Christopher Palmer and Parag Pathak, and the share often passed 60% in neighborhoods with older housing. Citing research by economist David Sims, they wrote that controlled units typically rented 25% to 40% below nearby uncontrolled ones (more than 40% in their 2014 summary).
What happened to property values after Cambridge ended rent control?
Economists David Autor, Christopher Palmer and Parag Pathak estimated, in the published 2014 version of their study as they summarized it, that decontrol added $2 billion to Cambridge residential values from 1994 to 2004. That was about a quarter of total appreciation, and most of it was at properties that had never been controlled. Their 2012 working paper put the total at $1.8 billion.
Did rents go up after rent control ended in Cambridge?
A survey commissioned by the City of Cambridge found that nominal median rents rose 40% from 1994 to 1997 for tenants of formerly controlled units. For sitting tenants of never-controlled units, they rose 13%. Across the decontrolled Massachusetts towns, economist David Sims estimated an average increase of $84 a month, 21%, from 1993 to 1998.
Is rent control legal in Massachusetts now?
No. The 1994 statewide ban remains in force. A 2026 ballot question to replace it with a statewide cap was removed by the Supreme Judicial Court on June 23, 2026. A local-option bill, S.1447, which would enable cities and towns to stabilize rents, was in Senate Ways and Means as of November 10, 2026.
Why was the 2026 Massachusetts rent control question removed from the ballot?
The Supreme Judicial Court ruled unanimously in Cella v. Attorney General that the petition's exemption for facilities operated solely for religious purposes made it relate to religion, a subject the state constitution excludes from the initiative process.
Who funded the Cambridge rent control study?
The 2012 working paper thanks the Alfred P. Sloan Foundation, the Lincoln Institute for Land Policy, the National Science Foundation and the Rappaport Institute for Greater Boston. The authors also summarized the published results in a 2014 Cato Institute research brief.
Updates
Corrected: the methods note said "the two groups" total $20.8 million and $45.5 million a year in permitted spending. Those are the totals of all four property groups, one for 1991-94 and one for 1995-2004.
Restructured as a feature: chart titles state the finding, side details moved to How we measured. Every figure and quote was re-checked against its source.
Independently fact-checked against the cited primary sources
Independently fact-checked against the cited primary sources
Sources and References
- Autor, Palmer and Pathak, "Housing Market Spillovers: Evidence from the End of Rent Control in Cambridge, Massachusetts," NBER Working Paper 18125 (June 2012)(nber.org)
- NBER Digest, "The End of Rent Control in Cambridge" (October 2012)(nber.org)
- Autor, Palmer and Pathak, Journal of Political Economy 122(3): 661-717 (2014), abstract via RePEc(ideas.repec.org)
- Autor, Palmer and Pathak, "Housing Market Spillovers," Cato Institute Research Briefs in Economic Policy No. 9 (September 2014)(cato.org)
- Autor, Palmer and Pathak, "Gentrification and the Amenity Value of Crime Reductions: Evidence from Rent Deregulation," NBER Working Paper 23914 (2017)(nber.org)
- Massachusetts Secretary of the Commonwealth, 1994 Question 9 results by municipality(electionstats.state.ma.us).gov
- Massachusetts Secretary of the Commonwealth, 1994 Question 9 results by county(electionstats.state.ma.us).gov
- Robert P. Moncreiff, history of the 1994 Question 9 campaign, New England Journal of Public Policy 12(1) (1996)(scholarworks.umb.edu)
- Patricia Cantor, Shelterforce No. 80 (March/April 1995)(shelterforce.org)
- Christian Science Monitor, "Bay State to Decide Rent Control's Fate" (November 7, 1994)(csmonitor.com)
- Christian Science Monitor, "Landlords In Mass. Fight Rent Control" (November 29, 1993)(csmonitor.com)
- Harvard Crimson, rent control debate (August 5, 1994)(thecrimson.com)
- Harvard Crimson, "While You Were Away" (October 19, 1994)(thecrimson.com)
- Harvard Crimson editorial, "Stop Thwarting the Will of the People" (December 9, 1994)(thecrimson.com)
- Harvard Crimson, "Mayor Miffed on Rent Control" (December 13, 1994)(thecrimson.com)
- Harvard Crimson, rent protections expire (January 3, 1997)(thecrimson.com)
- Harvard Crimson, Boston rent control petition (April 6, 2023)(thecrimson.com)
- Harvard Crimson, profile of Denise Jillson (May 7, 2025)(thecrimson.com)
- History Cambridge, Skip and Lenore Schloming Papers finding aid(historycambridge.org)
- Cambridge Day, 2003 home-rule petition and result(cambridgeday.com)
- MASSterList, "Back to the future on rent control" (December 18, 2025)(massterlist.com)
- GBH News, Tufts rent control report (March 12, 2026)(wgbh.org)
- Ballotpedia, Massachusetts Rent Control Initiative (2026)(ballotpedia.org)
- Cella v. Attorney General, Supreme Judicial Court of Massachusetts (June 23, 2026)(courtlistener.com)
- CBS Boston, SJC rent control ruling (June 2026)(cbsnews.com)
- CommonWealth Beacon, "Mass. high court strikes rent control question from ballot" (June 23, 2026)(commonwealthbeacon.org)
- Massachusetts Legislature, S.1447 (194th General Court)(malegislature.gov).gov
- Massachusetts Legislature, H.2328 (194th General Court)(malegislature.gov).gov
- Harvard Crimson, "Voters To Decide on Rent Control" (November 4, 2003)(thecrimson.com)
- Massachusetts Legislature, H.3744 (193rd General Court), Boston rent stabilization home-rule petition, bill history(malegislature.gov).gov
- Massachusetts Legislature, Joint Rules, Rule 12A (formal business)(malegislature.gov).gov
- National Law Review, "Rent Control is Removed from the November Ballot, What Next?" (July 21, 2026)(natlawreview.com)
- State House News Service, "Small Landlords Warn Massachusetts Rent Control Ballot Measure Will Leave Them Underwater" (Fall River Reporter, May 16, 2026)(fallriverreporter.com)