Market Rents Rarely Reached Oregon's Rent Cap From 2019 to 2025. A Study Estimates People in Covered Buildings Moved Less

Independently fact-checked against primary sources (last audited November 9, 2026). · 28 primary sources cited on this page. How we verify our legal content
The Oregon Senate's housing committee took up Senate Bill 608 on February 4, 2019, in a committee room OPB described as packed. The hearing stretched on for more than four hours. Before the vote, Sen. Girod, a Republican who strongly opposed the bill, "threw his pen on the dais and left the room," the Portland Mercury reported.
Two pieces of written testimony filed for that hearing made the same prediction from opposite sides. Deborah Imse was executive director of Multifamily NW, a landlord trade group whose members provide more than 250,000 rental homes by its own count. She warned that rent caps leave low-income households to "become stuck in their existing units." Katrina Holland, executive director of the Community Alliance of Tenants, wrote that families "may be better able to save and stay put as they prepare to buy their first homes."
Oregon passed the bill that month. Gov. Kate Brown, who signed it on February 28, called it "the country's first statewide rent control bill."
The law limited most rent increases to 7 percent plus inflation, a figure that worked out to about 10 percent a year. Buildings under 15 years old were exempt.
Market rents rarely reached that line. Zillow's rent index tracks market rents in each metro area, including rents on new leases, which the cap does not limit. We checked it for Oregon's five largest metro areas in each year from 2019 to 2025, which makes 35 metro-years, one for each metro in each year. The index rose by more than that year's cap in 6 of them, all in 2020 or 2021.
The only study we found that was built to measure the law's effect looked at moving instead. It was published in July 2026. It compared how much households moved in buildings the cap covers and in newer buildings the law exempts, before and after the law. It estimated that moving in the covered buildings fell 11 to 27 percent relative to the pre-law baseline, measured against the newer, exempt buildings.
Its author wrote that the findings "reveal unintended consequences for housing supply and tenure composition," meaning who rents versus owns. The abstract we read does not give its supply evidence. Less moving is the outcome Imse and Holland both predicted, one calling it harm and the other stability.
If market rents so seldom reached the cap, what did it change? What each side promised and warned in 2019 can be set against seven years of rent, moving and building numbers. The question is current. Washington adopted a cap built the same way in 2025, and on January 1, 2027, Oregon and Washington both begin a year with their caps at 10 percent.
What each side said would happen
The law set no rent. It capped how much a landlord could raise the rent each year on a tenant who stayed, and in most cases it left the rent for a new tenant to the market. It also barred no-cause evictions of month-to-month tenants after 12 months.
One of its chief sponsors, House Speaker Tina Kotek, a Portland Democrat, called it rent stabilization and pitched it as something other than rent control. "Today's conversation is about predictability and stability for tenants so they can plan for their futures," she told the Senate committee in written testimony. The bill, she wrote, "is not your grandparents' rent control."
Rep. Mark Meek, a Clackamas County Democrat, put it more briefly on the House floor. "This is not the rent control of yesteryear," he said. "It's a smart, innovative hybrid."
Supporters made two promises that numbers can test. Sen. Laurie Monnes Anderson, a Gresham Democrat who co-carried the bill in the Senate, said, "I believe it will help people stay in their homes, without diminishing the supply of rental housing in the state." The House Democratic caucus said on signing day that the law "will provide predictability and stability to renters throughout the state, while not discouraging new construction."
One of the Senate's chief sponsors, Majority Leader Ginny Burdick, spoke as an owner. "As a landlord myself, I understand the need to raise rents over time," she wrote, adding that the bill provided "the flexibility needed for good landlords to continue renting their properties."
Opponents warned about the same two things, with the signs reversed. "The likely outcome from this legislation is fewer affordable housing units and increased rent throughout the state," said Sen. Tim Knopp, a Bend Republican.
Randall Pozdena, a housing economist who told the House committee he had been paid by no one for his views, predicted that "Landlords will also accelerate rental price increases above what otherwise would have occurred." Some hearing witnesses, OPB reported, "warned the bill would result in landlords raising the rent at 7 percent each year."
Not every landlord group fought the bill. The Oregon Rental Housing Association, a landlord group with 14 local chapters that Willamette Week said "helped kill" a 2017 tenant bill, stayed neutral. Its legislative director, Jim Straub, testified that there was "a lot here for landlords to dislike" but that the bill was not "an industry killer."
The fear he named was about the future. "Most of my and my fellow landlords' fears regarding rent stabilization are that once established it will become a one way ratchet, opening the door for more stringent restrictions in the future," he wrote.
A third warning came from the other direction. Tenant organizers said the cap was too high to protect anyone. Margot Black of Portland Tenants United told the Mercury, "The bill does more to protect landlords from tenant protections than vice versa."
Sen. Shemia Fagan, the committee chair who carried the bill, said she would have supported a lower cap. "But this is what we were able to negotiate," she said.
The Senate passed SB 608 on February 12, 2019, by 17 votes to 11, and every yes vote came from a Democrat. The House followed on February 26, by 35 votes to 25, with three Democrats voting no. Brown signed it two days later, and it took effect that day.
Did rents ever reach the cap?
In Oregon's five largest metros, the market crossed the line only during the pandemic rent run-up of 2020 and 2021. In every other year their indexes ran below the line, and from 2023 on well below it.
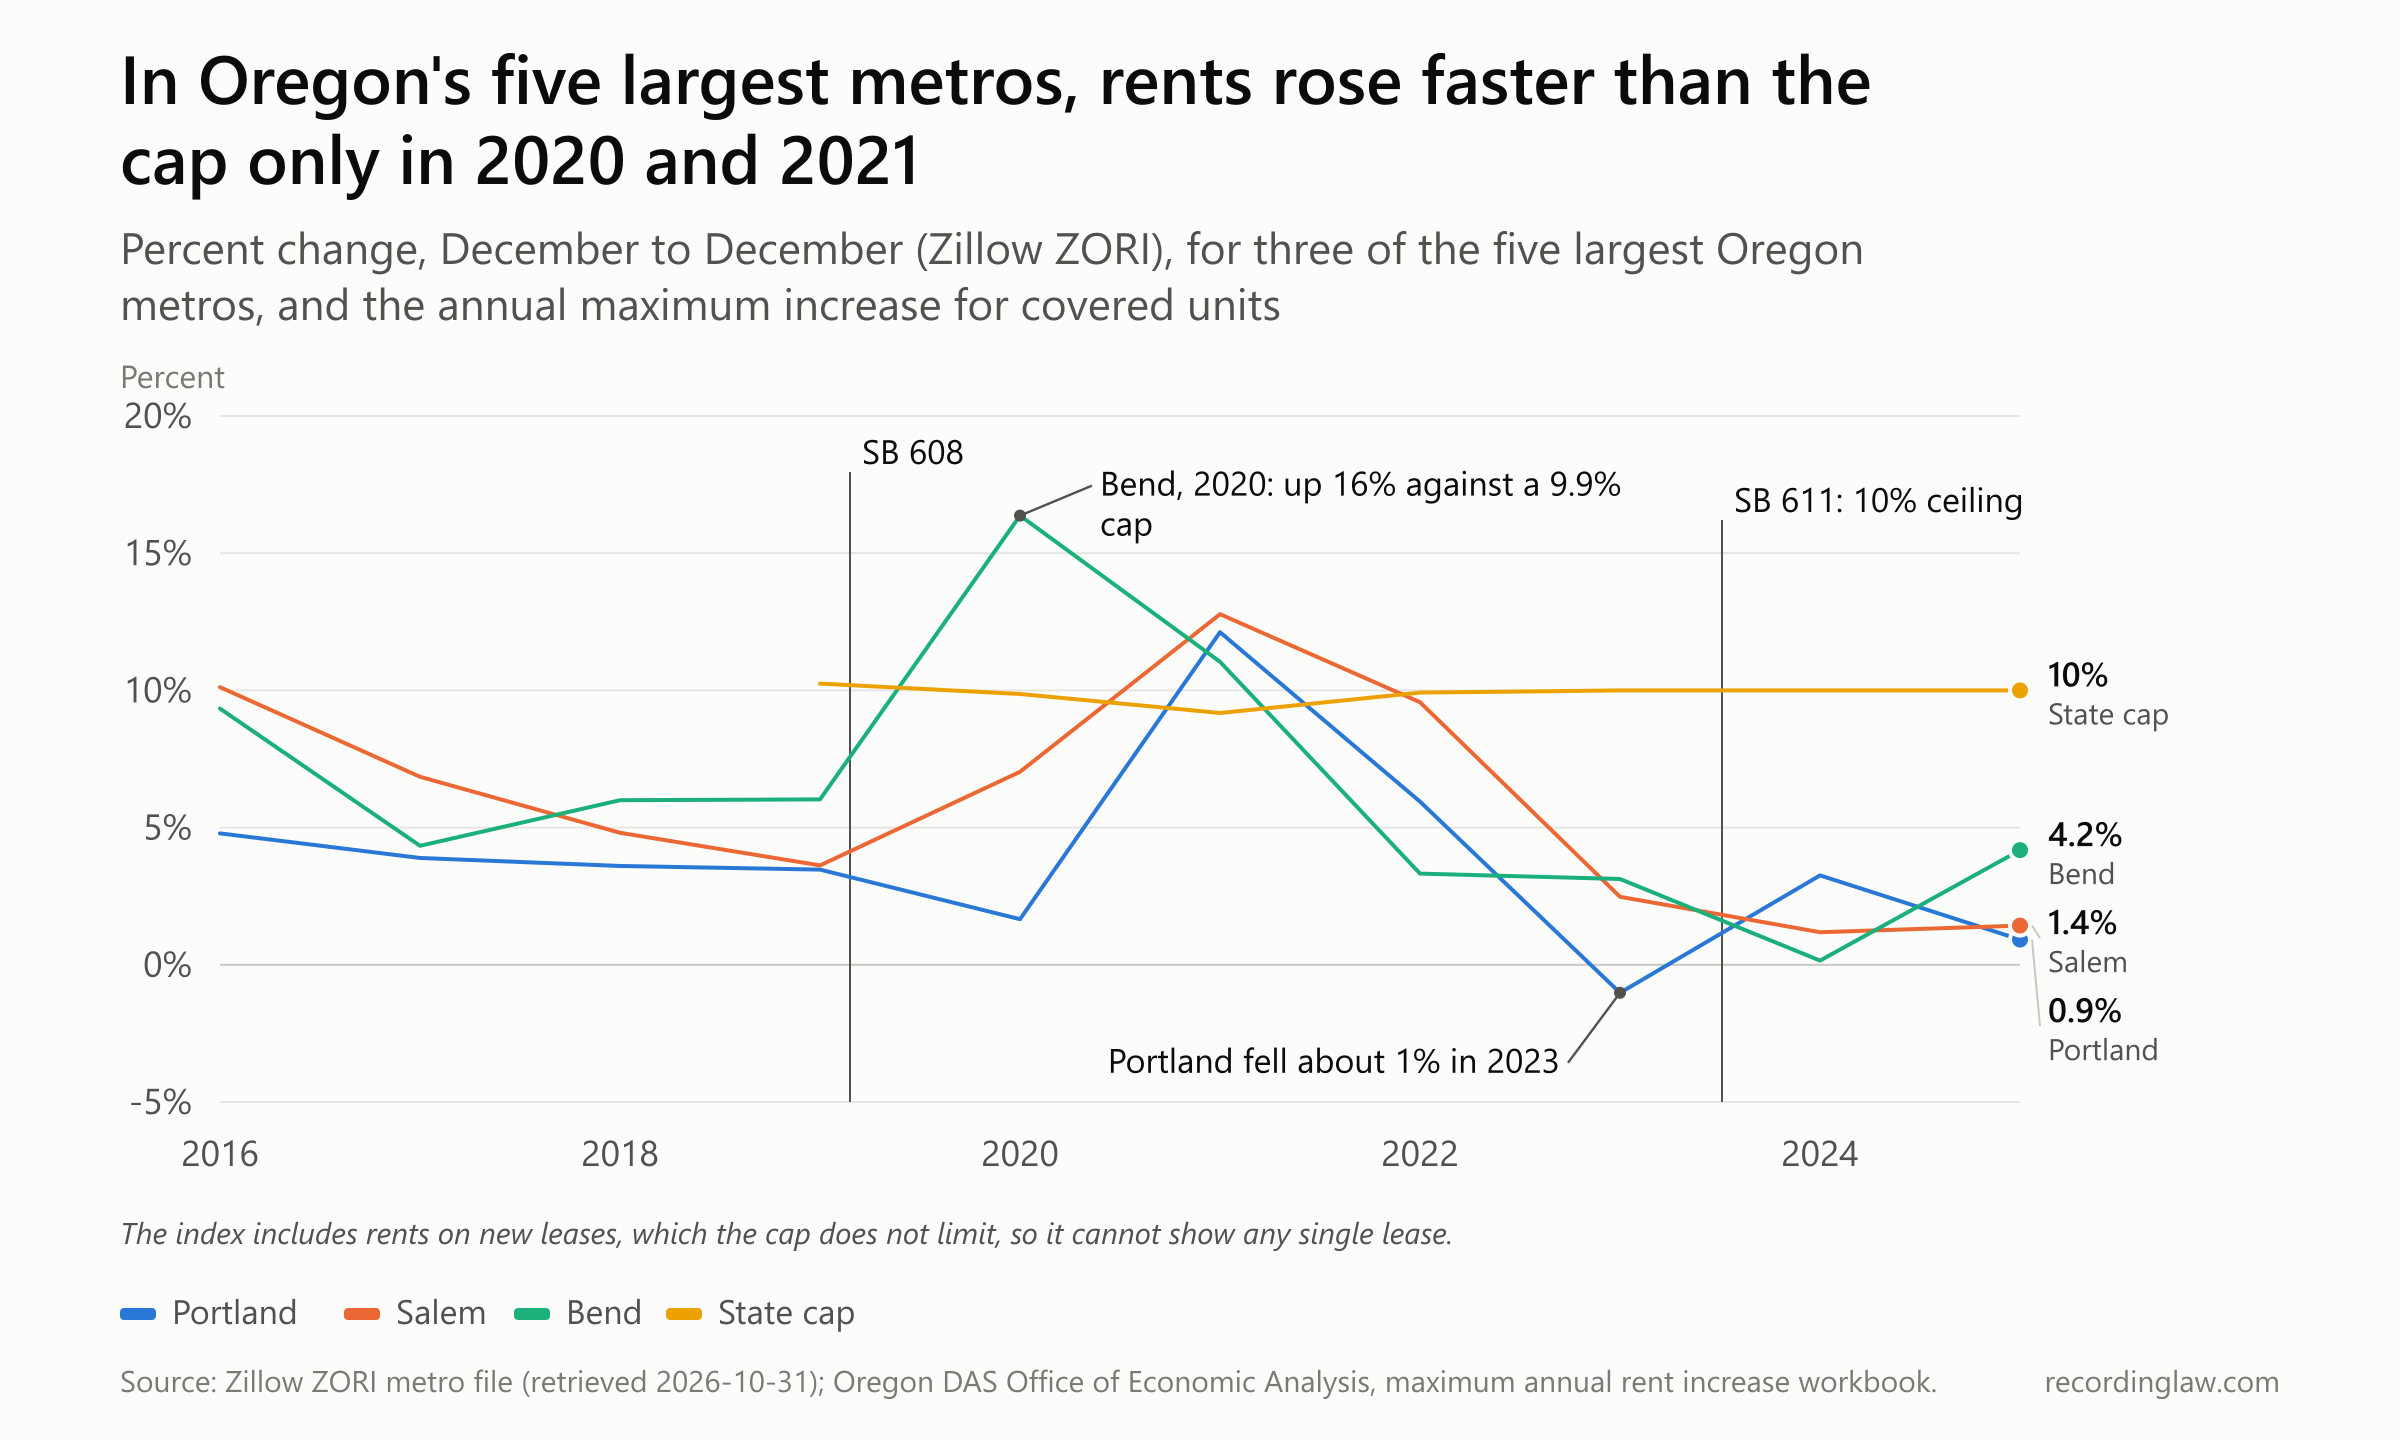
Source: Zillow ZORI metro file (retrieved October 31, 2026); Oregon Department of Administrative Services, Office of Economic Analysis, maximum annual rent increase workbook. Three of the five largest Oregon metros are drawn; all five are in the table.
In 2020, Bend's index rose 16 percent and Medford's rose about 10 percent. Both were above that year's cap of 9.9 percent.
In 2021, the indexes for Portland, Salem, Eugene and Bend all rose faster than the 9.2 percent cap, and Salem's rose by nearly 13 percent. That is two metros in 2020 and four in 2021, the 6 metro-years above the cap.
| Year | Cap (%) | Portland (%) | Salem (%) | Eugene (%) | Bend (%) | Medford (%) |
|---|---|---|---|---|---|---|
| 2019 | 10.25 | 3.47 | 3.62 | 4.44 | 6.03 | 6.74 |
| 2020 | 9.87 | 1.66 | 7.03 | 7.37 | 16.37 | 10.18 |
| 2021 | 9.18 | 12.12 | 12.78 | 12.11 | 11.04 | 6.01 |
| 2022 | 9.92 | 5.95 | 9.57 | 9.05 | 3.32 | 3.76 |
| 2023 | 10.00 | -1.02 | 2.48 | 1.30 | 3.13 | 3.88 |
| 2024 | 10.00 | 3.26 | 1.19 | 3.93 | 0.15 | 4.77 |
| 2025 | 10.00 | 0.92 | 1.43 | 4.27 | 4.18 | 3.49 |
December-to-December change in ZORI. The 2023 cap is the 10.0% that applied from July 6, 2023; notices before that date could use 14.6%.
Zillow's Observed Rent Index (ZORI) is a smoothed, market-wide measure of rents in a metro area. It includes rents on new leases, which the cap does not limit. It is not the increase on any one lease, so it cannot show whether a landlord exceeded the cap. It can show whether the market as a whole was moving faster or slower than the line the law drew.
Zillow also publishes indexes for 14 smaller Oregon metros, most starting in 2021 or later. Two of them, Corvallis and Albany, rose faster than the cap in 2022, by 13.0 and 12.7 percent. Corvallis also rose 14.7 percent in 2021, above that year's 9.2 percent cap.
In 2023, 2024 and 2025, none of the five largest metros' indexes rose more than 5 percent in a year. Portland's index fell about 1 percent in 2023. Over the six years from December 2019 to December 2025, Portland's index rose about 25 percent in total, to $1,757 a month.
The gap was visible before the vote. Willamette Week put the question in print a month earlier. "If landlords aren't freaking out, does that mean the rent cap is too generous to them?" it asked, and answered that average Oregon rents "have increased a lot more slowly over the past eight years than the maximum rent increase allowed under Senate Bill 608."
Reason, published by the libertarian Reason Foundation, reported an estimate from the Portland consultancy ECONorthwest. By that estimate, "only 5 percent of buildings in Portland increased rents above what would be allowed by SB 608 in 2018," compared with 25 percent in 2015 and 2016. SB 608 was not yet law in 2018, so the estimate set past rent increases against the limit the bill proposed. Reason also noted a limit built into the bill: "There are no vacancy controls in SB 608, meaning that landlords would be able to raise rents an unlimited amount once a tenant moves out."
Oregon's Office of Economic Analysis, which calculates the cap each year, later ran the formula back to 2000. It found the maximum "would have been around 10% each year," as OPB reported. In the office's figures, that back-calculated cap ranges from 7.1 percent in 2010 to 11 percent in 2002.
In 2019, the first year the law applied, the cap was 10.3 percent. In dollars, Portland's typical rent on Zillow's index that December was $1,410 a month, so a 10 percent increase came to $141.
By 2022 a state economist and the landlord group that had fought the 2019 bill said much the same about the averages. Josh Lehner, a senior economist in the state office that calculates the cap, wrote in 2022 that "overall market rents rarely move at the maximum allowable amount," adding that "a larger increase likely strains more household budgets." Renee Larson, board president of Multifamily NW, said that year, "this rent cap formula means very little on the ground when it comes to determining rental prices," and "Since the implementation of the law, we have not seen average rent increases even come close to the maximum."
The averages do not settle what happened lease by lease. In 2023, Rep. Kim Wallan, a Medford Republican, said the 2019 law caused many landlords to raise rent by the maximum each year, as the Oregon Capital Chronicle reported.
Multifamily NW cited a survey of its own members, covering 86,589 units at 1,231 properties. In that survey, "average rents went down" in the period before the 2021 cost-of-living increase. Neither claim can be checked against lease-level data, because no public source we found records how many renewals came in at or near the cap.
Outside the 2020 and 2021 run-up, then, the cap sat above the market average in the five largest metros. Then, in September 2022, inflation pushed the formula's result for 2023 well above 10 percent.
The year the formula hit 14.6 percent
The formula tied the cap to inflation. SB 608 allowed one increase a year, capped at 7 percent above the change in consumer prices. That change is measured by the Consumer Price Index (CPI) for the western states, published by the U.S. Bureau of Labor Statistics. The state uses its 12-month average change as of September.
In 2022 inflation spiked. On September 13, 2022, the state's economists announced the number for 2023: "The DAS Office of Economic Analysis has calculated the maximum percentage as 14.6%." The cap had been 9.9 percent the year before.
Portland's index in December 2022 was $1,703 a month, and a 14.6 percent increase on that would be about $249 a month. Kim McCarty, executive director of the Community Alliance of Tenants, the tenant group Holland had spoken for in 2019, said the group's hotline was "ringing off the hook with people who are struggling to afford the rent in our uneven economic recovery, and it's about to get so much worse." Neighborhood Partnerships, one of the housing and tenant advocates quoted that week, said "a 14.6% rent increase is effectively an eviction notice" for families already severely burdened by rent.
The governor who had signed SB 608 asked for a change. In 2019, Brown had told OPB the law would "provide immediate relief to Oregonians struggling to keep up with rising rents and a tight rental market, but it doesn't work on its own." Now her office said she was "deeply concerned about the maximum rental increases that will be allowed under Oregon law in 2023." The formula, it said, had been the right move when rent increases were not driving inflation "(and CPI was under 2%)."
The 2023 bill, SB 611, started out going further than the version that passed. As introduced by Sen. Wlnsvey Campos, an Aloha Democrat, it would have capped increases at 8 percent or inflation plus 3 percent, whichever was less. It would also have cut the new-building exemption from 15 years to three. Hundreds of statements for and against were filed before its March 2023 hearing.
Tenant groups backed it. Cameron Herrington of the Oregon Housing Alliance, a coalition of more than 100 member organizations that includes tenant groups and local jurisdictions, testified that "This bill prevents homelessness by establishing a reasonable limit on how much the cost of a tenant's home can be increased in any given year." Alexis Ames of the Community Alliance of Tenants wrote that "landlords would be incentivized to keep their tenants longer, reducing the cost of turnover and vacancies."
Looking back in March 2023, OPB wrote: "At the time, landlords worried it would only be a matter of time before state lawmakers tried to further lower the cap. They were right." It added that what most people could not have anticipated was the inflation spike.
Gary Fisher of Multifamily NW, Imse's landlord group, called rent control "at best a thin band-aid that will not ultimately benefit Oregonians." Tia Politi, president of the Oregon Rental Housing Association, which had been neutral in 2019, testified: "And, of course, landlords will sell. The exodus began in 2019 when SB 608 was passed and will only continue."
What passed was a compromise. Lawmakers kept the 7-percent-plus-inflation formula and the 15-year exemption, and they added a ceiling of 10 percent. The Senate voted 17 to 8. The House voted 32 to 18, with every House Republican opposed.
"This cannot be an either-or approach," said Rep. Andrea Valderrama, a Portland Democrat. "We can protect Oregonians from unreasonable rent increases and fix our housing supply crisis."
"We're going to tell the potential property owner 'We're going to put the screws to you, and make it harder for you to provide housing,'" said Rep. Kevin Mannix, a Salem Republican.
The governor who signed SB 611 on July 6, 2023, was Tina Kotek, the Speaker who had carried SB 608 four years earlier. Her office described the law as one that "Provides predictability and stability for renters by limiting rent increases to no more than 10% each year, while maintaining exemptions for new construction to support housing development." An increase whose notice was given before July 6 could still use 14.6 percent. After that date, the limit was 10 percent.
| Year | Oregon maximum annual increase |
|---|---|
| 2019 | 10.3% |
| 2020 | 9.9% |
| 2021 | 9.2% |
| 2022 | 9.9% |
| 2023 | 14.6% before July 6; 10.0% after |
| 2024 | 10.0% |
| 2025 | 10.0% |
| 2026 | 9.5% |
| 2027 | 10.0% |
Source: Oregon DAS Office of Economic Analysis. 2019 to 2022 unrounded: 10.2523%, 9.8745%, 9.1843%, 9.9190%.
Since July 6, 2023, the 10 percent ceiling has set the cap in every year except 2026. That year the formula came to 9.5 percent, under the ceiling, so the formula set the cap. A study published in July 2026 measured something the rent averages could not show: how much people moved.
Did people in covered buildings move less?
The study turned on the law's line for new buildings. A unit is exempt if its first certificate of occupancy was issued less than 15 years before a rent notice. That certificate is the document that clears a new building for tenants.
The line moves forward with the calendar, so a building ages into the cap in its 16th year. Our Oregon landlord-tenant law guide covers how the rules apply to a tenancy today.
The only study we found that was built to measure the cap's effect used that exemption as a dividing line. Its author, Adi Tarabeih, of the Faculty of Data and Decision Sciences at the Technion in Israel, compared households in buildings the cap covers with households in buildings too new for it, before and after 2019.
The method, which economists call difference-in-differences, asks whether moving changed more in covered buildings than in exempt ones over the same years. The study was published in the Journal of Housing Economics in July 2026. It applies what it calls a rolling-window version of the method to 580,897 household records from the American Community Survey (ACS), the Census Bureau's yearly household survey.
Residential mobility is the study's term for how much households move. The study found that the cap "reduces residential mobility in covered buildings" by 11 to 27 percent "relative to pre-policy baselines." Covered buildings also showed relative increases in homeownership of 5 to 6 percent. The abstract gives no more detail: it does not say whose homeownership rose, or how.
Market averages in the five largest metros topped the cap in only two years. The study still estimated less moving in covered buildings. Its abstract calls the cap "comparatively permissive" and offers a reading of why the effects appeared anyway, "suggesting that landlords and tenants respond to the existence of a stabilization regime even when caps do not immediately bind."
Put plainly, the author's reading is that landlords and tenants change what they do because the cap is on the books, not only in a year when it blocks a particular increase. The abstract does not say what those changes are.
Less moving is the behavior Imse and Holland both forecast in 2019, from opposite sides. The author frames the results differently, as unintended consequences for housing supply and who rents versus owns. The abstract does not give the supply evidence.
Alexis Ames, of the Community Alliance of Tenants, said in 2023 that landlords would keep tenants longer. The study measures how much less people moved. It does not say whether those who stayed were stuck or settled, which is the question the two sides disagreed on.
There are limits to what we could check. We read the study's abstract, not its full text, so the survey years, the controls and the reason the estimate is a range are not confirmed here. SB 608 also limited no-cause evictions after a year, and the abstract does not say how the study separates that rule from the rent cap.
Does a simpler look at the same survey show the pattern? The Census Bureau publishes the survey's household records in a public file, the Public Use Microdata Sample (PUMS). From it we counted recent movers, meaning renter households whose head had moved into the home within the past 12 months. We report them as a share of all renter households.
We split them by the age of their building, because the cap covers older buildings and exempts new ones. We did this for Oregon and for Washington, which had no statewide cap until 2025.
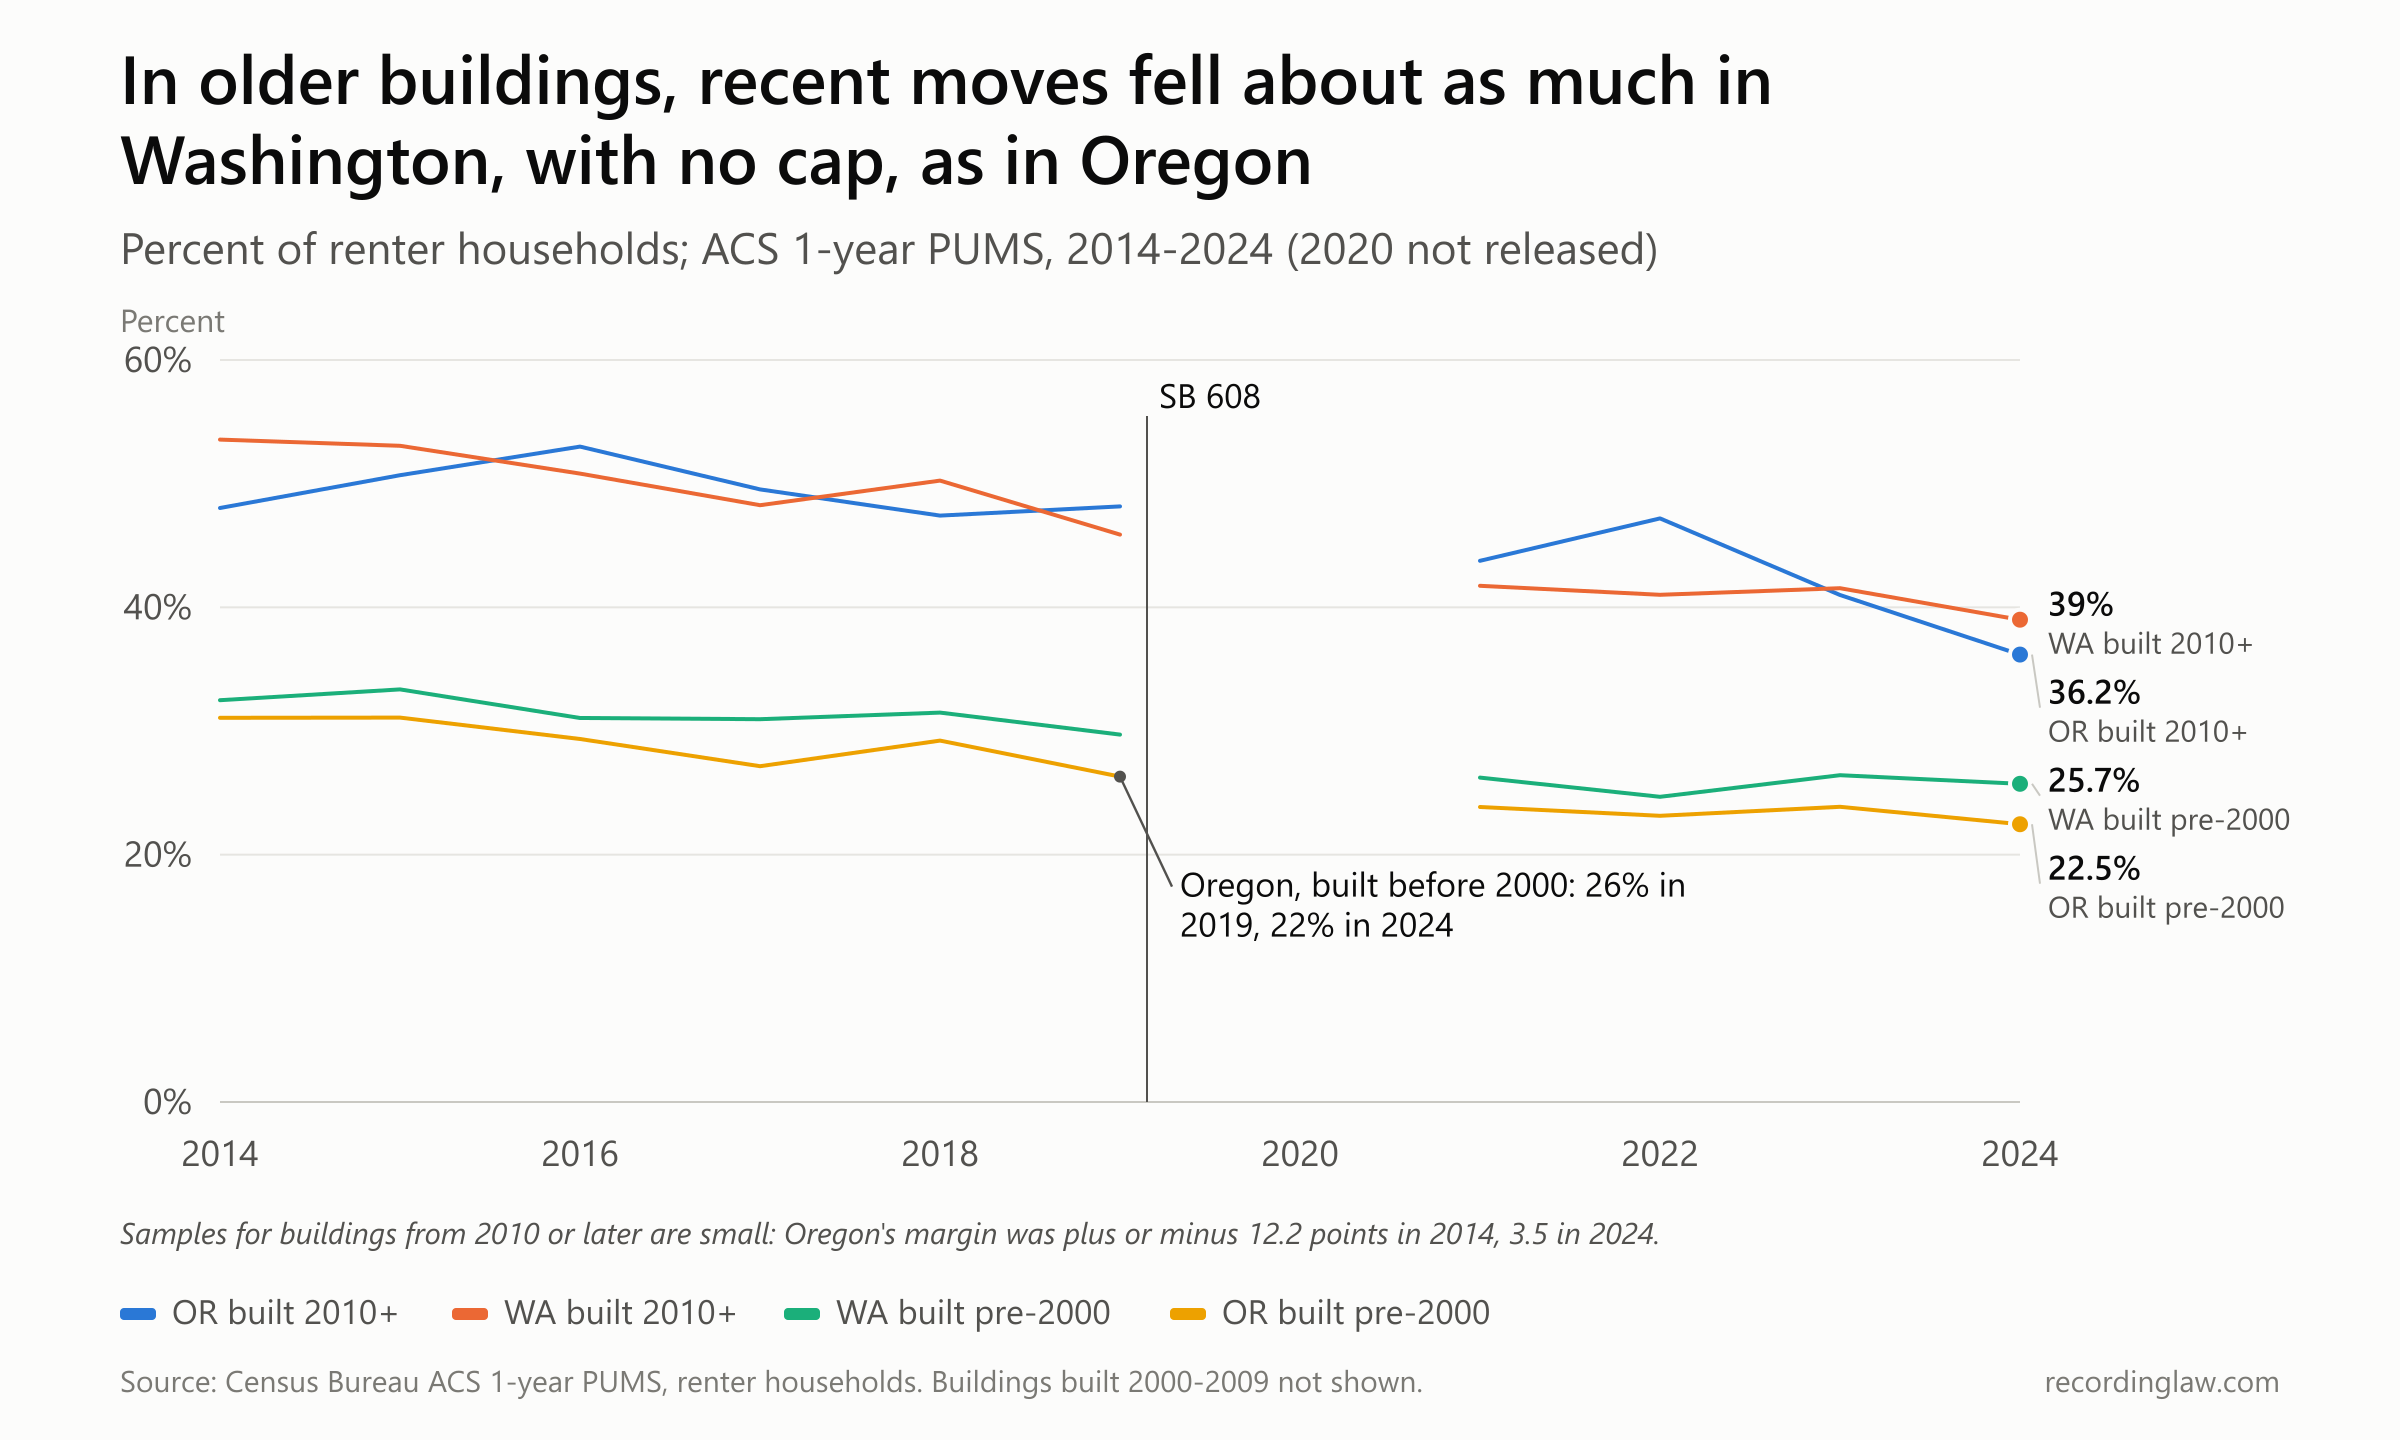
Source: Census Bureau American Community Survey 1-year Public Use Microdata Sample, renter households; recordinglaw.com tabulation. No standard 2020 1-year data was released. Buildings built 2000 to 2009 are not shown.
In this rough cut, the share of recent movers fell in all four groups after 2019. In Oregon buildings built before 2000, which the cap covers, the share fell from 26 percent in 2019 to 22 percent in 2024. In the same group of older Washington buildings, which no cap covered in those years, it fell from 30 percent to 26 percent, nearly the same drop.
Among buildings from 2010 or later, most of them too new for Oregon's cap, the share fell further in Oregon than in Washington. Those samples are small, though, and their margins of error are wide, plus or minus 6.7 points for Oregon in 2019 and 3.5 in 2024.
| Year | OR built before 2000 (%) | WA built before 2000 (%) | OR built 2010 or later (%) | WA built 2010 or later (%) |
|---|---|---|---|---|
| 2014 | 31.06 | 32.49 | 48.03 | 53.56 |
| 2016 | 29.35 | 31.05 | 53.00 | 50.82 |
| 2018 | 29.23 | 31.49 | 47.42 | 50.24 |
| 2019 | 26.31 | 29.71 | 48.16 | 45.88 |
| 2021 | 23.85 | 26.23 | 43.76 | 41.74 |
| 2022 | 23.15 | 24.68 | 47.19 | 41.01 |
| 2023 | 23.87 | 26.43 | 40.99 | 41.54 |
| 2024 | 22.46 | 25.73 | 36.18 | 39.00 |
Share of renter households that moved in within the past 12 months. Margins of error for the 2010-or-later groups are wide (Oregon plus or minus 3.5 points in 2024); see How we measured.
This tabulation cannot test the study. Our building-age groups only approximate the law's 15-year line, which runs per unit from its first certificate of occupancy to the date of each rent notice.
The study uses that line itself to compare covered and exempt buildings before and after the law. A chart of raw shares by our age groups cannot do that. The other half of the 2019 argument was about whether anyone would keep building.
Did building slow down?
The 15-year exemption was the sponsors' answer to that worry. Kotek wrote in 2019 that it was there "to ensure that new construction is not deterred."
Opponents had warned of fewer units and less investment. Knopp predicted fewer affordable housing units. Rep. Jack Zika, a Redmond Republican, asked on the House floor, "Why would anyone invest in a state if the Legislature is prone to tighten restrictions?" Doug Bibby, president of the National Multifamily Housing Council, told HousingWire as the law took effect that "SB 608 will worsen the imbalance between housing supply and demand by allowing for rent control across the state."
Every year the Census Bureau counts permits for new housing units in buildings with two or more units. The count is a public measure of plans to build apartments and other multi-unit housing. The chart below sets each state's 2018 count at 100, so a line at 63 means 63 percent of that state's 2018 count.
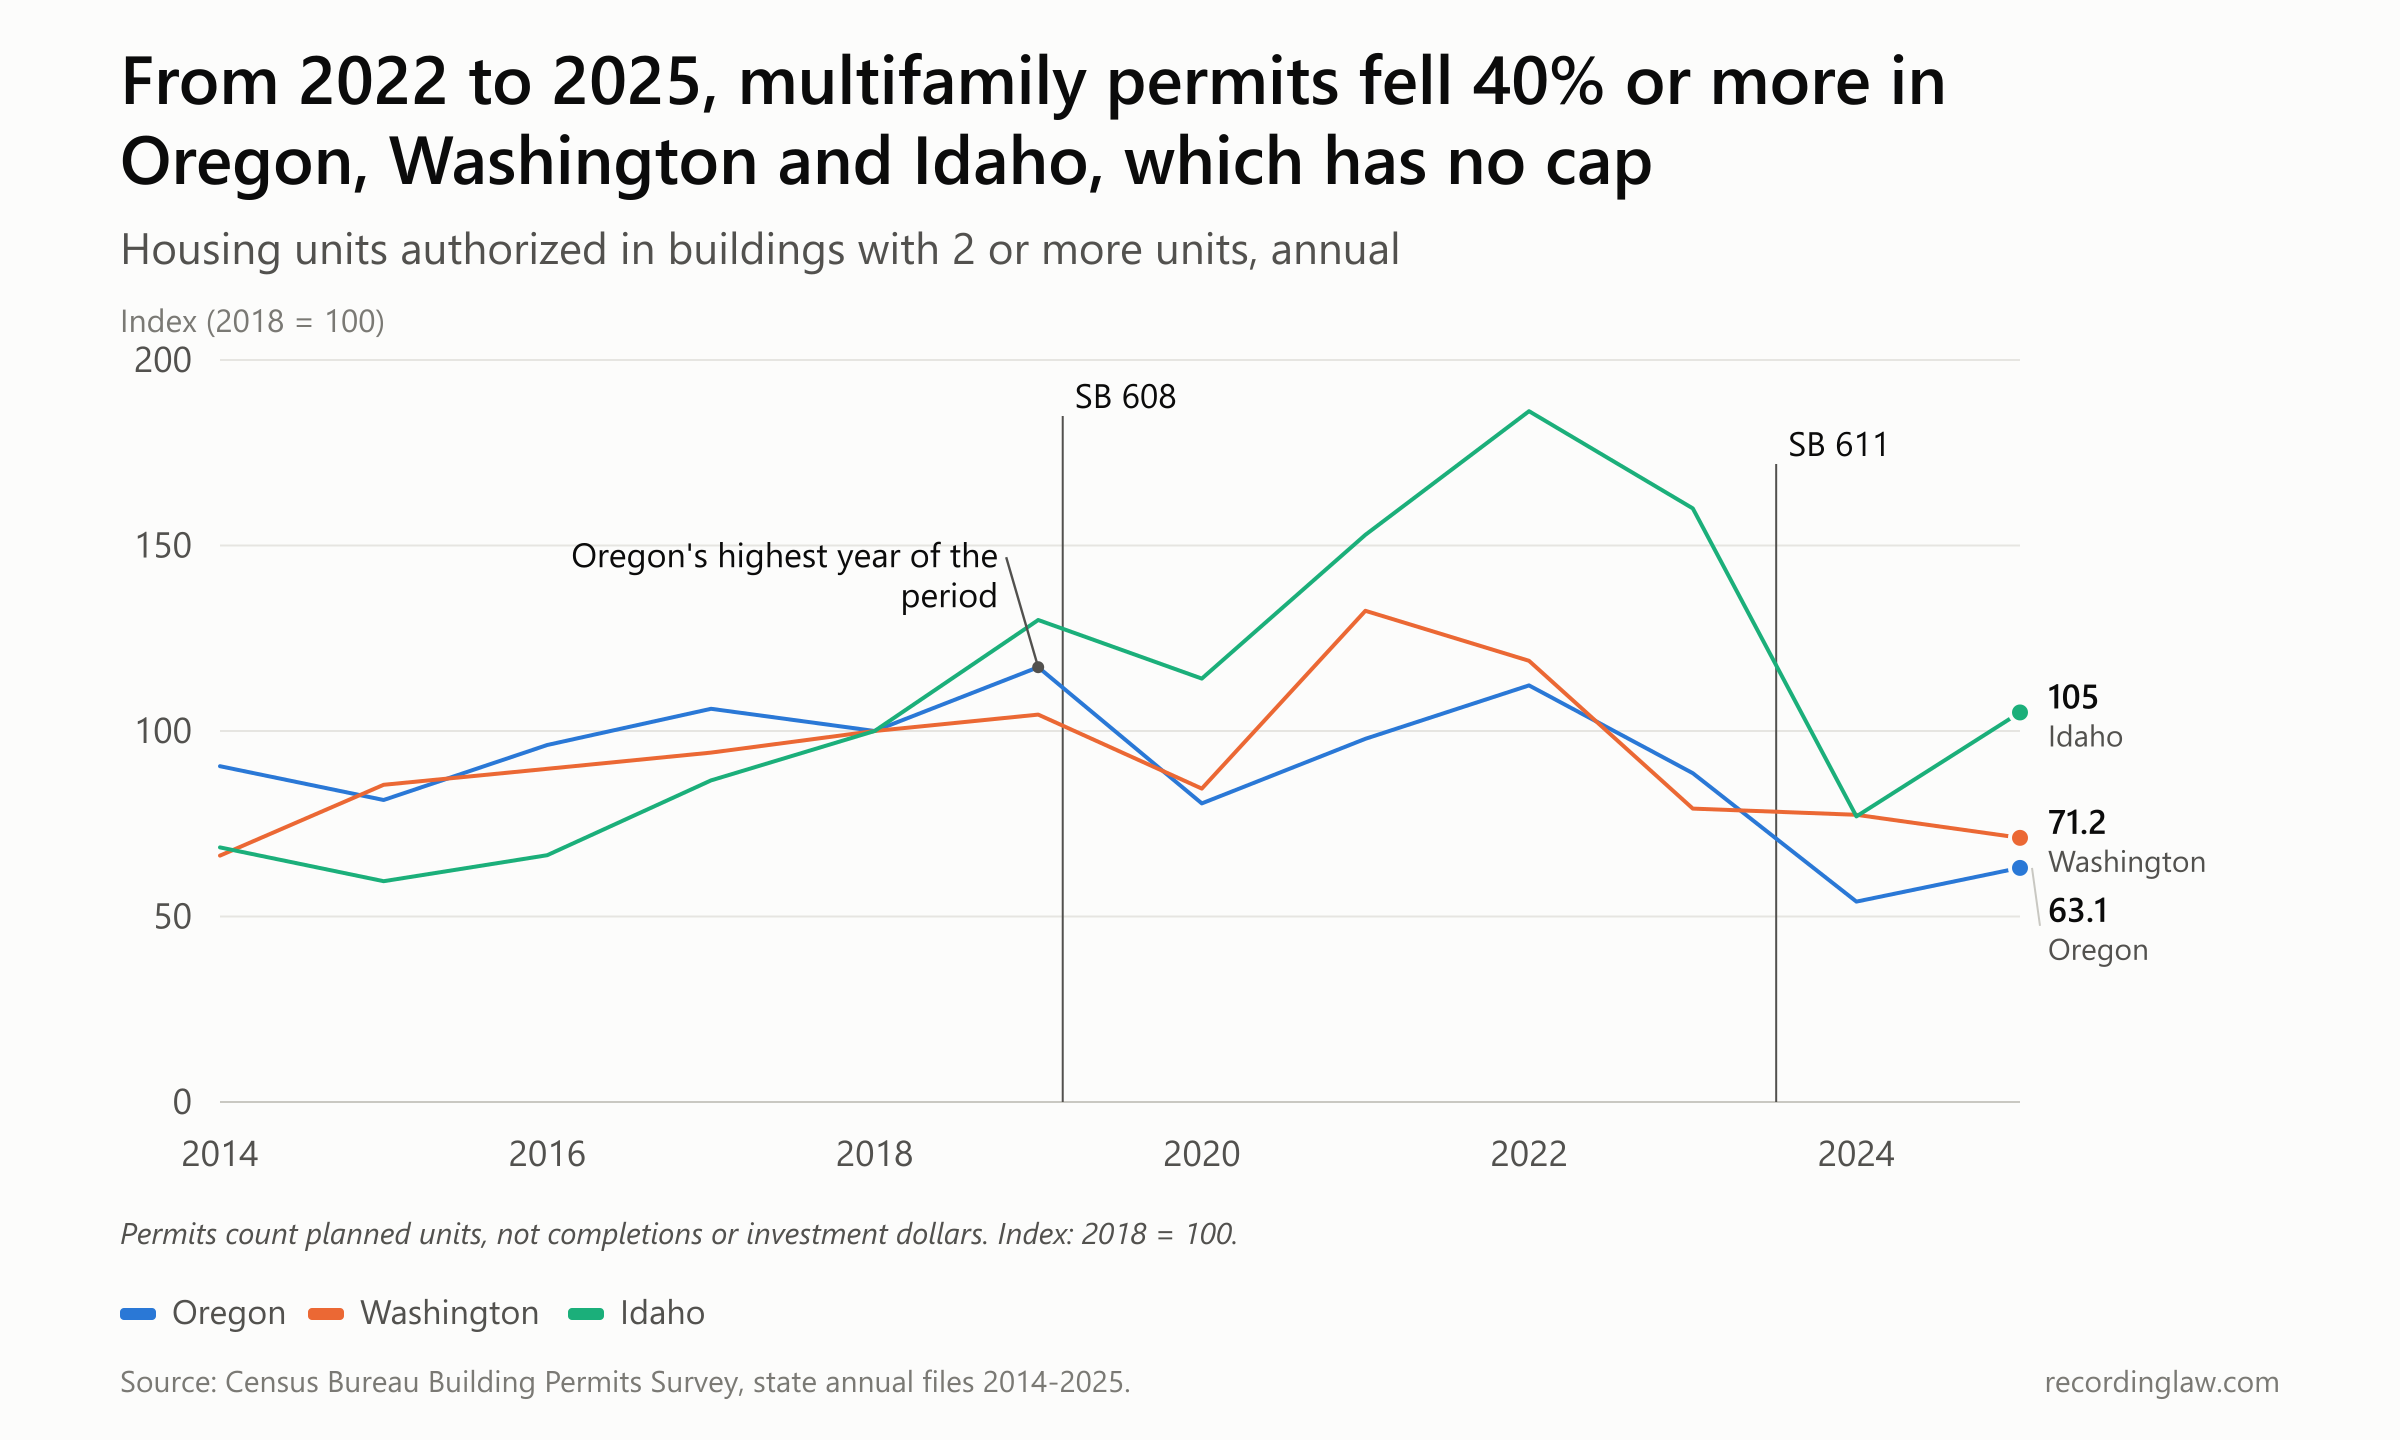
Source: Census Bureau Building Permits Survey, state annual files, units in buildings with 2 or more units. Indexed to 2018 = 100.
Oregon's count in 2019, the year the cap passed, was 10,451 units, the highest of any year from 2014 to 2025. It dropped in 2020 and rose to about 10,000 units in 2022. Then it fell to 4,811 units in 2024 and 5,624 in 2025, a bit more than half the 2019 level.
Each side has pointed to part of that line. In July 2023, Sybil Hebb of the Oregon Law Center, which worked with tenant groups to pass both bills, said, "I don't think there's any evidence to show that passage of [2019 bill] SB 608 led to reduced construction, or reduced investment; in fact I think there's evidence that indicates that 2021, for example, was a banner year for investment in multifamily housing development." Oregon's 2021 permit count, 8,731 units, was below both 2019 and 2022. Permits count planned units, though, not dollars invested.
Imse told House members in June 2023 that a tighter cap would "exacerbate the housing crisis by forcing investors and developers to do business in states that are more serious about relieving the pressure on the rental market."
How far permits fell depends on the starting year. Measured from each state's 2022 level to 2025, multifamily permits fell 44 percent in Oregon, 40 percent in Washington and 44 percent in Idaho, which has no statewide rent cap. Measured from 2019 to 2025, Oregon's drop was the largest of the three. Its permits fell 46 percent, against 32 percent in Washington and 19 percent in Idaho.
| Year | Oregon | Washington | Idaho |
|---|---|---|---|
| 2018 | 8,915 | 24,070 | 3,648 |
| 2019 | 10,451 | 25,124 | 4,738 |
| 2020 | 7,173 | 20,339 | 4,161 |
| 2021 | 8,731 | 31,865 | 5,578 |
| 2022 | 10,009 | 28,630 | 6,794 |
| 2023 | 7,900 | 19,041 | 5,838 |
| 2024 | 4,811 | 18,642 | 2,809 |
| 2025 | 5,624 | 17,133 | 3,832 |
Housing units authorized in buildings with 2 or more units.
The permit counts cannot separate the cap from everything else that changed for builders over those years, starting with the pandemic. Units under 15 years old are not covered by the cap at all.
Measured from 2022, then, all three states lost a similar share of their permits. Measured from 2019, Oregon lost the most, and 2019 was Oregon's highest year of the period.
One of those neighbors was about to change its own rules.
Washington, the state that had not capped rents
In March 2023, as SB 611 was debated, Molly McGrew of Multifamily NW, the landlord group Imse led, held up Washington as the alternative. Oregon's bill "sends a signal to investors that Oregon isn't open for business," she told OPB. "I noticed that Washington state did not pass their rent control law and instead went ahead full speed addressing the supply issues."
Two years later Washington passed one. Gov. Bob Ferguson signed House Bill 1217 on May 7, 2025, at Blake House, "the first affordable high-rise apartment building constructed in Seattle in half a century," as the Washington State Standard described it. The law caps increases at 7 percent plus inflation or 10 percent, whichever is less. That is the same structure Oregon adopted in 2023, though Washington measures inflation with the Seattle-area consumer price index rather than the western-states index.
Washington exempts new buildings for 12 years instead of 15, and its law is set to expire on July 1, 2040. Our Washington landlord-tenant law guide covers the details.
The arguments came back nearly word for word. Sen. Emily Alvarado, a West Seattle Democrat and the law's prime sponsor, called it a "common sense guardrail" that "will protect working families and seniors from excessive rent hikes." Ferguson said, "I'm confident that this legislation is going to work for everybody in our state."
Sean Flynn of the Rental Housing Association of Washington said it put "a big neon sign at the gates of the state of Washington" telling builders to take their money to Austin, Tennessee, Florida or Idaho.
Jay Parsons, an independent consultant and former RealPage chief economist, told Multifamily Dive that most renewal increases, the increases for tenants who stay, were already in the 7 to 10 percent range, and that the law set a precedent. "It definitely adds a lot of risks to future investments," he said. Axios reported that advocacy groups counted Washington as the third state with a statewide rent stabilization law, after Oregon and California.
Both states at 10 percent in 2027
On July 15, 2026, Washington's Commerce Department announced its 2027 cap. The formula came to 11.5 percent, so the 10 percent ceiling applies. On September 28, 2026, Oregon published its own. Inflation of 3.1 percent plus 7 percent came to 10.1 percent, so Oregon's ceiling of 10 percent applies too.
Starting January 1, 2027, renters in covered units in both states face the same maximum increase. In Oregon, 2027 will be the fourth year since 2023 in which the 10 percent ceiling, not the formula, sets the cap. The other three were 2023 (from July 6), 2024 and 2025.
Oregon has kept adjusting the edges. A 2025 law, HB 3054, set a flat 6 percent cap for spaces in manufactured-dwelling parks and marinas with more than 30 spaces, starting in 2026.
Another 2025 bill, SB 722, would have cut the new-building exemption from 15 years to seven. Groups representing real estate and multifamily rental companies said a seven-year exemption "might make it harder for developers to attract investment," and the bill was still in a Senate committee when the session ended. It did not pass.
The next numbers are on the calendar. Washington will publish its 2028 cap shortly after the federal June inflation data come out in mid-July, so around July 2027. Oregon's economists must publish its 2028 cap no later than September 30, 2027.
The Census Bureau released its 2025 one-year survey estimates on October 29, 2026. As of November 8, it listed the release date for the matching microdata files, which our moving tabulation needs, as to be determined.
For the packed February 2019 hearing, Imse and Holland filed opposite readings of the same forecast: renters would move less. Seven years on, one study estimates that households in Oregon's covered buildings did, by 11 to 27 percent relative to the pre-law baseline, measured against newer, exempt buildings. Whether those households were stuck or staying put is the question the two testimonies argued over. The study's estimate of how much less people moved does not settle it.
How we measured
The cap. Annual maximums come from the Oregon Department of Administrative Services' Office of Economic Analysis workbook for 2027 (column E of its Maximum Annual Increase sheet) and its announcements. The formula is 7 percent plus the September 12-month average change in the West Region Consumer Price Index for All Urban Consumers. From July 6, 2023, SB 611 made the cap the lesser of that figure or 10 percent.
DAS says the law first applies in 2019 because of SB 608's emergency clause, which made it take effect on passage; its figures for 2000 to 2018 are illustrative. For 2026, the formula gave 9.4816 percent, published as 9.5 percent. For 2027, the CPI change was 3.1156 percent, so the formula gave 10.1 percent and the ceiling applies. Washington's 2027 formula figure (11.53 percent) is from the Commerce Department.
Rents. Zillow Observed Rent Index (ZORI), metro file, all homes plus multifamily, smoothed, retrieved October 31, 2026 (data through September 2026). Yearly change is December over the previous December.
ZORI is a smoothed, market-wide index. It includes rents on new leases, which the Oregon cap does not limit (Reason: "no vacancy controls"). It also covers the whole market rather than only covered units. So an index reading above the cap is not evidence that a landlord broke the law, and a reading below it does not mean no tenant received the maximum.
"Metro-years above the cap" counts Oregon's five largest metros by Zillow's size rank (Portland, Salem, Eugene, Bend, Medford) in each year from 2019 to 2025, 35 in all, against that year's cap. Zillow also publishes indexes for 14 smaller Oregon metros, most starting in 2021 or later. Corvallis (13.0 percent) and Albany (12.7 percent) rose faster than the cap in 2022, Corvallis (14.7 percent) also did in 2021, and none of the smaller metros topped it from 2023 to 2025.
Dollar examples are arithmetic on ZORI December levels. 10 percent of Portland's $1,410 (December 2019) is $141. 14.6 percent of $1,703 (December 2022) is about $249. And $1,757 (December 2025) over $1,410 is a rise of about 25 percent.
Moving. American Community Survey 1-year Public Use Microdata Sample housing files for Oregon and Washington, 2012 to 2019 and 2021 to 2024; the Census Bureau released no standard 1-year file for 2020. We counted renter households (tenure code 3) whose householder moved in within the past 12 months, weighted with household weights. The 95 percent margins of error come from the 80 replicate weights. Building age uses the year-built variable: "before 2000" and "2010 or later" are the groups that can be defined the same way before and after the Census Bureau changed its coding in 2021.
The 2000 to 2009 group is excluded because it straddles the 15-year line. The law measures the 15 years per unit from its first certificate of occupancy to the date of the rent notice, which survey bins cannot reproduce.
Margins for the 2010-or-later groups are wide. In 2014 they were plus or minus 12.2 points in Oregon and 5.8 in Washington. In 2019 they were 6.7 and 3.8, and in 2024 they were 3.5 and 2.6.
For the pre-2000 groups they are under 2 points. Our tabulation is descriptive.
The study. Tarabeih, "Rolling windows, closed doors: Mobility and tenure effects of Oregon's statewide rent stabilization policy," Journal of Housing Economics (DOI 10.1016/j.jhe.2026.102162), dated July 21, 2026, by OpenAlex. We read the abstract through OpenAlex.
This page relies on the abstract, not the full text, so the survey years, control variables, the source of the 11 to 27 percent range and any funding acknowledgments are not confirmed here. OpenAlex lists no funder.
Permits. Census Bureau Building Permits Survey state annual files, 2014 to 2025: units (not buildings) in 2-unit, 3-to-4-unit and 5-or-more-unit structures, summed. The index divides each year by 2018. Permits are plans, not completions, and they are not a measure of investment dollars.
Claims we could not test. No public source we found records how many Oregon renewals were set at or near the cap, so Rep. Wallan's 2023 statement and Multifamily NW's member survey (which we did not open; it is quoted in the East Oregonian) stand as attributed. No data on landlords selling or leaving the market was opened, so the Oregon Rental Housing Association's 2023 "exodus" statement also stands as attributed. ECONorthwest's 2018 building estimate is reported by Reason and by Willamette Week; we did not open the underlying analysis. On signing day Brown said she had asked the state's housing agency to monitor the law and report back in two years; we did not locate such a report.
What the data cannot show. None of the descriptive series here has a control group that isolates the cap. Over the same years Oregon also limited no-cause evictions (2019), the pandemic disrupted moving and building (2020 and 2021), and inflation peaked (2022). The study is the only source here designed to estimate an effect of the cap, and its estimate applies to mobility and homeownership, not to rents or construction. The abstract says the findings reveal unintended consequences for housing supply but does not quantify a supply effect.
Frequently Asked Questions
What is Oregon's maximum rent increase for 2027?
It is 10% for tenancies covered by ORS 90.323, with the maximum calculated under ORS 90.324. The Oregon Department of Administrative Services published it on September 28, 2026, and it is in effect from January 1, 2027. The formula, 7% plus 3.1156% West Region inflation, came to about 10.1%, so the 10% ceiling applies. Manufactured-dwelling and marina facilities with more than 30 spaces have a separate 6% cap.
What was Oregon's rent cap in 2026?
It was 9.5%. The cap was 10.0% in 2024 and 2025. In 2023 it was 14.6% for increases whose notice was given before July 6, 2023, and 10.0% after that date.
When did Oregon's statewide rent cap start?
Gov. Kate Brown signed Senate Bill 608 on February 28, 2019, and it took effect that day. It allowed one increase a year, capped at 7% plus inflation. It also barred no-cause evictions of month-to-month tenants after 12 months. Senate Bill 611, signed July 6, 2023, added a 10% ceiling.
Which Oregon rentals are exempt from the rent cap?
A unit is exempt if its first certificate of occupancy, the document that clears a new building for tenants, was issued less than 15 years before the date of the rent-increase notice. Some increases in government-regulated affordable units are also exempt: those that do not raise the tenant's portion of the rent or are required by program rules or a change in income. A 2025 bill to cut the exemption to seven years, SB 722, did not pass.
Did Oregon's rent cap lower rents?
The data cannot show that. Zillow's rent index for Oregon's five largest metros rose faster than the cap in 6 of 35 metro-years from 2019 to 2025 (one metro in one year is a metro-year). All 6 were in 2020 or 2021, and in other years the index was below the cap. Two smaller metros, Corvallis and Albany, also topped it in 2022. The index is a market average that includes new leases, which the cap does not limit, and there is no lease-level public data on how many renewals came in at the cap.
Did Oregon's rent cap reduce moving?
A 2026 Journal of Housing Economics study by Adi Tarabeih used the 15-year exemption to compare covered and exempt buildings. It estimated mobility, meaning how much households moved, 11% to 27% lower in covered buildings relative to pre-policy baselines, compared with exempt buildings. It also estimated relative increases in homeownership of 5% to 6% in covered buildings. The author wrote that the findings reveal unintended consequences for housing supply and tenure composition. Our simple tabulation of Census survey data shows recent moves falling after 2019 in both Oregon and Washington. In older buildings, the share fell by similar amounts in the two states.
Did Oregon's rent cap reduce apartment construction?
The permit data cannot separate the cap from other changes. Oregon's permits for multifamily units, in buildings with two or more units, went from 10,451 units in 2019 to 5,624 in 2025. From 2022 to 2025 they fell by about the same share in Oregon, Washington and Idaho, which has no statewide cap. New buildings are exempt from Oregon's cap for 15 years.
Does Washington have a rent cap like Oregon's?
Yes. Washington's HB 1217, signed May 7, 2025, caps increases at 7% plus inflation or 10%, whichever is less. That is the same structure Oregon has used since 2023, though Washington measures inflation with a Seattle-area index rather than the western-states index. New buildings are exempt for 12 years, and the law is set to expire July 1, 2040. Washington's cap for 2027 is 10%.
Updates
Corrected: The FAQ now cites ORS 90.323 as the law the cap applies under, with the maximum calculated under ORS 90.324. The page also notes that Corvallis rose faster than the cap in 2021 as well as 2022, and that the 10% ceiling applied in 2023 from July 6.
Restructured as a feature: chart titles state the finding, side details moved to How we measured. Every figure and quote was re-checked against its source.
Independently fact-checked against the cited primary sources
Independently fact-checked against the cited primary sources
Sources and References
- Oregon Legislature, SB 608 (2019) measure overview and history(olis.oregonlegislature.gov).gov
- Oregon Legislature, SB 608 (2019) enrolled bill(olis.oregonlegislature.gov).gov
- Oregon Legislature, SB 611 (2023) enrolled bill(olis.oregonlegislature.gov).gov
- Oregon Legislature, SB 722 (2025) measure overview(olis.oregonlegislature.gov).gov
- Oregon Legislature, HB 3054 (2025) measure overview(olis.oregonlegislature.gov).gov
- ORS 90.323, maximum rent increase and exemptions (statute text)(oregon.public.law)
- ORS 90.324, annual calculation of the maximum rent increase (statute text)(oregon.public.law)
- Oregon DAS Office of Economic Analysis, Rent Stabilization page(oregon.gov).gov
- Oregon DAS Office of Economic Analysis, Maximum Annual Rent Increase workbook (2027)(oregon.gov).gov
- Oregon DAS, annual maximum rent increase for 2023 (September 2022)(apps.oregon.gov).gov
- Oregon DAS, correction: 2026 rent stabilization percentages(apps.oregon.gov).gov
- Oregon DAS, annual maximum rent increase for 2027 (September 28, 2026)(apps.oregon.gov).gov
- Office of Gov. Tina Kotek, signing ceremony for housing and homelessness bills (2023)(apps.oregon.gov).gov
- Speaker Tina Kotek, written testimony on SB 608, Senate Committee on Housing (February 4, 2019)(olis.oregonlegislature.gov).gov
- Sen. Ginny Burdick, written testimony on SB 608 (February 4, 2019)(olis.oregonlegislature.gov).gov
- Katrina Holland, Community Alliance of Tenants, written testimony on SB 608 (February 4, 2019)(olis.oregonlegislature.gov).gov
- Deborah Imse, Multifamily NW, written testimony on SB 608 (February 4, 2019)(olis.oregonlegislature.gov).gov
- Jim Straub, Oregon Rental Housing Association, written testimony on SB 608 (February 4, 2019)(olis.oregonlegislature.gov).gov
- Randall Pozdena, QuantEcon, written testimony on SB 608, House Committee on Human Services and Housing (February 2019)(olis.oregonlegislature.gov).gov
- Cameron Herrington, Oregon Housing Alliance, testimony on SB 611 (2023)(olis.oregonlegislature.gov).gov
- Alexis Ames, Community Alliance of Tenants, testimony on SB 611 (2023)(olis.oregonlegislature.gov).gov
- Gary Fisher, Multifamily NW, letter on SB 611 (2023)(olis.oregonlegislature.gov).gov
- Tia Politi, Oregon Rental Housing Association, testimony on SB 611 (2023)(olis.oregonlegislature.gov).gov
- Deborah Imse, Multifamily NW, testimony on SB 611 to House Rules (June 2023)(olis.oregonlegislature.gov).gov
- Zillow Observed Rent Index (ZORI), metro file, smoothed, all homes plus multifamily(zillowstatic.com)
- U.S. Census Bureau, American Community Survey 1-year Public Use Microdata Sample (Oregon and Washington housing files)(census.gov).gov
- U.S. Census Bureau, ACS data release schedule(census.gov).gov
- U.S. Census Bureau, Building Permits Survey, state annual files(census.gov).gov
- Adi Tarabeih, "Rolling windows, closed doors: Mobility and tenure effects of Oregon's statewide rent stabilization policy," Journal of Housing Economics (2026), OpenAlex record and abstract(openalex.org)
- Journal of Housing Economics, Tarabeih (2026), publisher page(sciencedirect.com)
- OPB, Senate committee hearing on SB 608 (February 4, 2019)(opb.org)
- Portland Mercury, Oregon Senate passes statewide rent control bill (February 12, 2019)(portlandmercury.com)
- Willamette Week, Democrats confident on statewide rent controls (January 16, 2019)(wweek.com)
- Reason (Reason Foundation), on SB 608 and the ECONorthwest estimate (January 18, 2019)(reason.com)
- KTVZ, Oregon Senate passes rent control bill (February 13, 2019)(ktvz.com)
- The Oregonian via Governing, House passage of SB 608 (February 26, 2019)(governing.com)
- OPB, Brown signs rent control law (February 28, 2019)(opb.org)
- KOIN 6, Brown signs Oregon rent control bill into law (February 28, 2019)(koin.com)
- HousingWire, Oregon enacts first statewide rent control law (March 1, 2019)(housingwire.com)
- OPB via Jefferson Public Radio, 2023 cap of 14.6% (September 14, 2022)(ijpr.org)
- KATU, statement from Gov. Kate Brown's office on the 2023 cap (September 13, 2022)(katu.com)
- East Oregonian, reactions to the 14.6% cap, including Josh Lehner, Multifamily NW and Community Alliance of Tenants (September 15, 2022)(eastoregonian.com)
- East Oregonian, SB 611 as introduced (March 2023)(eastoregonian.com)
- OPB, SB 611 hearing (March 27, 2023)(opb.org)
- Oregon Capital Chronicle via Washington State Standard, SB 611 final votes (June 2023)(washingtonstatestandard.com)
- KPTV, Gov. Kotek signs rent increase limit (July 7, 2023)(kptv.com)
- Southeast Examiner, rent stabilization bill becomes law (July 2023)(southeastexaminer.com)
- Washington State Standard, Washington rent cap signed into law (May 7, 2025)(washingtonstatestandard.com)
- Office of Washington Gov. Bob Ferguson, HB 1217 signing release (May 7, 2025)(governor.wa.gov).gov
- KXLY, governor signs rent stabilization bill (May 2025)(kxly.com)
- Multifamily Dive, Washington rent control legislation (May 2025)(multifamilydive.com)
- Axios Seattle, Washington rent hike limit (May 7, 2025)(axios.com)
- RCW 59.18.700, Washington limit on rent increases(app.leg.wa.gov).gov
- Washington Department of Commerce bulletin, 2027 maximum annual rent increase (July 15, 2026)(content.govdelivery.com)
- Washington Department of Commerce, HB 1217 Landlord Resource Center(commerce.wa.gov).gov
- OPB, Oregon lawmakers to consider expanding rent stabilization, banning AI rent software (March 22, 2025)(opb.org)