Since Fiscal 2024, Philadelphia's Soda Tax Has Raised Less Than Its Programs Cost

Independently fact-checked against primary sources (last audited November 1, 2026). · 22 primary sources cited on this page. How we verify our legal content
On the Thursday Philadelphia voted on its soda tax, June 16, 2016, groups of pre-K students clustered outside City Hall "doing geyser experiments with soda and Mentos," the Associated Press reported. In the hallway near the Council chamber they wore headbands reading "Pre-K rocks!"
Out on the plaza, the industry-funded No Philly Grocery Tax campaign had set up "a big display on the plaza with stacks of drinks and graphs showing how much consumers would pay if the tax passed." Inside, City Council voted 13-4 for a tax of 1.5 cents an ounce on sugary and diet drinks. Berkeley, California, a city of about 112,000, was the only other U.S. city with a similar tax, NPR reported; Philadelphia had about 1.5 million people.
The tax would pay for free pre-K, community schools and repairs to parks, recreation centers and libraries, and the money would come from the drinks stacked on the plaza. The city's revenue forecast already assumed people would buy fewer of them. In March 2017, a spokesman for the mayor said the Revenue Department had "factored a 27 percent cut in consumption" into its projections.
At the chain stores researchers tracked, sales fell further than that: by about half in 2017, and about a quarter of that loss turned up in stores just over the city line.
The tax has never raised the roughly $91 million a year the city talked about in 2016. Collections fell from $77 million in its first full fiscal year (July 2017 to June 2018) to $68 million in fiscal 2025.
By the finance director's account, fiscal 2024 was the year the three programs began costing more than the tax brings in, with the general fund, the city's main operating budget, covering the rest. Then, in the fiscal year that ended in June 2026, preliminary collections went up. Philadelphia paid for three growing programs with a tax on drinks it expected people to buy less of. How has that money held up, and who covers the gap?
Why a mayor who once voted no proposed it
Jim Kenney gave his first budget address on March 3, 2016, in the Council chamber where he had served for 23 years. He asked for a tax of 3 cents an ounce on sugary drinks, collected from distributors, to pay for pensions, pre-K, community schools and neighborhood buildings. "The tax plan got a rousing round of applause," PhillyVoice reported.
His predecessor, Michael Nutter, had tried a soda tax twice and failed to convince Council. Kenney, then a councilman, had voted against one of those proposals. In the address he said the industry's lobbyists were "pretty persuasive. So persuasive, they even got me to believe them."
This time he said there was no other source. "There is simply nowhere else to find this revenue," he told Council. "We all know we can't raise property taxes again. We've already raised them four times in the last five years."
City officials projected the 3-cent plan would raise $95 million a year, Billy Penn reported. The Notebook reported that Kenney wanted $400 million over five years for his priorities, including a $256 million plan to create 25,000 pre-K seats and $39 million toward 25 community schools in his first term.
He also took on the jobs argument. Of the claim that the tax would cause an employment crisis, he said "we know that's false," because "Employment did not slow down after the liquor tax was instated." Drivers for Pepsi and Coke, he argued, also deliver bottled water and other products "that would be exempt from these taxes."
Kenney did not sell it as a health measure. In the week before the vote, the AP reported, he said Americans generally reject other people telling them what is healthy, so his administration tried to stay away from that; any health benefits, in the AP's paraphrase, were just a bonus. The Pennsylvania Intergovernmental Cooperation Authority (PICA), the state-created board that oversees the city's finances, later described the tax the same way: "the driving force being its revenue generation potential rather than health benefits derived from reduced consumption, although that was viewed a bonus."
Others outside City Hall did make the health case. Michael Bloomberg, the former New York mayor, said in a statement that obesity and poverty "are both intractable national problems. No policy takes more direct aim at both than Philadelphia's tax on sugary drinks." Michael Long, a George Washington University researcher, told NPR that his team's model of a 1-cent tax projected "over 12,000 cases of obesity prevented by the end of the 10-year period."
What the industry said would happen
The American Beverage Association, the beverage makers' trade group, called the tax "a regressive tax that unfairly singles out beverages" and said that "most importantly, it is against the law." Harold Honickman, a Philadelphia-area bottler, said sales would go down and jobs would be lost, the AP reported.
Some of the warnings came from inside Council. Councilwoman Jannie Blackwell said the tax could cost jobs, including her own, The Notebook reported. Councilman Brian O'Neill, a Republican, said on the day of the address that he could never support it. John Longstreet of the Pennsylvania Restaurant and Lodging Association said it was "a huge increase" that would likely cut into restaurant margins.
Sen. Bernie Sanders, then running for president, called it "a regressive grocery tax that would disproportionately affect low-income and middle-class Americans." Anthony Campisi, spokesman for the No Philly Grocery Tax campaign, cited the association's poll: "Fifty-eight percent of Philadelphians oppose this tax because they know that it'll hurt working families." That poll of 400 likely voters had asked about the original 3-cent proposal.
Both sides spent heavily. Filings with the city's Board of Ethics showed the American Beverage Association spent more than $10.6 million against the tax, BevNET reported, more than four times the $2.5 million spent for it. Of the money for it, $2.2 million came from the Kenney-backed committee Philadelphians for a Fair Future, including $1.6 million from Bloomberg.
The bill that passed was half the size of the first proposal and wider in reach. The rate was 1.5 cents, and the tax covered drinks with artificial sweeteners such as stevia, aspartame and sucralose as well as sugar. Kenney said it would raise $386 million over five years; NPR reported an estimate of $91 million a year. He signed it on June 20, 2016.
The industry went to court on September 14, 2016, joined by the state's beverage and food merchants' associations, a wholesale distributor and the South Philadelphia sandwich shop John's Roast Pork. Their lawyer, Shanin Specter, argued that "About $23 million of this $91 million revenue raise will come right from the federal treasury," through food-stamp purchases. The coalition also warned that stores "on the Philadelphia border" would "lose customers to less-expensive options in the suburbs."
The first six months
Common Pleas Judge Gary Glazer dismissed the industry's arguments on December 19, 2016. "Philadelphia families will be shocked in January when prices jump on more than 1,000 common beverages," Campisi said that day. The tax took effect on January 1, 2017.
The first month looked good for the city. In late February, Kenney announced the tax had raised $5.7 million in January, "more than double what city officials had projected," 6abc reported.
On March 1, Pepsi said it would cut 80 to 100 of its 423 jobs in the city. "Unfortunately, after careful consideration of the economic realities created by the recently enacted beverage tax, we have been forced to give notice," spokesman Dave DeCecco said. The company said its beverage sales were down 40% in the city and up only 10-15% outside it, and it stopped selling 12-packs and 2-liter bottles in Philadelphia.
Lauren Hitt, the mayor's spokeswoman, answered that "They are literally holding hostage the jobs of hardworking people in their battle to overturn the tax." Daniel Grace of Teamsters Local 830, the union of beverage truck drivers, said: "We predicted this dire outcome from the outset."
Kenney, asked that month about his combative defense of the tax, said: "I am not going to apologize for being passionate for our kids." The industry turned its No Philly Grocery Tax coalition into "Ax the Tax" and kept lobbying for repeal.
By late March, grocery stores and soda distributors told WHYY that sales had dropped "by as much as 30 to 50 percent." It was in answer to those reports that the mayor's spokesman pointed to the forecast's built-in cut. Campisi turned the point around: "Our predictions and in fact, the mayor's predictions are coming true."
The half-year closed in June. From January through June 2017 the tax brought in $32.5 million against an estimate of $46.2 million, about 70% of the target.
City Controller Alan Butkovitz looked ahead. "If that trend continues, during the next year, they'll be about $15 million off of their hoped-for $91 million," he told CBS Philadelphia on June 13, 2017. Hitt said the city "remains confident it will raise the expected revenue next year." The next day, after the Commonwealth Court upheld the tax, spokesman Mike Dunn said the city was confident of "the $92 million per year promised going forward."
Where did the drinks go?
The first large study of what happened to sales came in May 2019, more than two years after the tax began. A team led by Christina Roberto of the University of Pennsylvania used checkout scanner data from 291 chain stores (54 supermarkets, 20 mass merchandisers and 217 pharmacies) and compared Philadelphia with Baltimore, which had no tax, and with Pennsylvania ZIP codes on the city's border. Those stores sold about a quarter of the taxed ounces sold in the city.
How much less did those stores sell, and how much moved to the suburbs?
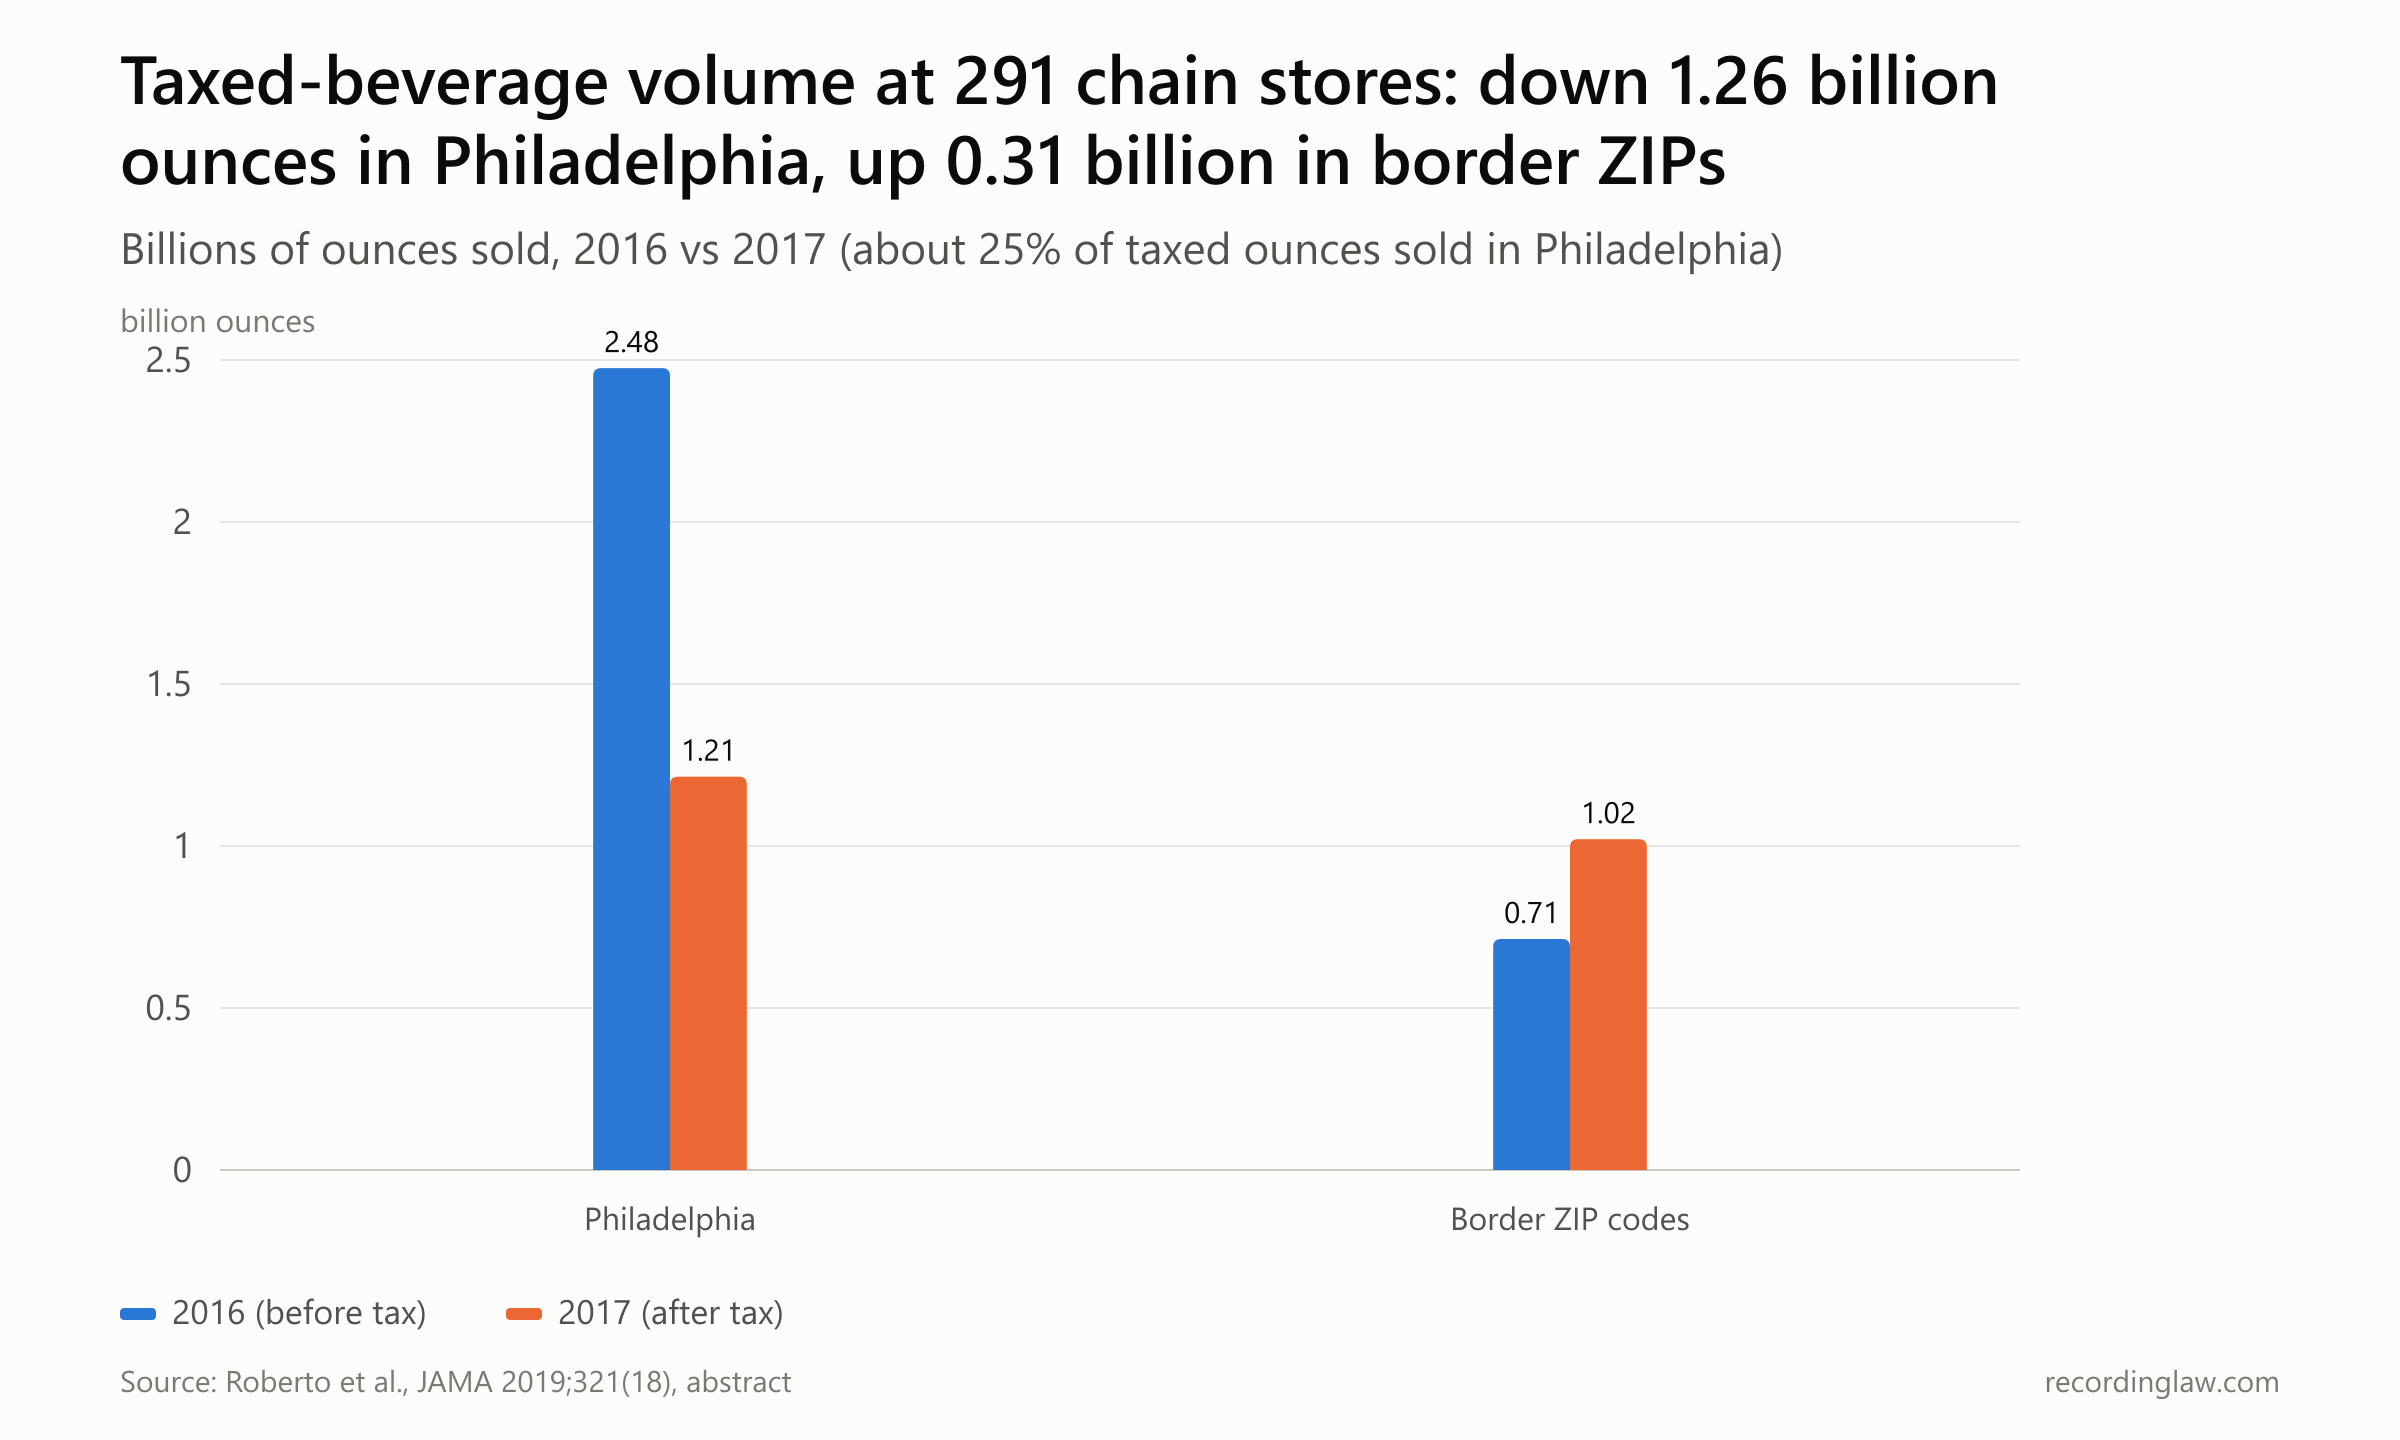
Source: Roberto et al., JAMA 2019;321(18):1799-1810. Data cover about 25% of taxed ounces sold in Philadelphia.
| Area | 2016 (billion oz) | 2017 (billion oz) | Change |
|---|---|---|---|
| Philadelphia chain stores | 2.475 | 1.214 | -1.261 (-51.0%) |
| Pennsylvania border ZIP codes | 0.713 | 1.021 | +0.308 |
In Philadelphia the stores sold 1.3 billion fewer ounces of taxed drinks in 2017, a drop of 51%. Stores in the border ZIP codes sold 308 million more, which offset 24.4% of the city's decline. Counting the city and the border ZIP codes together, volume at those stores fell by about 38.5%.
The coalition's 2016 warning about border stores showed up in the second row of that table. Campisi's warning that prices would jump showed up too: at Philadelphia supermarkets the average price of taxed drinks rose from 5.43 cents an ounce to 6.24 cents, while in Baltimore it went from 5.33 to 5.50.
Was the drop the same everywhere people bought drinks?
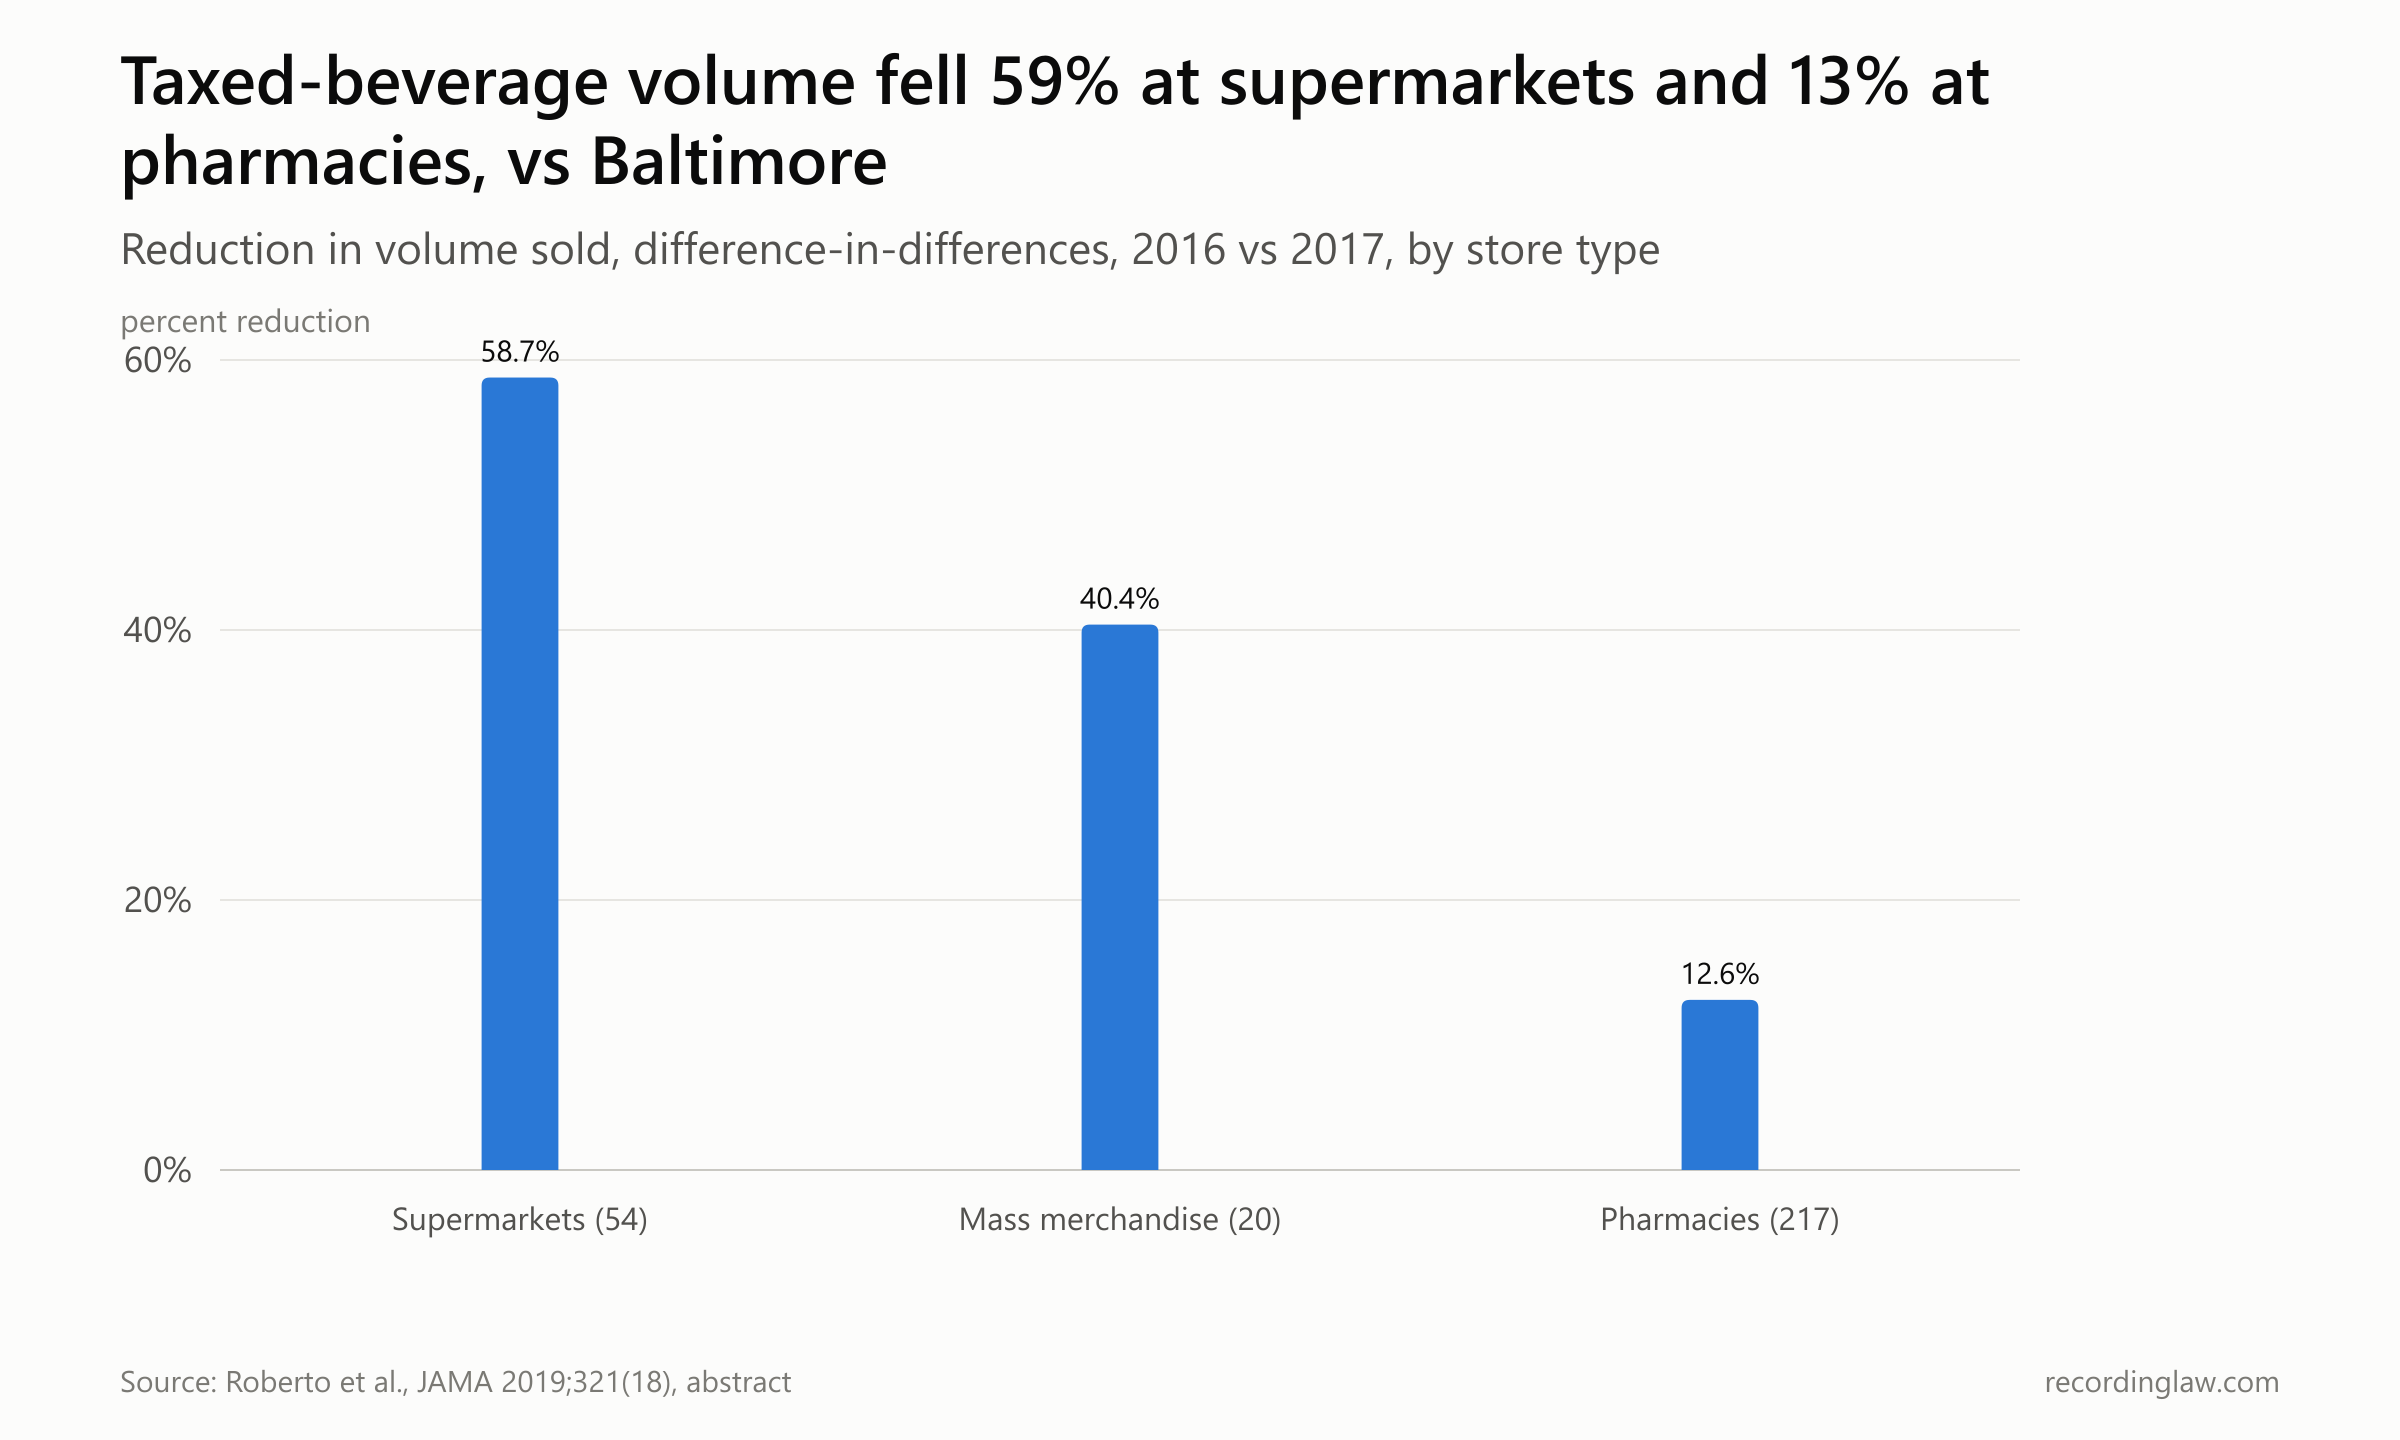
Source: Roberto et al., JAMA 2019. Each figure is the change in Philadelphia minus the change in Baltimore over the same period (a difference-in-differences comparison), 2016 vs 2017.
| Store type | Stores | Reduction vs Baltimore |
|---|---|---|
| Supermarkets | 54 | 58.7% |
| Mass merchandise | 20 | 40.4% |
| Pharmacies | 217 | 12.6% |
Supermarkets saw the largest drop. The authors suggested in-store signage about the tax, a shift to mass merchandisers, or different shopping habits and price sensitivity might explain it. Jeff Brown, chief executive of Brown's Super Stores, had told state senators in October 2017 that the tax "has cut beverage sales by half at our 13 ShopRite stores in the city," with storewide sales drops of "10 to a whopping 25 percent."
The study was paid for by Bloomberg Philanthropies, which, the AP noted, "supports anti-obesity measures including soda taxes." The journal's disclosures say the funder had no role in the study's design or analysis, and that one co-author was an employee of the Philadelphia Department of Public Health. The beverage association's spokesman, William Dermody, said the study conflicted with other evidence "suggesting a bigger effect from cross-border shopping."
The industry's own figures also showed city sales falling and suburban sales rising, by different amounts. An Oxford Economics report sponsored by the association found bottlers' sales in Philadelphia "fell by roughly 29 percent while increasing by roughly 26 percent in the region immediately surrounding the city." A fact sheet the association distributed cited Catalina market research putting the soda drop at 55%.
Did the drop last, and did people drink less?
Over the next six years, the same research group and others went back with other stores, longer windows and different measures. Do they agree on the size?
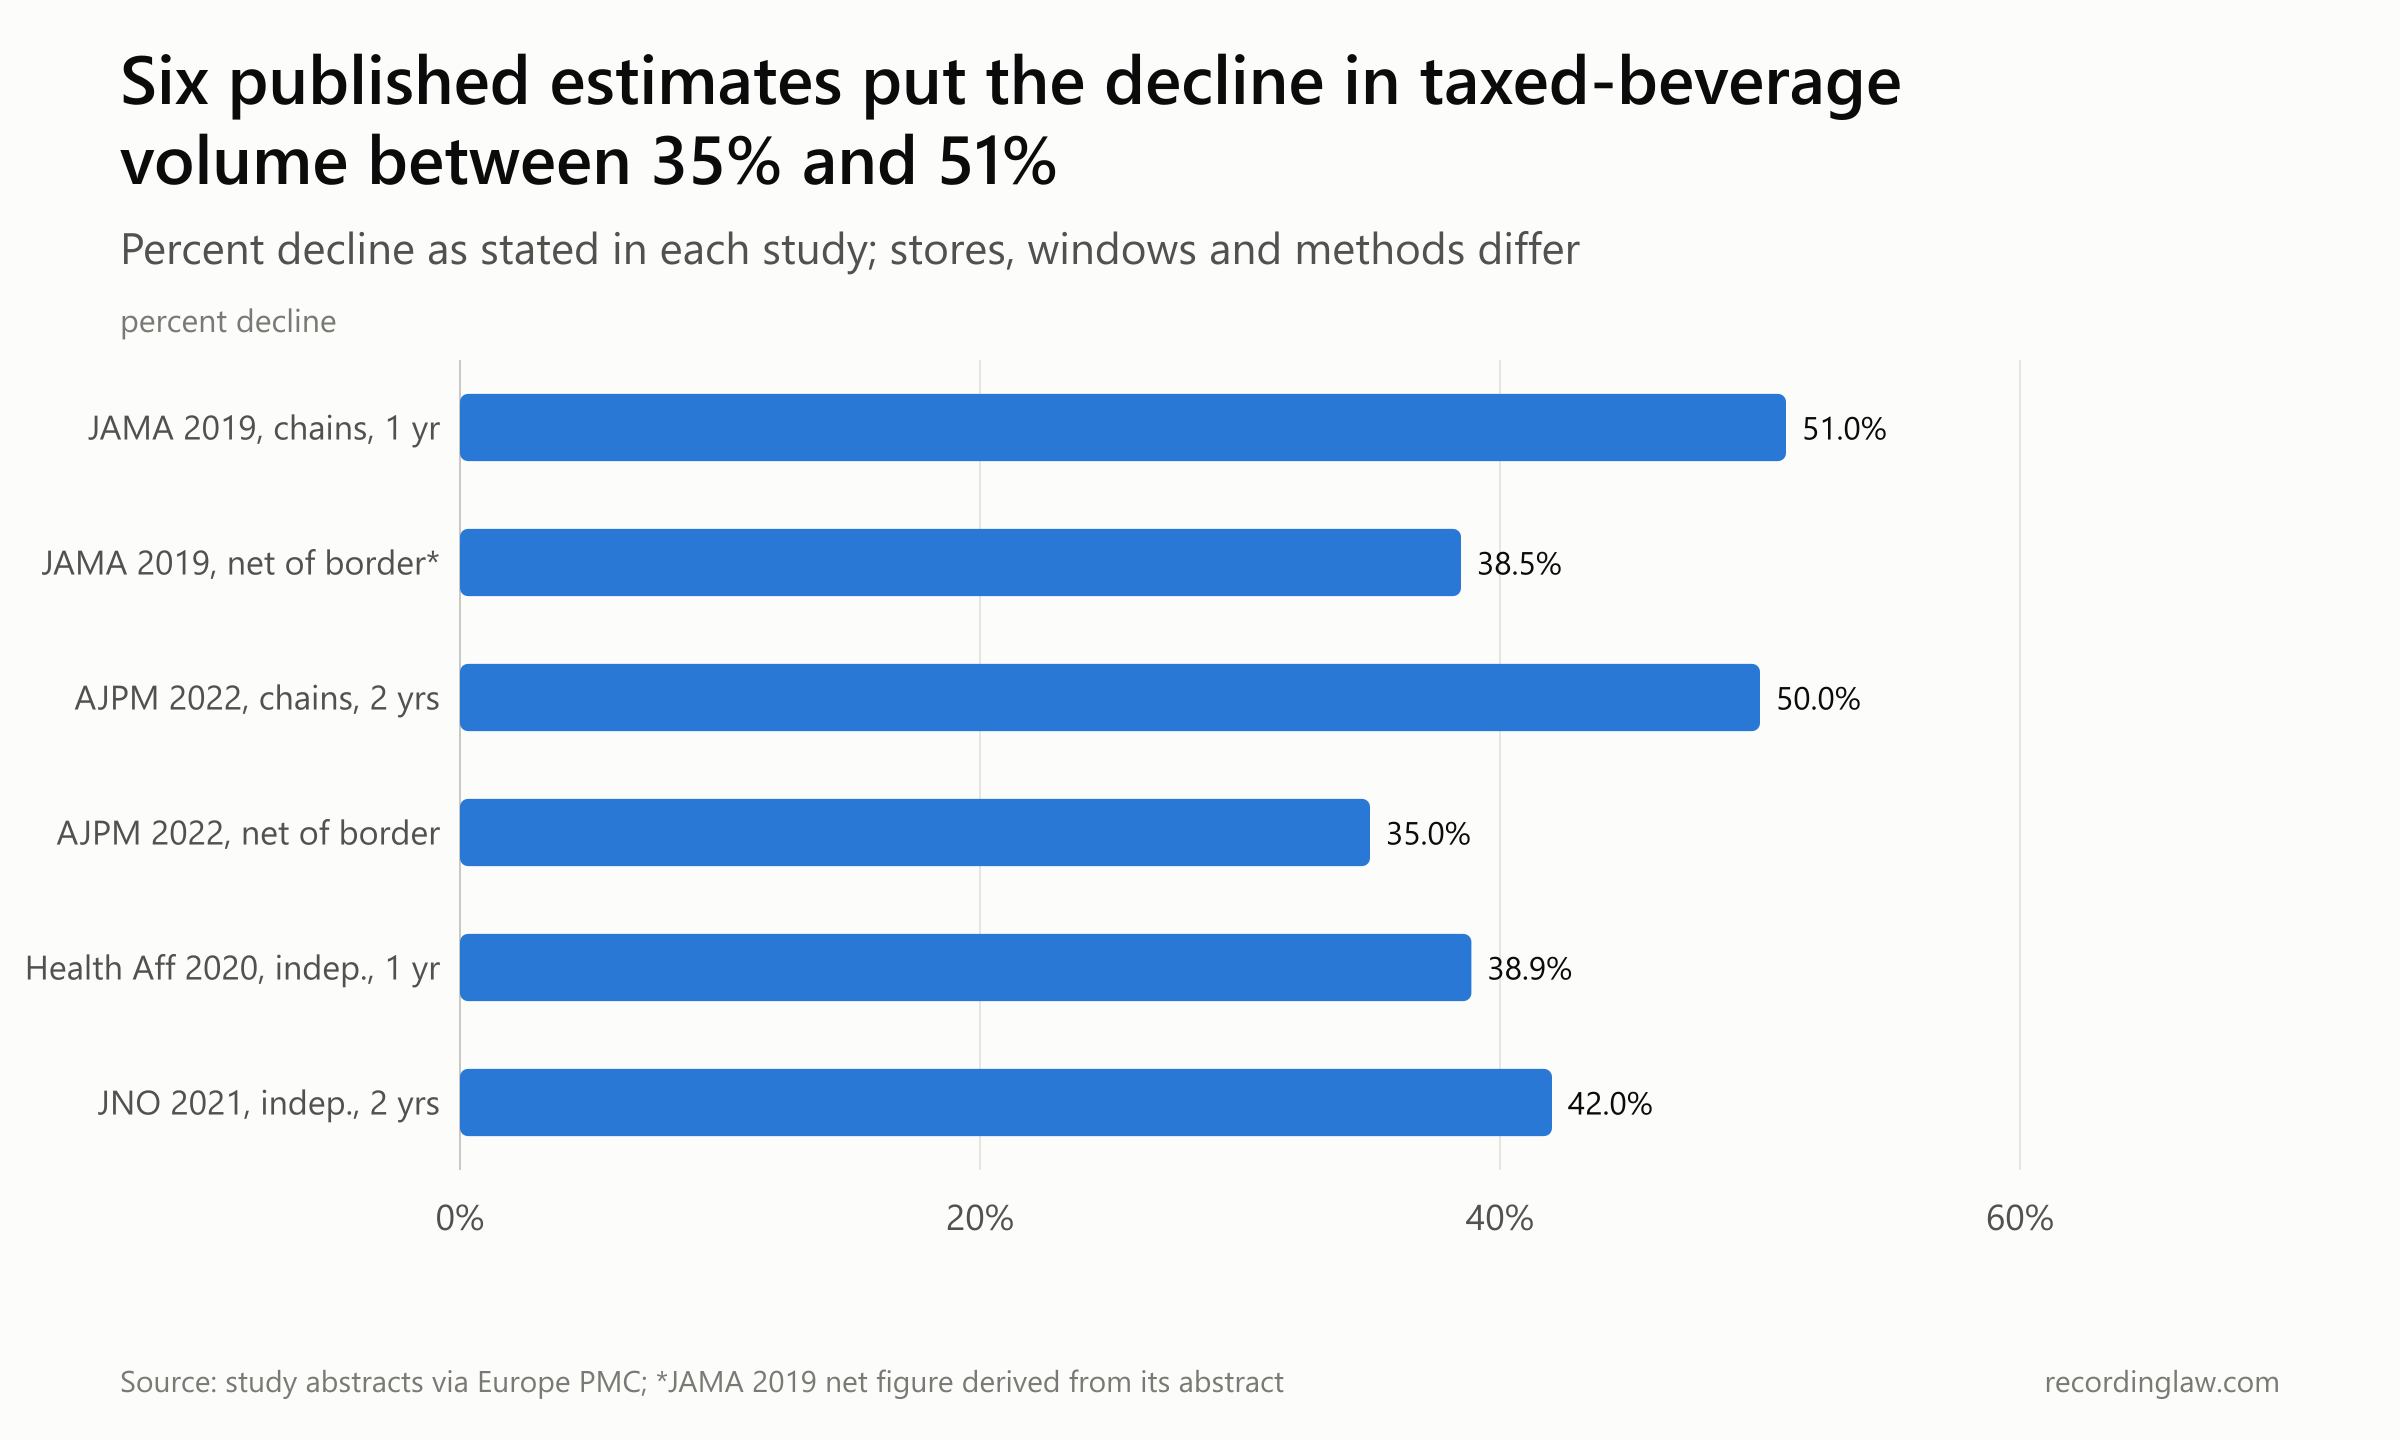
Source: study abstracts via Europe PMC. The JAMA 2019 net figure is derived from its abstract. Stores, comparison areas and time windows differ, so the figures are not interchangeable.
| Study | Stores | Window | Decline |
|---|---|---|---|
| JAMA 2019 | Chain stores | 1 year | 51% |
| JAMA 2019, net of border (derived) | Chain stores | 1 year | 38.5% |
| Am J Prev Med 2022 | Chain stores | 2 years | 50% |
| Am J Prev Med 2022, net of border | Chain stores | 2 years | 35% |
| Health Affairs 2020 | Independent stores | 1 year | 38.9% |
| JAMA Network Open 2021 | Independent stores | 2 years | 42% |
The two-year chain-store study (American Journal of Preventive Medicine, 2022) found the 50% drop held into 2018, or 35% after counting cross-border shopping. Studies of independent stores, where researchers observed individual purchases, found declines of about 39% after one year and 42% after two. Prices at those stores rose by more than the tax itself.
Measures of what people actually bought or drank moved less. A study following about 300 adult soda buyers in each city found no statistically significant change in their purchases in its main analysis. Pharmacy-chain cardholders in Philadelphia bought 7.8% fewer ounces of taxed drinks per transaction. A Drexel University phone survey found "no major overall impact" on population-level consumption one year in.
Some buyers switched. Supermarket sales of untaxed drink concentrates rose 27% in one study and 34% in the two-year study, though concentrates stayed a small share of beverage sales. A 2025 study of about 400 households across Philadelphia, Seattle, San Francisco and Oakland found lower-income households cut taxed purchases by "nearly 50%," more than double the 18% cut in higher-income households.
A $15 million gap, and a county that quit
The first full fiscal year, July 2017 to June 2018, closed with $77.3 million collected. The original budget estimate had been $92.4 million, a gap of $15.1 million. By March 2018 the city had already cut its estimate to $78.8 million.
That was the size of gap Butkovitz had described. By then he was the outgoing controller, and in October 2017 he put it in five-year terms. If revenues stayed on the same path, he said, the city could fall behind its projections "by $15 million or more a year. Over a five-year period, that's $75 million."
Chicago's county had already stopped. Cook County's 1-cent tax took effect on August 2, 2017. Board President Toni Preckwinkle, who had cast the tie-breaking vote to pass it, warned that "A vote to repeal is a vote against promoting better health outcomes." On October 11 the board voted 15-2 to repeal it, effective December 1, giving up a projected $200.6 million in the next budget.
Grace, the Teamsters official, called on Philadelphia to follow: "It's not too late for Philadelphia's elected officials to follow suit and repeal our city's regressive, discriminatory and under-performing beverage tax." At a state Senate hearing in Harrisburg that month, Sen. Anthony Williams, a Philadelphia Democrat and former PepsiCo executive, said the conversation would be about the policy: "how it works, how it doesn’t work."
In April 2018, Rep. Mark Mustio, an Allegheny County Republican, introduced a bill to overturn the tax and bar any Pennsylvania municipality from taxing food or drink other than alcohol. "This isn't a Philadelphia issue to me. It's a consumer issue and a jobs issue," he said.
A spokesperson for Gov. Tom Wolf answered: "We do not believe Harrisburg politicians should override the legal activities of local municipalities."
The courts settled it on July 18, 2018. The Pennsylvania Supreme Court upheld the tax 4-2, rejecting the argument that it duplicated the state sales tax in violation of a state law called the Sterling Act. "The payer of the beverage tax is the distributor, or in certain circumstances, dealers, but never the purchasing consumer," Chief Justice Thomas Saylor wrote. Justice David Wecht dissented: "A rose by any other name smells just as sweet."
Who followed, and who stopped?
When Philadelphia voted, soda tax proposals "have failed in more than 30 cities and states in recent years," the AP noted. Bloomberg predicted that "Philadelphia will almost certainly not be the last city." How did the cities that followed set their rates?
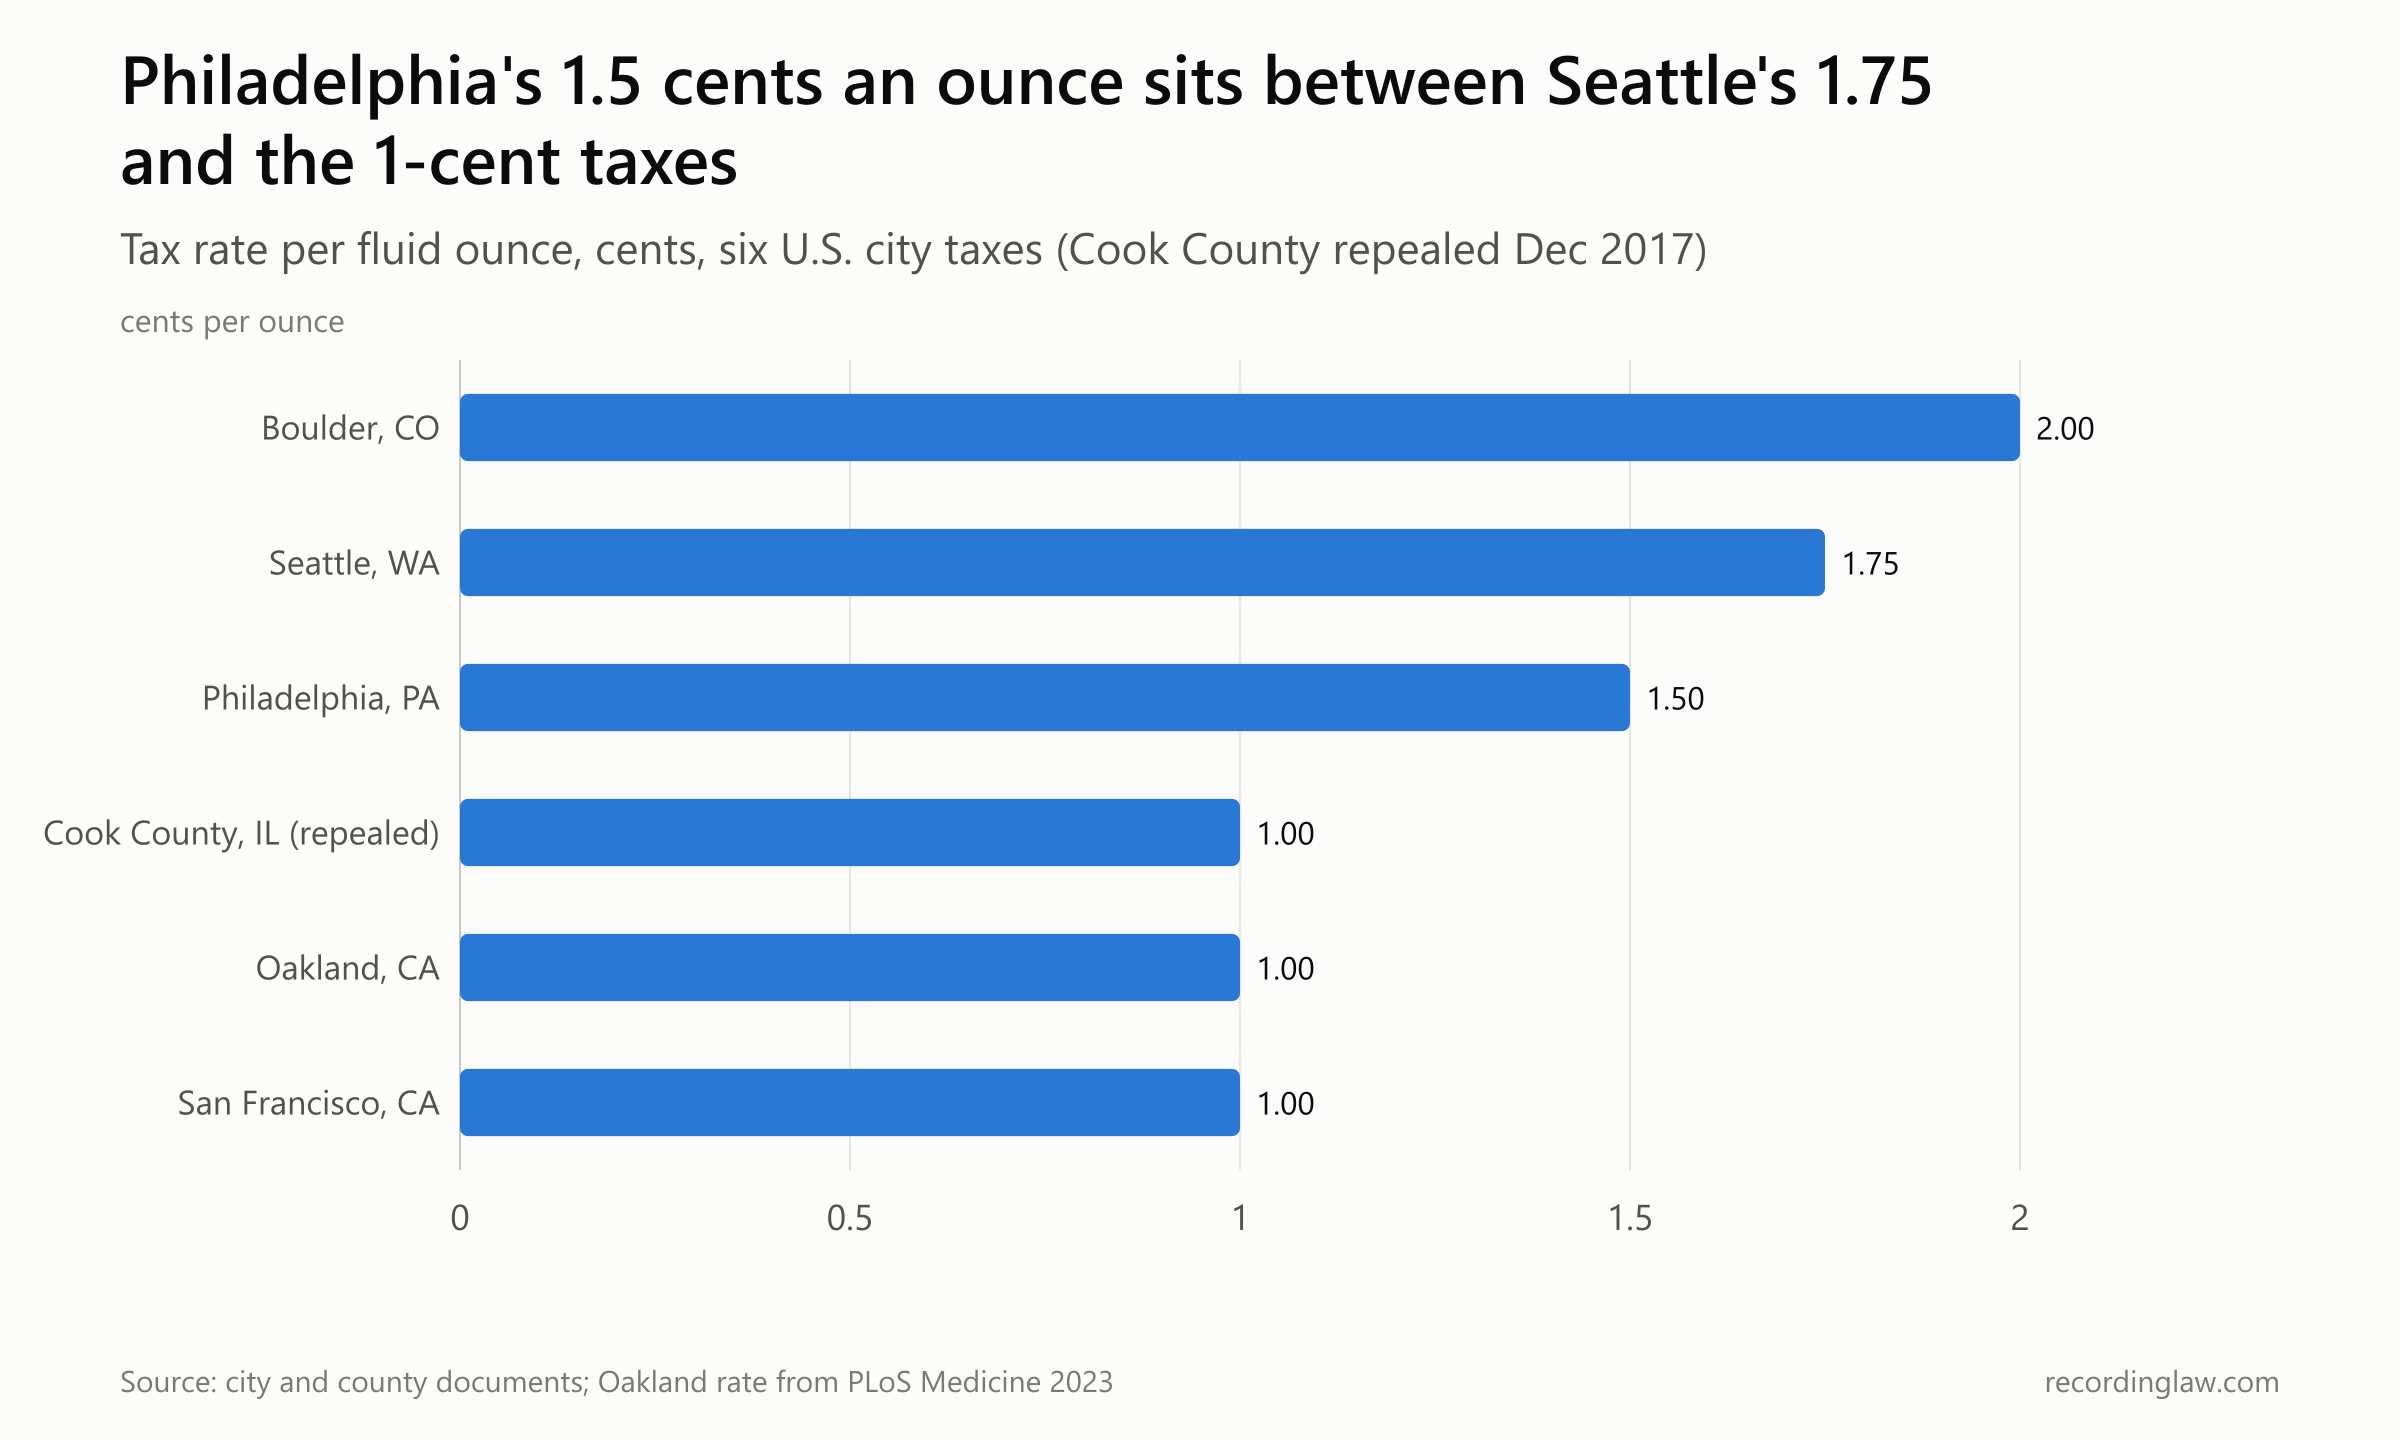
Source: city and county documents; Oakland rate from PLoS Medicine 2023.
| Place | Cents per ounce | Status |
|---|---|---|
| Boulder, CO | 2.0 | Took effect July 1, 2017 |
| Seattle, WA | 1.75 | Began 2018 |
| Philadelphia, PA | 1.5 | Took effect January 1, 2017 |
| Cook County, IL | 1.0 | August 2 to December 1, 2017 (repealed) |
| Oakland, CA | 1.0 | Took effect July 1, 2017 |
| San Francisco, CA | 1.0 | Rate from the city Treasurer |
Boulder voters adopted a 2-cent tax in November 2016. Seattle's 1.75-cent tax raised $20.3 million for programs in 2021. Studies there found smaller drops than Philadelphia's chain-store figure: purchases of sweetened drinks fell 26.8% in Oakland compared with nearby Richmond, and Seattle's taxed volume fell 20% per drink, with no detectable rise in surrounding King County.
California went the other way.
In 2018, facing an industry-backed ballot measure that would have made local taxes harder to raise, lawmakers passed a ban on new local soda taxes. Gov. Jerry Brown signed it and called the averted initiative "an abomination." TIME reported that the industry's "influence helped sway lawmakers in California, home of the U.S.' first soda tax, to ban future ones."
Did the jobs disappear?
Pepsi's layoff notice in March 2017 was the first test of Kenney's 2016 answer on jobs. In 2025, Teamsters Local 830 told Council that the tax had cost 1,000 of its members who drove trucks for distributors their work; that is the union's count, and we found no independent tally.
The studies split along their funding. Oxford Economics, in a December 2017 report sponsored by the American Beverage Association and built on bottler and supermarket data, estimated "an employment decline of 1,192 workers in Philadelphia," about 0.14% of the city's jobs. The report said bottler data suggested even that figure understated losses "by roughly 72 jobs." It counted gross losses and did not model where the unspent drink money went.
Penn researchers funded by Bloomberg Philanthropies looked at unemployment claims and found "no statistically significant changes" in Philadelphia compared with neighboring counties in the 14 months after the tax. A 2021 study using federal employment counts, also funded by Bloomberg according to its grant record, found the tax did not result in job losses "up to two and a half years" after it took effect.
A Bloomberg-funded review of local soda-tax studies at the University of Illinois Chicago concluded that "These empirical studies consistently found no net negative impacts" and noted that the industry's own estimates came from "simulation studies, which were not peer-reviewed." A Rutgers team led by economist Michael Lahr found the tax created at least as many jobs as it cost, while reporting "job losses in the distribution and trucking sectors."
Did anyone get healthier?
Health was the part Kenney had called a bonus. The 2019 study had no data on what people drank or weighed; Roberto told the AP the sales drop suggested Philadelphians were drinking less soda and was a promising sign. She told TIME that soda taxes were "a no-brainer."
Long's 2016 model had projected thousands of obesity cases prevented over ten years. The first direct look at children came in 2025. A study in JAMA Pediatrics, co-authored by Roberto and funded by the National Institutes of Health, followed 136,078 young people's medical records and found the tax "was not associated with changes in youth zBMI or obesity prevalence" two years after it began. (zBMI is a body mass index score adjusted for a child's age and sex.)
The model and the study measured different things over different periods, so the second does not test the first directly.
In testimony to Council in October 2025, Roberto cited other work from her group: dental records showing the tax "was associated with a 22% reduction in cavities among adults on Medicaid and 30% among children on Medicaid," and reductions in obesity among adults, "though we did not observe effects among children." She told Council that "Repealing this tax would be devastating for the City and its residents."
When the programs outgrew the tax
Collections never returned to their first-year level. After that first full year, did the money hold steady?
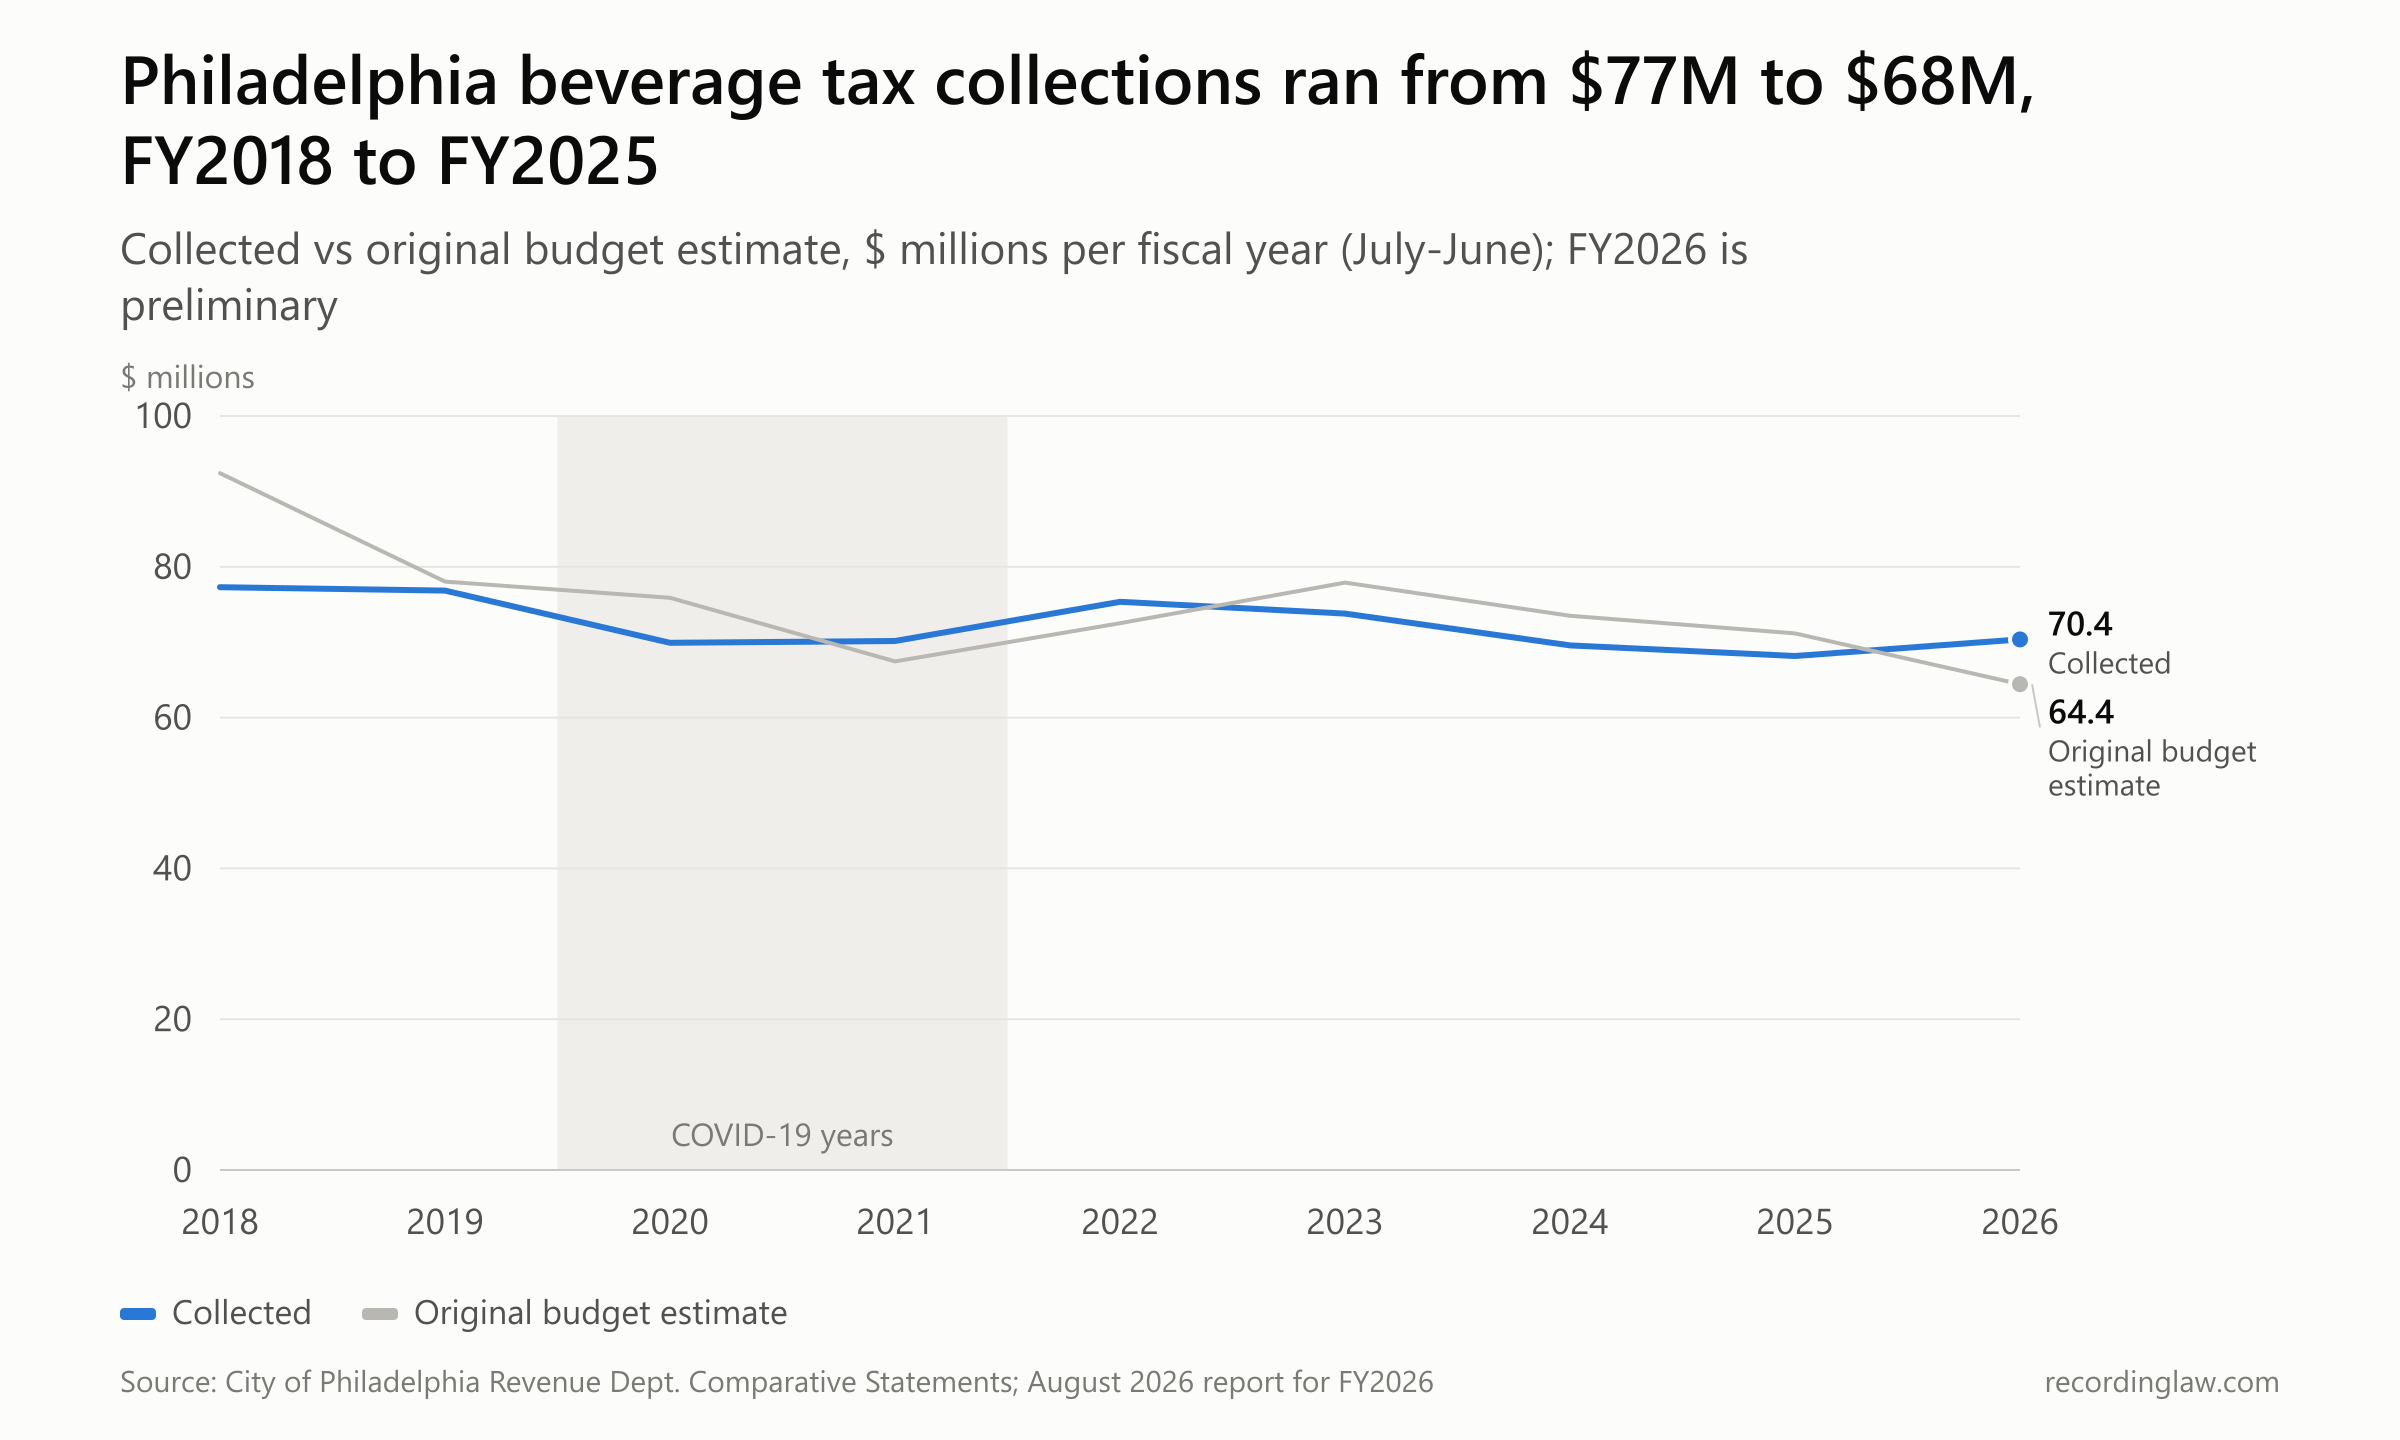
Source: City of Philadelphia Revenue Department, Comparative Statement of Net Revenue Collections (June reports; August 2026 report for preliminary FY2026). Not adjusted for inflation.
| Fiscal year (July-June) | Collected ($ millions) | Original estimate ($ millions) |
|---|---|---|
| 2018 | 77.29 | 92.41 |
| 2019 | 76.86 | 78.04 |
| 2020 | 69.92 | 75.88 |
| 2021 | 70.16 | 67.44 |
| 2022 | 75.37 | 72.52 |
| 2023 | 73.78 | 77.89 |
| 2024 | 69.58 | 73.50 |
| 2025 | 68.16 | 71.17 |
| 2026 (preliminary) | 70.37 | 64.43 (adopted) |
Collections drifted down while the city's other taxes grew. PICA calculated that beverage tax collections shrank at a compound annual rate of 1.8% from fiscal 2018 to 2025, while all General Fund tax revenue grew at 3.8% a year. It wrote that the decline "was expected given trends for reduced sugary drink consumption generally, even without the added cost of a tax." The biggest single-year drop, 9%, came in fiscal 2020, which PICA attributes partly to the pandemic.
In February 2026, PICA wrote that collections had "never grown year-over-year except in the second year," which had twelve months of collections instead of six, "and the COVID-recovery period in FY21 and FY22." Kenney had put the first five years at $386 million, without naming the window; the first five full fiscal years, 2018 through 2022, brought in about $370 million.
The programs kept growing. In October 2025, Finance Director Rob Dubow, who has served under Nutter, Kenney and Mayor Cherelle Parker, told Council that fiscal 2024 was the year the tax began taking in less than the city spends on pre-K, community schools and Rebuild, the program that repairs parks, recreation centers and libraries. The three programs were projected to cost $110 million in fiscal 2026, $73 million of it for pre-K.
Dubow said that was the plan. "We pay for it out of the general fund, which is what we always intended we would do," he said, and "We would not have been able to fund these programs without that beverage tax money."
Councilmember Jimmy Harrity, who chairs the committee that held the hearing, read the same numbers differently. "If we were in business and these numbers were the numbers of the business, we wouldn't be in business long," he said. O'Neill, one of the four no votes in 2016, called it "a mistake from the get-go" and "a job-killer." Parker, who voted for the tax as a Council member, still supports it; in 2019 she had called a Council move to study it "political weaponry."
The programs are smaller than the first promises. The 3-cent plan aimed at 25,000 pre-K seats; the 2017 testimony of Kenney and Council President Darrell Clarke promised 6,500 seats, 25 community schools and 150 to 200 Rebuild sites. In the 2025-26 school year the pre-K program offered 5,250 slots, community schools operated in 20 schools, and the city's Rebuild page lists 72 parks, recreation centers and libraries, with more than $500 million invested.
Repeal attempts have come and gone. Councilmember Maria Quiñones-Sánchez, another 2016 no vote, introduced a phase-out bill in 2019, and Councilmember David Oh introduced a repeal bill in 2022. After the 2025 hearing, the Inquirer reported it was "unlikely the tax will be reconsidered in a serious way any time soon"; Harrity said he might propose a working group to study other ways to fund pre-K.
PICA concluded that the tax "has performed as expected and provides a substantial amount of revenue," and that "To sustain General Fund expenditures without changing the tax rate or base, the City will need to look elsewhere for additional funds."
The year collections rose
In the fiscal year that ended in June 2026, collections went the other way. The Revenue Department's August 2026 report puts preliminary collections at $70.4 million, up from $68.2 million the year before.
That is above the $64.4 million in the adopted budget and the city's February 2026 estimate of $66.8 million, as reported by PICA. By May the city had raised its estimate to $71.0 million.
The current year started higher too. July and August 2026 brought in $12.7 million, against $11.9 million in the same two months of 2025, and the adopted budget for fiscal 2027 expects $72.5 million. The city's February 2026 five-year projection, as reported by PICA, went the other way, down to $61.3 million by fiscal 2030.
Against the programs' $110 million projected cost for fiscal 2026, the preliminary collections leave the general fund to cover about $40 million. The figure that settles the year is the Revenue Department's final June 2026 report, not yet posted as of October 31. Recent June reports have gone up between November and February: the June 2024 report in December 2024, the June 2025 report in February 2026.
The drinks stacked on the plaza in 2016 were meant to pay for the children in the hallway. On fiscal 2026's preliminary collections and projected cost, the tax covers a little under two-thirds of what those programs cost, and the city budget covers the rest. Whether fiscal 2026 was the start of a rise or a one-year bump will show in that final report, likely between November 2026 and February 2027, and in the fiscal 2027 monthly reports that follow.
How we measured
Collections. Annual figures are the "TOTAL PHILADELPHIA BEVERAGE TAX" line of the City Revenue Department's Comparative Statement of Net Revenue Collections. Fiscal years run July to June. FY2018 is the fiscal-year-to-date column of the June 2018 report (that report has no accrual columns; PICA cites $77.4 million). FY2019 to FY2025 use the with-accruals column of each June report. FY2026 ($70,366,101) is the preliminary July 2025 to June 2026 figure in the August 2026 report; the final June 2026 report was not posted as of October 31, 2026.
FY2017 held six months of collections ($32,549,120 against a $46,183,000 estimate) and is left out of the chart. Figures are nominal dollars, not adjusted for inflation.
Estimates. The chart compares each year's collections with the first (original) budget estimate printed in that year's June report; FY2026 uses the adopted estimate ($64,434,000). The FY2018 revised estimate ($78,826,000) and the FY2026 revised estimate ($70,955,000) are mid-year revisions.
Arithmetic. The FY2018 gap is $92,412,000 minus $77,290,438, or $15.1 million. The five-year sum is FY2018 through FY2022 collections ($369.6 million).
The roughly $40 million FY2026 gap is the $110 million projected program cost Dubow gave in October 2025 minus preliminary FY2026 collections of $70.4 million; the cost is a projection and the collections are preliminary. The share the tax covers is $70.4 million divided by $110 million, about 64%. Fiscal 2027 two-month growth: $12,658,243 against $11,925,281.
The 2019 chain-store study. Roberto et al., JAMA 2019;321(18):1799-1810, used licensed IRI scanner data from 291 stores, 2016 against 2017, with Baltimore as the comparison city. The 51.0% is a before-and-after change at Philadelphia stores; the store-type figures are difference-in-differences against Baltimore. The net figure of about 38.5% is our arithmetic on the abstract: (1.261 billion ounces lost minus 308.2 million ounces gained in border ZIP codes) divided by 2.475 billion; the paper's discussion rounds this to 38%. The stores cover about 25% of taxed ounces sold in Philadelphia; corner stores, restaurants and venues are not in this data.
Later studies. Estimates are taken as stated in each abstract: Petimar et al. (Am J Prev Med 2022, chain stores, 2016 against 2018); Health Affairs 2020 and JAMA Network Open 2021 (independent stores, observed purchases); Am J Clin Nutr 2020 (consumer cohort of 306 Philadelphia and 297 Baltimore adults); JAMA Network Open 2023 (pharmacy cardholders, per transaction); Am J Prev Med 2021 (substitution); Health Economics 2025 (household panel in four cities). They use different stores, comparison areas, outcomes and windows, so they are shown side by side, not averaged.
Funding. The 2019 JAMA study, the 2019 unemployment-claims study and the University of Illinois Chicago review were funded by Bloomberg Philanthropies, by their own disclosures; the 2021 employment study's Bloomberg funding is from its grant record. The Oxford Economics report was sponsored by the American Beverage Association.
The JAMA Pediatrics 2025 study was funded by the National Institutes of Health per its PubMed grant record. The Rutgers study's funder was not stated on the page we opened.
What the data cannot show. Scanner and collections data count what was sold and taxed, not what people drank. Collections also move with prices, product mix, enforcement and the pandemic, so a change in collections is not a measure of consumption. None of the sales studies can say what share of Philadelphians' drinks moved to stores outside the data.
Frequently Asked Questions
How much is the Philadelphia soda tax?
1.5 cents per fluid ounce on sugar-sweetened and artificially sweetened drinks, in effect since January 1, 2017. PICA calculates that as $1.01 on a 2-liter bottle and $0.18 on a 12-ounce can. Distributors usually collect and remit it.
How much money does the Philadelphia beverage tax raise?
About $77.3 million in its first full fiscal year (2018) and $68.2 million in fiscal 2025, according to City Revenue Department reports. Preliminary fiscal 2026 collections were $70.4 million; the final June 2026 report had not been posted as of October 31, 2026.
Did the soda tax reduce sales in Philadelphia?
At 291 tracked chain stores, taxed-drink volume fell 51% from 2016 to 2017 (JAMA 2019). Sales in Pennsylvania ZIP codes on the city border rose by an amount equal to 24.4% of that drop. A two-year study put the decline at 35% after cross-border shopping.
Did people shop outside Philadelphia to avoid the tax?
Some did. Border ZIP code stores in the 2019 study sold 308 million more ounces of taxed drinks in 2017 than in 2016. A bottler-data report sponsored by the American Beverage Association found sales up roughly 26% in the region around the city.
Did the Philadelphia soda tax cost jobs?
The studies disagree and are funded by opposing sides. An Oxford Economics report sponsored by the American Beverage Association estimated 1,192 lost jobs. Studies funded by Bloomberg Philanthropies found no significant change in unemployment claims or employment. Pepsi announced 80 to 100 layoffs in 2017.
Did the soda tax reduce obesity in Philadelphia?
A 2025 JAMA Pediatrics study found no change in children's BMI or obesity two years after the tax began. In 2025 testimony, lead Penn researcher Christina Roberto cited other studies by her group reporting fewer cavities among Medicaid patients and reductions in adult obesity.
What does the Philadelphia beverage tax pay for?
Free pre-K, community schools and the Rebuild program for parks, recreation centers and libraries. The city's finance director told Council in October 2025 that the programs were projected to cost $110 million in fiscal 2026, more than the tax raises, with the general fund covering the difference.
Was the Philadelphia soda tax challenged in court?
Yes. The American Beverage Association and others sued in September 2016. The Pennsylvania Supreme Court upheld the tax 4-2 on July 18, 2018, rejecting the argument that it duplicated the state sales tax.
Updates
Independently fact-checked against the cited primary sources
Sources and References
- City of Philadelphia Revenue Department, City Monthly Revenue Collections, August 2026 (preliminary FY2026; FY2027 to date)(phila.gov).gov
- City of Philadelphia, City Revenue Collections Report, June 2025(phila.gov).gov
- City of Philadelphia, City Revenue Collections Report, June 2024(phila.gov).gov
- City of Philadelphia, City Revenue Collections Report, June 2023(phila.gov).gov
- City of Philadelphia, City Revenue Collections Report, June 2022(phila.gov).gov
- City of Philadelphia, City Revenue Collections Report, June 2021(phila.gov).gov
- City of Philadelphia, City Revenue Collections Report, June 2020(phila.gov).gov
- City of Philadelphia, City Revenue Collections Report, June 2019(phila.gov).gov
- City of Philadelphia, General Fund Comparative Statements, June 2018(phila.gov).gov
- City of Philadelphia, General Fund Comparative Statements, June 2017(phila.gov).gov
- City of Philadelphia, FY2026 City Monthly Revenue Collections (report list)(phila.gov).gov
- City of Philadelphia, FY2027 City Monthly Revenue Collections (report list)(phila.gov).gov
- Pennsylvania Intergovernmental Cooperation Authority (PICA), Revenue Fact Sheet: Philadelphia Beverage Tax (February 2026)(picapa.org)
- Mayor Jim Kenney, FY2017 Budget Address to City Council (March 3, 2016)(phila.gov).gov
- City of Philadelphia, Mayor's statement on the sweetened beverage tax (June 16, 2016)(phila.gov).gov
- Mayor Kenney and Council President Clarke, written testimony to the Pennsylvania Senate Local Government Committee (June 2017)(phlcouncil.com)
- City of Philadelphia, Rebuild program page(phila.gov).gov
- Williams v. City of Philadelphia, 188 A.3d 421 (Pa. 2018), via CourtListener(courtlistener.com)
- Roberto CA et al., Association of a Beverage Tax on Sugar-Sweetened and Artificially Sweetened Beverages With Changes in Beverage Prices and Sales at Chain Retailers in a Large Urban Setting, JAMA 2019;321(18):1799-1810(doi.org)
- Roberto et al., JAMA 2019, full text and disclosures (PubMed Central)(pmc.ncbi.nlm.nih.gov).gov
- Petimar J et al., sustained beverage tax effects two years after implementation, Am J Prev Med 2022 (abstract)(europepmc.org)
- Independent-store prices and purchases one year after the Philadelphia beverage tax, Health Affairs 2020 (abstract)(europepmc.org)
- Independent-store purchases two years after the Philadelphia beverage tax, JAMA Network Open 2021 (abstract)(europepmc.org)
- Consumer purchases after the Philadelphia beverage tax, Am J Clin Nutr 2020 (abstract)(europepmc.org)
- Pharmacy-chain cardholder purchases, JAMA Network Open 2023 (abstract)(europepmc.org)
- Substitution to untaxed products after the Philadelphia beverage tax, Am J Prev Med 2021 (abstract)(europepmc.org)
- Household purchases by income after sweetened beverage taxes in four cities, Health Economics 2025 (abstract)(europepmc.org)
- Gregory EF, Roberto CA et al., Philadelphia beverage tax and youth BMI, JAMA Pediatrics 2025 (PubMed)(pubmed.ncbi.nlm.nih.gov).gov
- Zhong Y et al., beverage consumption one year after the Philadelphia tax, IJERPH 2020 (PubMed)(pubmed.ncbi.nlm.nih.gov).gov
- Oakland sugar-sweetened beverage tax and purchases, PLoS Medicine 2023 (abstract)(europepmc.org)
- Seattle sweetened beverage tax and spillover, PLoS One 2026 (abstract)(europepmc.org)
- Lawman HG et al., unemployment claims after the Philadelphia beverage tax, PLoS One 2019(journals.plos.org)
- Marinello S et al., employment after the Philadelphia beverage tax, Economics and Human Biology 2021 (PubMed)(pubmed.ncbi.nlm.nih.gov).gov
- Marinello S, Powell LM, review of labor-market impacts of local sweetened beverage taxes, P3RC Research Brief No. 122, University of Illinois Chicago (September 2021)(p3rc.uic.edu)
- Rutgers Bloustein School, news item on the Lahr employment study of the Philadelphia beverage tax(bloustein.rutgers.edu)
- Oxford Economics, The Economic Impact of Philadelphia's Beverage Tax (December 2017), sponsored by the American Beverage Association(ameribev.org)
- American Beverage Association, Philadelphia tax effect data findings (fact sheet)(ameribev.org)
- Penn LDI, Christina Roberto testimony on the health benefits of Philadelphia's sweetened beverage tax (October 2025)(ldi.upenn.edu)
- City of Boulder, Sugar-Sweetened Beverage Tax(bouldercolorado.gov).gov
- San Francisco Treasurer and Tax Collector, Sugary Drinks Tax(sftreasurer.org)
- California AB 1838 (2018), bill text(leginfo.legislature.ca.gov).gov
- 6abc/Associated Press, Philadelphia City Council passes soda tax (June 16, 2016)(6abc.com)
- Philadelphia Magazine, soda tax passes: winners and losers (June 16, 2016)(phillymag.com)
- WHYY, Philadelphia becomes first major U.S. city to pass sugary drinks tax (June 16, 2016)(whyy.org)
- NPR via KUER, Philadelphia becomes 1st major U.S. city to pass a tax on soda (June 16, 2016)(kuer.org)
- NPR via KUNC, industry vows to fight new tax in Philadelphia (June 17, 2016)(kunc.org)
- PhillyVoice, Mayor Kenney unveils 2017 budget proposal (March 3, 2016)(phillyvoice.com)
- The Notebook (Chalkbeat Philadelphia), mayor pitches soda tax for pre-K and community schools (March 3, 2016)(chalkbeat.org)
- The Notebook (Chalkbeat Philadelphia), Kenney delivers spending plan with call for soda tax (March 3, 2016)(chalkbeat.org)
- Billy Penn, Kenney's first budget pins education goals on soda tax (March 3, 2016)(billypenn.com)
- FoodNavigator-USA, beverage industry to fight Philadelphia's new soda tax (June 2016)(foodnavigator.com)
- BevNET, ABA spent $10.6 million in unsuccessful fight against Philadelphia soda tax (August 2016)(bevnet.com)
- WHYY, soda industry challenges Philly sweetened beverage tax in court (September 14, 2016)(whyy.org)
- WHYY, Philly soda tax declared valid (December 19, 2016)(whyy.org)
- 6abc, Pepsi cutting 80 to 100 Philly-area jobs (March 1, 2017)(6abc.com)
- Associated Press via Fox News, Pepsi to lay off 80 to 100 workers citing Philadelphia tax (March 1, 2017)(foxnews.com)
- WHYY, beverage tax revenue on track despite declining sales (March 23, 2017)(whyy.org)
- CBS Philadelphia, fight over Philly beverage tax goes on (March 24, 2017)(cbsnews.com)
- CBS Philadelphia, controller's beverage tax warning (June 13, 2017)(cbsnews.com)
- WHYY, Commonwealth Court upholds Philadelphia soda tax (June 14, 2017)(whyy.org)
- City & State Pennsylvania, Philly soda and wage taxes draw scrutiny in Harrisburg (October 2017)(cityandstatepa.com)
- PhillyVoice, after Cook County repeal, Philly union urges Kenney to do the same (October 11, 2017)(phillyvoice.com)
- Associated Press via FOX 29, county officials vote to repeal Chicago-area soda tax (October 11, 2017)(fox29.com)
- Cook County, Preckwinkle Unveils FY 2018 Executive Budget Recommendation (October 5, 2017)(cookcountyil.gov).gov
- The Bond Buyer, Cook County may kill soda tax (October 2017)(bondbuyer.com)
- WESA, Pittsburgh lawmaker goes after Philly soda tax (April 12, 2018)(wesa.fm)
- Billy Penn, a bill to kill the soda tax (June 28, 2018)(billypenn.com)
- NBC10/Associated Press, Pennsylvania Supreme Court upholds Philadelphia soda tax (July 18, 2018)(nbcphiladelphia.com)
- KFF Health News, under pressure, California lawmakers ban soda taxes for 12 years (2018)(kffhealthnews.org)
- TIME, Philadelphia soda tax study (May 14, 2019)(time.com)
- Associated Press via FOX 29, Philly soda tax study sees sales dip, health impact unclear (May 14, 2019)(fox29.com)
- WHYY, Philadelphia Council moves to phase out soda tax (March 14, 2019)(whyy.org)
- WHYY, David Oh introduces bill to repeal Philly soda tax (January 27, 2022)(whyy.org)
- Philadelphia Inquirer, soda tax hearings in City Council (January 23, 2025)(inquirer.com)
- Philadelphia Inquirer, Council hearing on the soda tax (October 27, 2025)(inquirer.com)
- Chalkbeat Philadelphia, councilmembers criticize soda tax used to fund free pre-K (October 27, 2025)(chalkbeat.org)