U.S. Fireworks Injury Estimates and State Fireworks Laws, 2008-2025
Independently fact-checked against primary sources (last audited October 26, 2026). · 16 primary sources cited on this page. How we verify our legal content
The U.S. Consumer Product Safety Commission (CPSC) estimated that hospital emergency departments treated 7,000 fireworks-related injuries in 2008 and 9,700 in 2023. CPSC news releases put the next two years at 14,700 (2024) and about 13,000 (2025). Over the same period, several states rewrote their fireworks laws to allow consumer fireworks that had been restricted, including Maine and Michigan (effective 2012), Iowa and Pennsylvania (2017) and Ohio (2022).
Consumer fireworks consumption also grew. The American Pyrotechnics Association (APA), the industry's trade group, reports 186.4 million pounds of consumer fireworks in 2008 and 298.9 million pounds in 2025. This article sets those national series side by side with the dates of seven state laws. It cannot test whether any one of those laws changed injuries in its state, because CPSC does not publish state injury totals and we found no before-and-after study for these states.
The national injury estimates, 2008-2025
CPSC estimates fireworks injuries from the National Electronic Injury Surveillance System (NEISS), a sample of hospital emergency departments. The estimates cover non-occupational injuries and are rounded to the nearest 100. The series runs from 7,000 in 2008 to 9,700 in 2023, with a high of 15,600 in 2020.
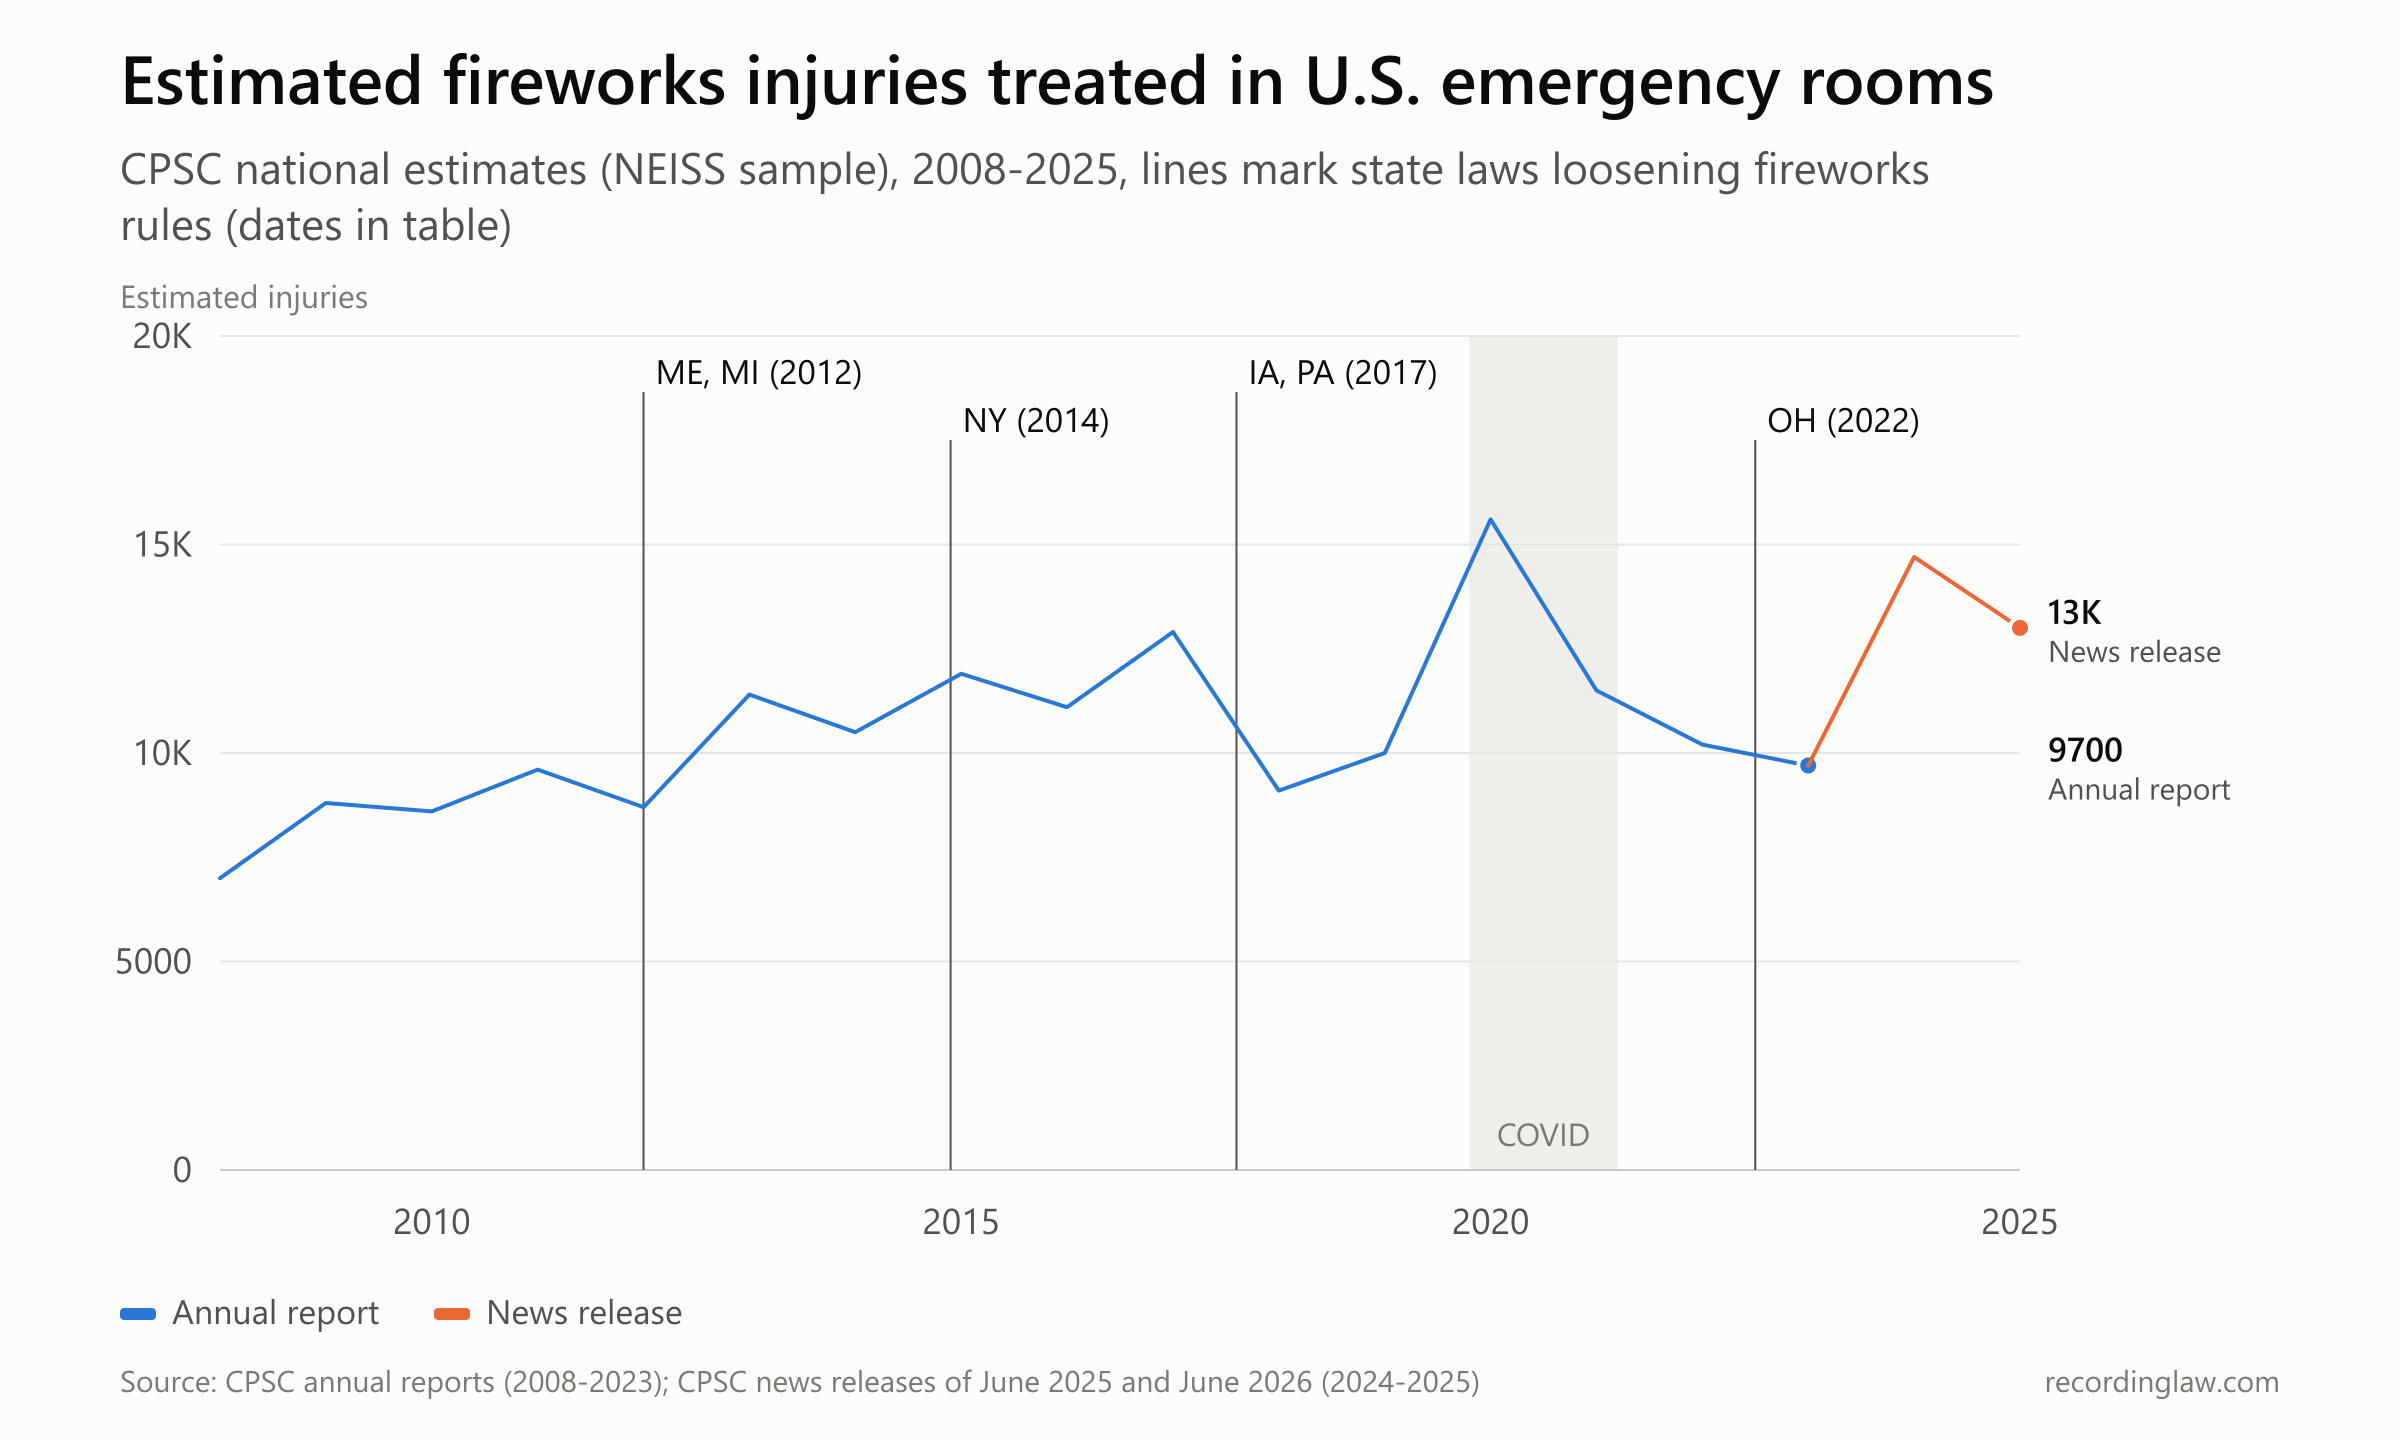
Source: CPSC Fireworks Annual Reports (2008-2023, Table 1 of the 2023 report); CPSC news releases of June 2025 and June 2026 (2024 and 2025).
| Year | Estimated injuries | Per 100,000 people |
|---|---|---|
| 2008 | 7,000 | 2.3 |
| 2012 | 8,700 | 2.8 |
| 2015 | 11,900 | 3.7 |
| 2017 | 12,900 | 4.0 |
| 2018 | 9,100 | 2.8 |
| 2019 | 10,000 | 3.0 |
| 2020 | 15,600 | 4.7 |
| 2021 | 11,500 | 3.5 |
| 2022 | 10,200 | 3.1 |
| 2023 | 9,700 | 2.9 |
| 2024 (news release) | 14,700 | not published |
| 2025 (news release) | about 13,000 | not published |
CPSC's 2023 report tested the 2008-2023 series for a trend. It found a statistically significant increase (p-value under 0.0001), with a slope of about 561 more injuries per year.
Each annual report tests the most recent 16 years, so the window moves and the result depends on its start year. The 2019 report found no statistically significant trend for 2004-2019. The 2020 report estimated about 202 more injuries a year for 2005-2020 (p-value 0.0029). The 2008 estimate of 7,000 is the lowest in CPSC's 2004-2023 tables; 2004 through 2007 ranged from 9,200 to 10,800.
The 2024 and 2025 figures come from news releases, not annual reports. CPSC described the 2024 figure as an increase of about 52 percent in injuries over 2023. As of October 26, 2026, CPSC's reports page lists no annual report after the 2023 edition, so the rounding and method details of these two figures may differ from the earlier series.
How wide the error bands are
Because NEISS is a sample, every estimate has a range. CPSC prints a 95 percent confidence interval in the text of each annual report, but not in its tables. The intervals for 2019 through 2023 span roughly 4,600 to 6,700 injuries each.
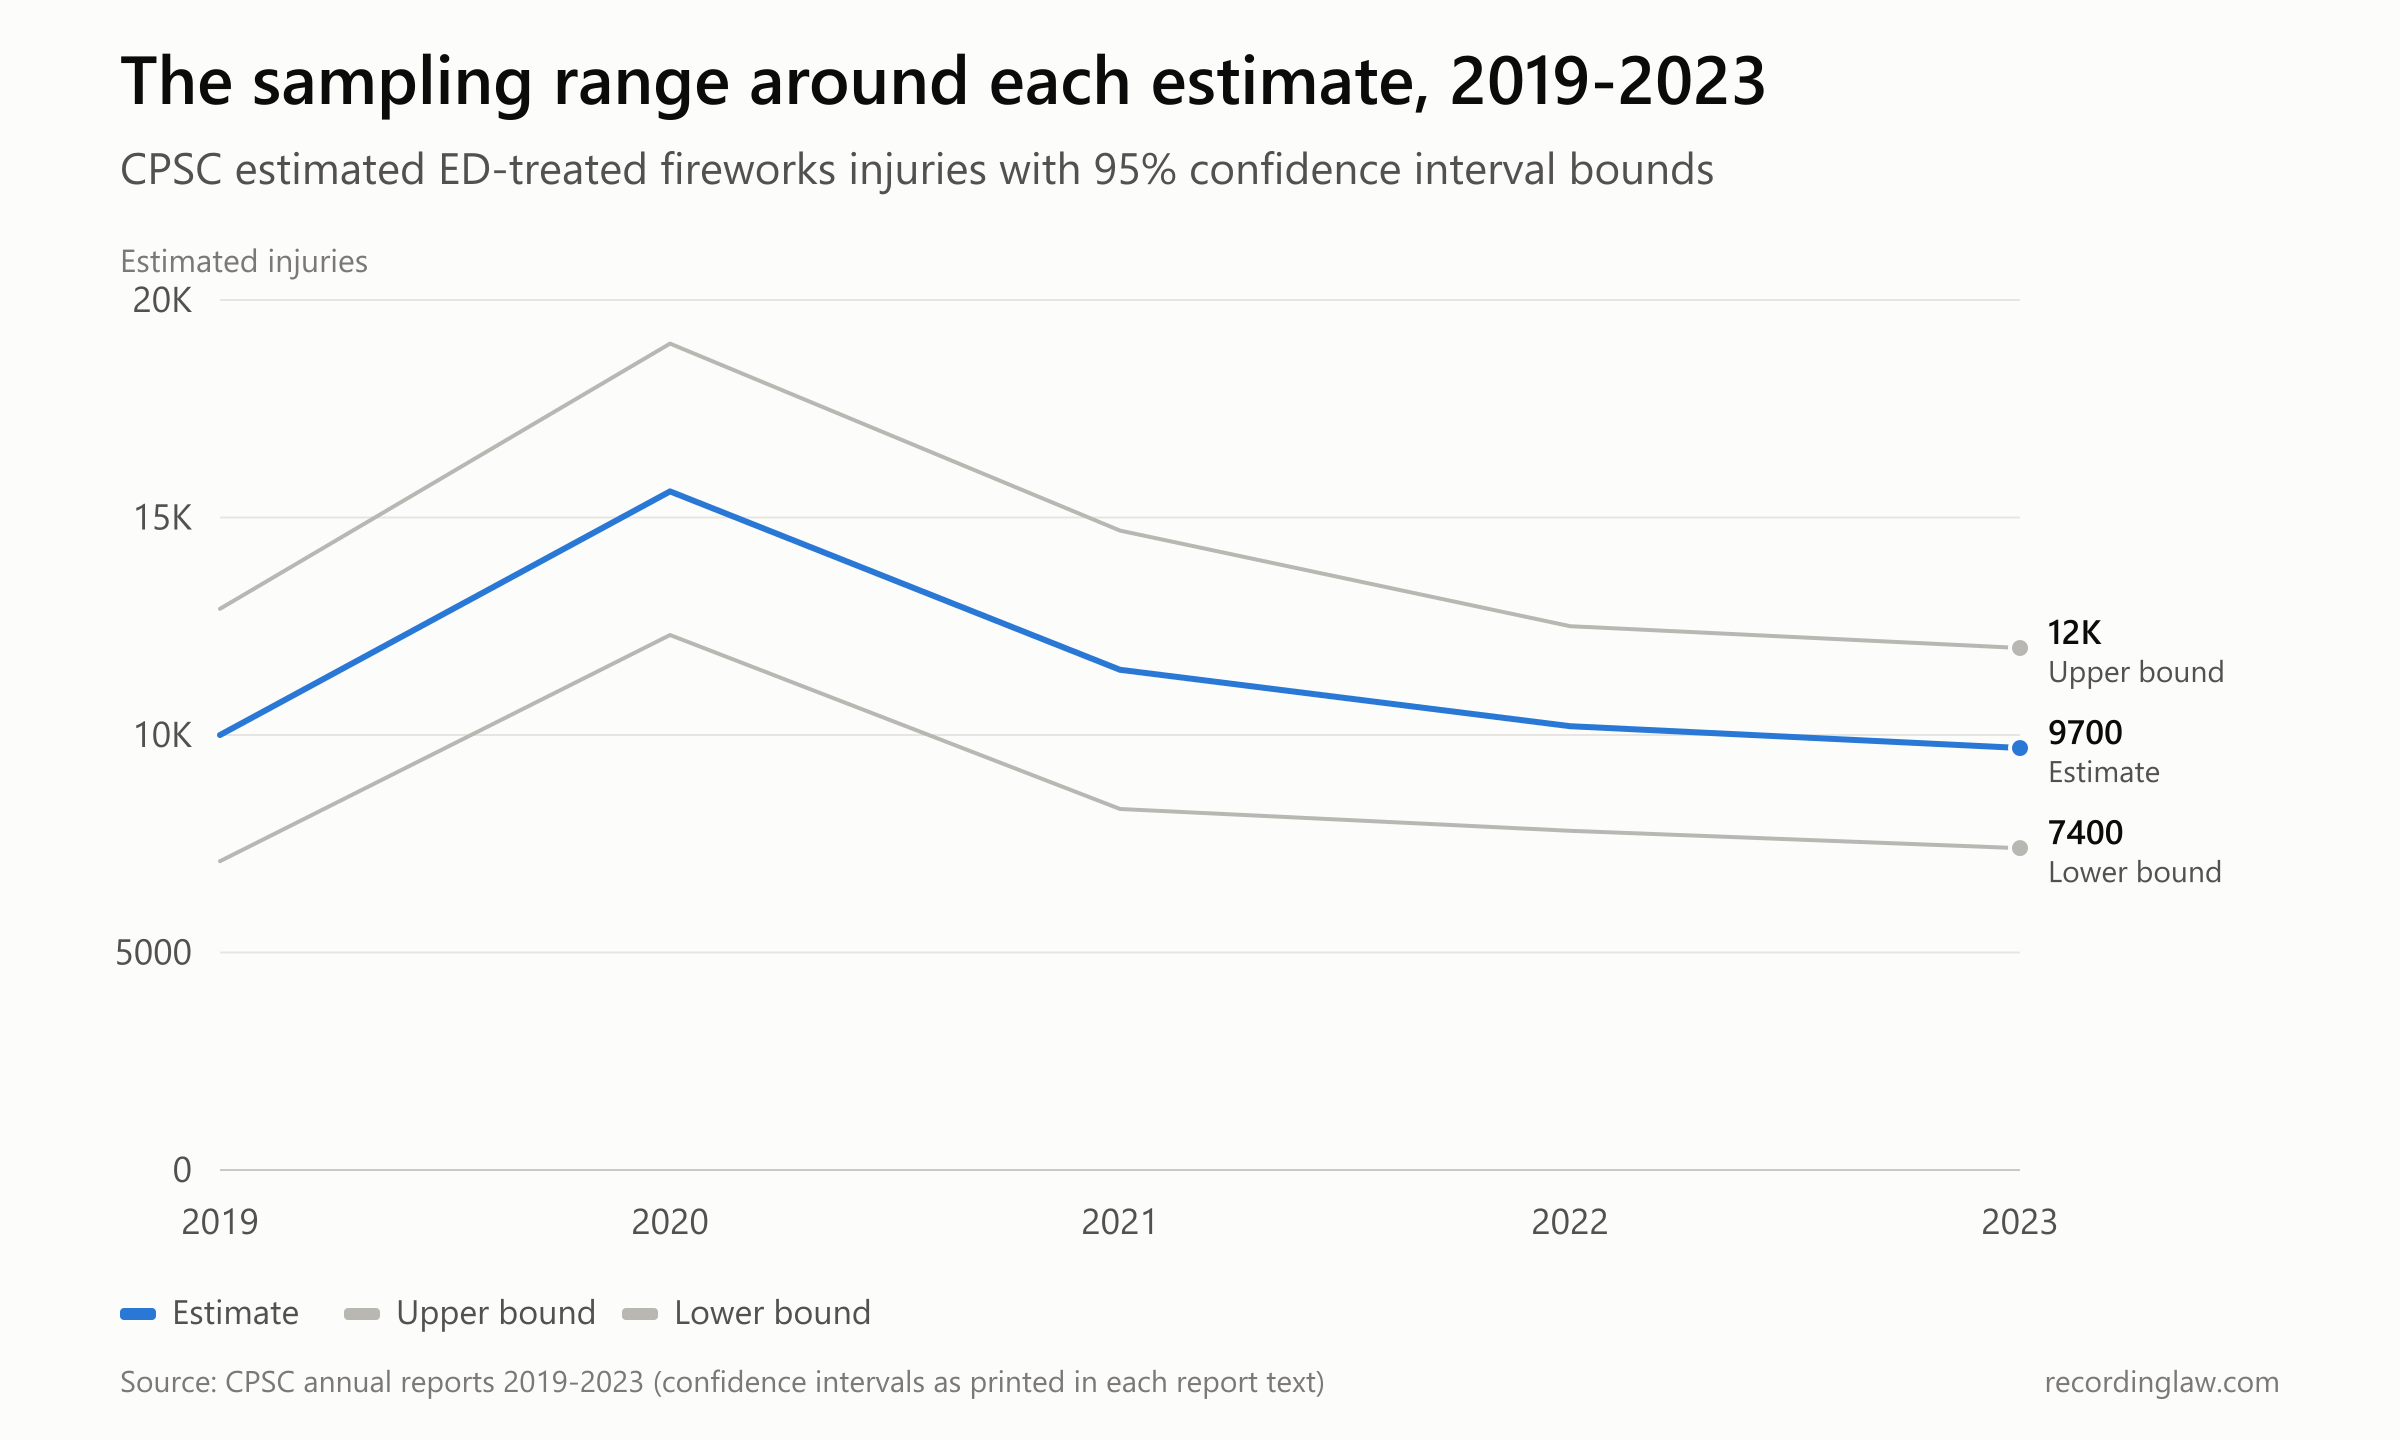
Source: CPSC Fireworks Annual Reports, 2019 through 2023 (intervals as printed in each report's text).
| Year | Estimate | 95% confidence interval |
|---|---|---|
| 2019 | 10,000 | 7,100 to 12,900 |
| 2020 | 15,600 | 12,300 to 19,000 |
| 2021 | 11,500 | 8,300 to 14,700 |
| 2022 | 10,200 | 7,800 to 12,500 |
| 2023 | 9,700 | 7,400 to 12,000 |
CPSC tests whether each new year differs from the one before. In the reports for 2019 through 2023, the changes from 2019 to 2020 (2020 report, p-value 0.0001) and from 2020 to 2021 (2021 report, p-value 0.0015) were statistically significant. The changes from 2018 to 2019 (2019 report, p-value 0.05), 2021 to 2022 (2022 report, p-value 0.2871) and 2022 to 2023 (2023 report, p-value 0.7144) were not.
The 2023 report's body text gives the upper bound for 2023 as 12,100, while its executive summary gives 12,000. The table above uses the summary figure.
When and how fireworks are injuring people
CPSC also runs a special study each year around the Fourth of July. In 2023, an estimated 6,400 injuries, or 66 percent of the year's total, were treated between June 16 and July 16 (95 percent confidence interval 4,600 to 8,200).
In that study, hands and fingers were the most often injured body part, at an estimated 35 percent. Head, face and ears followed at 22 percent and eyes at 19 percent. About 42 percent of the injuries were burns.
CPSC received reports of 8 non-occupational fireworks deaths in 2023 and says the count should be considered a minimum. Its news releases report 11 deaths in 2024 and at least 15 in 2025. Over 2008 through 2023, CPSC has reports of 159 deaths, an average of 9.9 a year.
Death counts change as reports come in. The 2020 figure was 18 in the 2020 report, 26 in the 2021 report and 24 in the 2022 and 2023 reports. The 2023 report lists 24 deaths for 2020, 15 for 2021 and 13 for 2022.
Seven state laws, 2011-2022
The laws below are examples of states that loosened consumer fireworks rules during the years the national series covers. Each date comes from the state's own legislative record. They are not a complete list of every state that changed its fireworks law in this period.
| State | Law | Date | What it did |
|---|---|---|---|
| Maine | Public Law ch. 416 (LD 83) | Signed July 1, 2011; effective January 1, 2012 | Titled "An Act To Legalize the Sale, Possession and Use of Fireworks" |
| Michigan | Michigan Fireworks Safety Act, 2011 Act 256 | Effective January 1, 2012 | Allowed sale of consumer fireworks by sellers holding a certificate |
| New York | Chapter 477 of the Laws of 2014 (S.7888) | Signed November 21, 2014; effective 30 days later | Removed sparkling devices from the definition of fireworks in a county or city (other than a city of one million or more) that opts in by local law |
| Iowa | Senate File 489 (2017 Acts ch. 115) | Approved May 9, 2017; effective on enactment | Set rules for the possession, sale and use of fireworks, including licensing of consumer fireworks sellers |
| Pennsylvania | Act 43 of 2017 (HB 542) | Approved October 30, 2017 | A person at least 18 may purchase, possess and use consumer fireworks |
| Ohio (before 2022) | Ohio Revised Code 3743.45 (48-hour rule in the version effective September 23, 2008; amended by House Bill 64, effective September 29, 2015) | 48-hour rule in force from at least September 23, 2008; HB 64 amendment effective September 29, 2015 | Residents could buy 1.4G fireworks but had to take them out of the state within 48 hours. The 2015 amendment removed the requirement that buyers complete a purchaser's form |
| Ohio (step 2) | House Bill 172 (134th General Assembly), RC 3743.45 | Effective July 1, 2022 | Allowed discharge of 1.4G fireworks bought from a licensed retailer on private property on listed days; counties, townships and municipalities may restrict or ban it |
Two of these laws are partial by design. New York's change applies only where a county or city adopts it, so it is not a statewide legalization. Ohio's 2022 law lets local governments restrict or ban discharge.
For the current rules in each of these states, see the Pennsylvania, Ohio, Iowa, Michigan, Maine and New York pages, or the state-by-state fireworks laws guide.
How much consumer fireworks Americans used
APA publishes consumption figures derived from U.S. International Trade Commission import data. By its count, consumer fireworks consumption was 186.4 million pounds in 2008, 248.9 million in 2019 and 385.8 million in 2020. It rose to 436.4 million in 2022, fell to 246.5 million in 2023 and was 298.9 million in 2025.
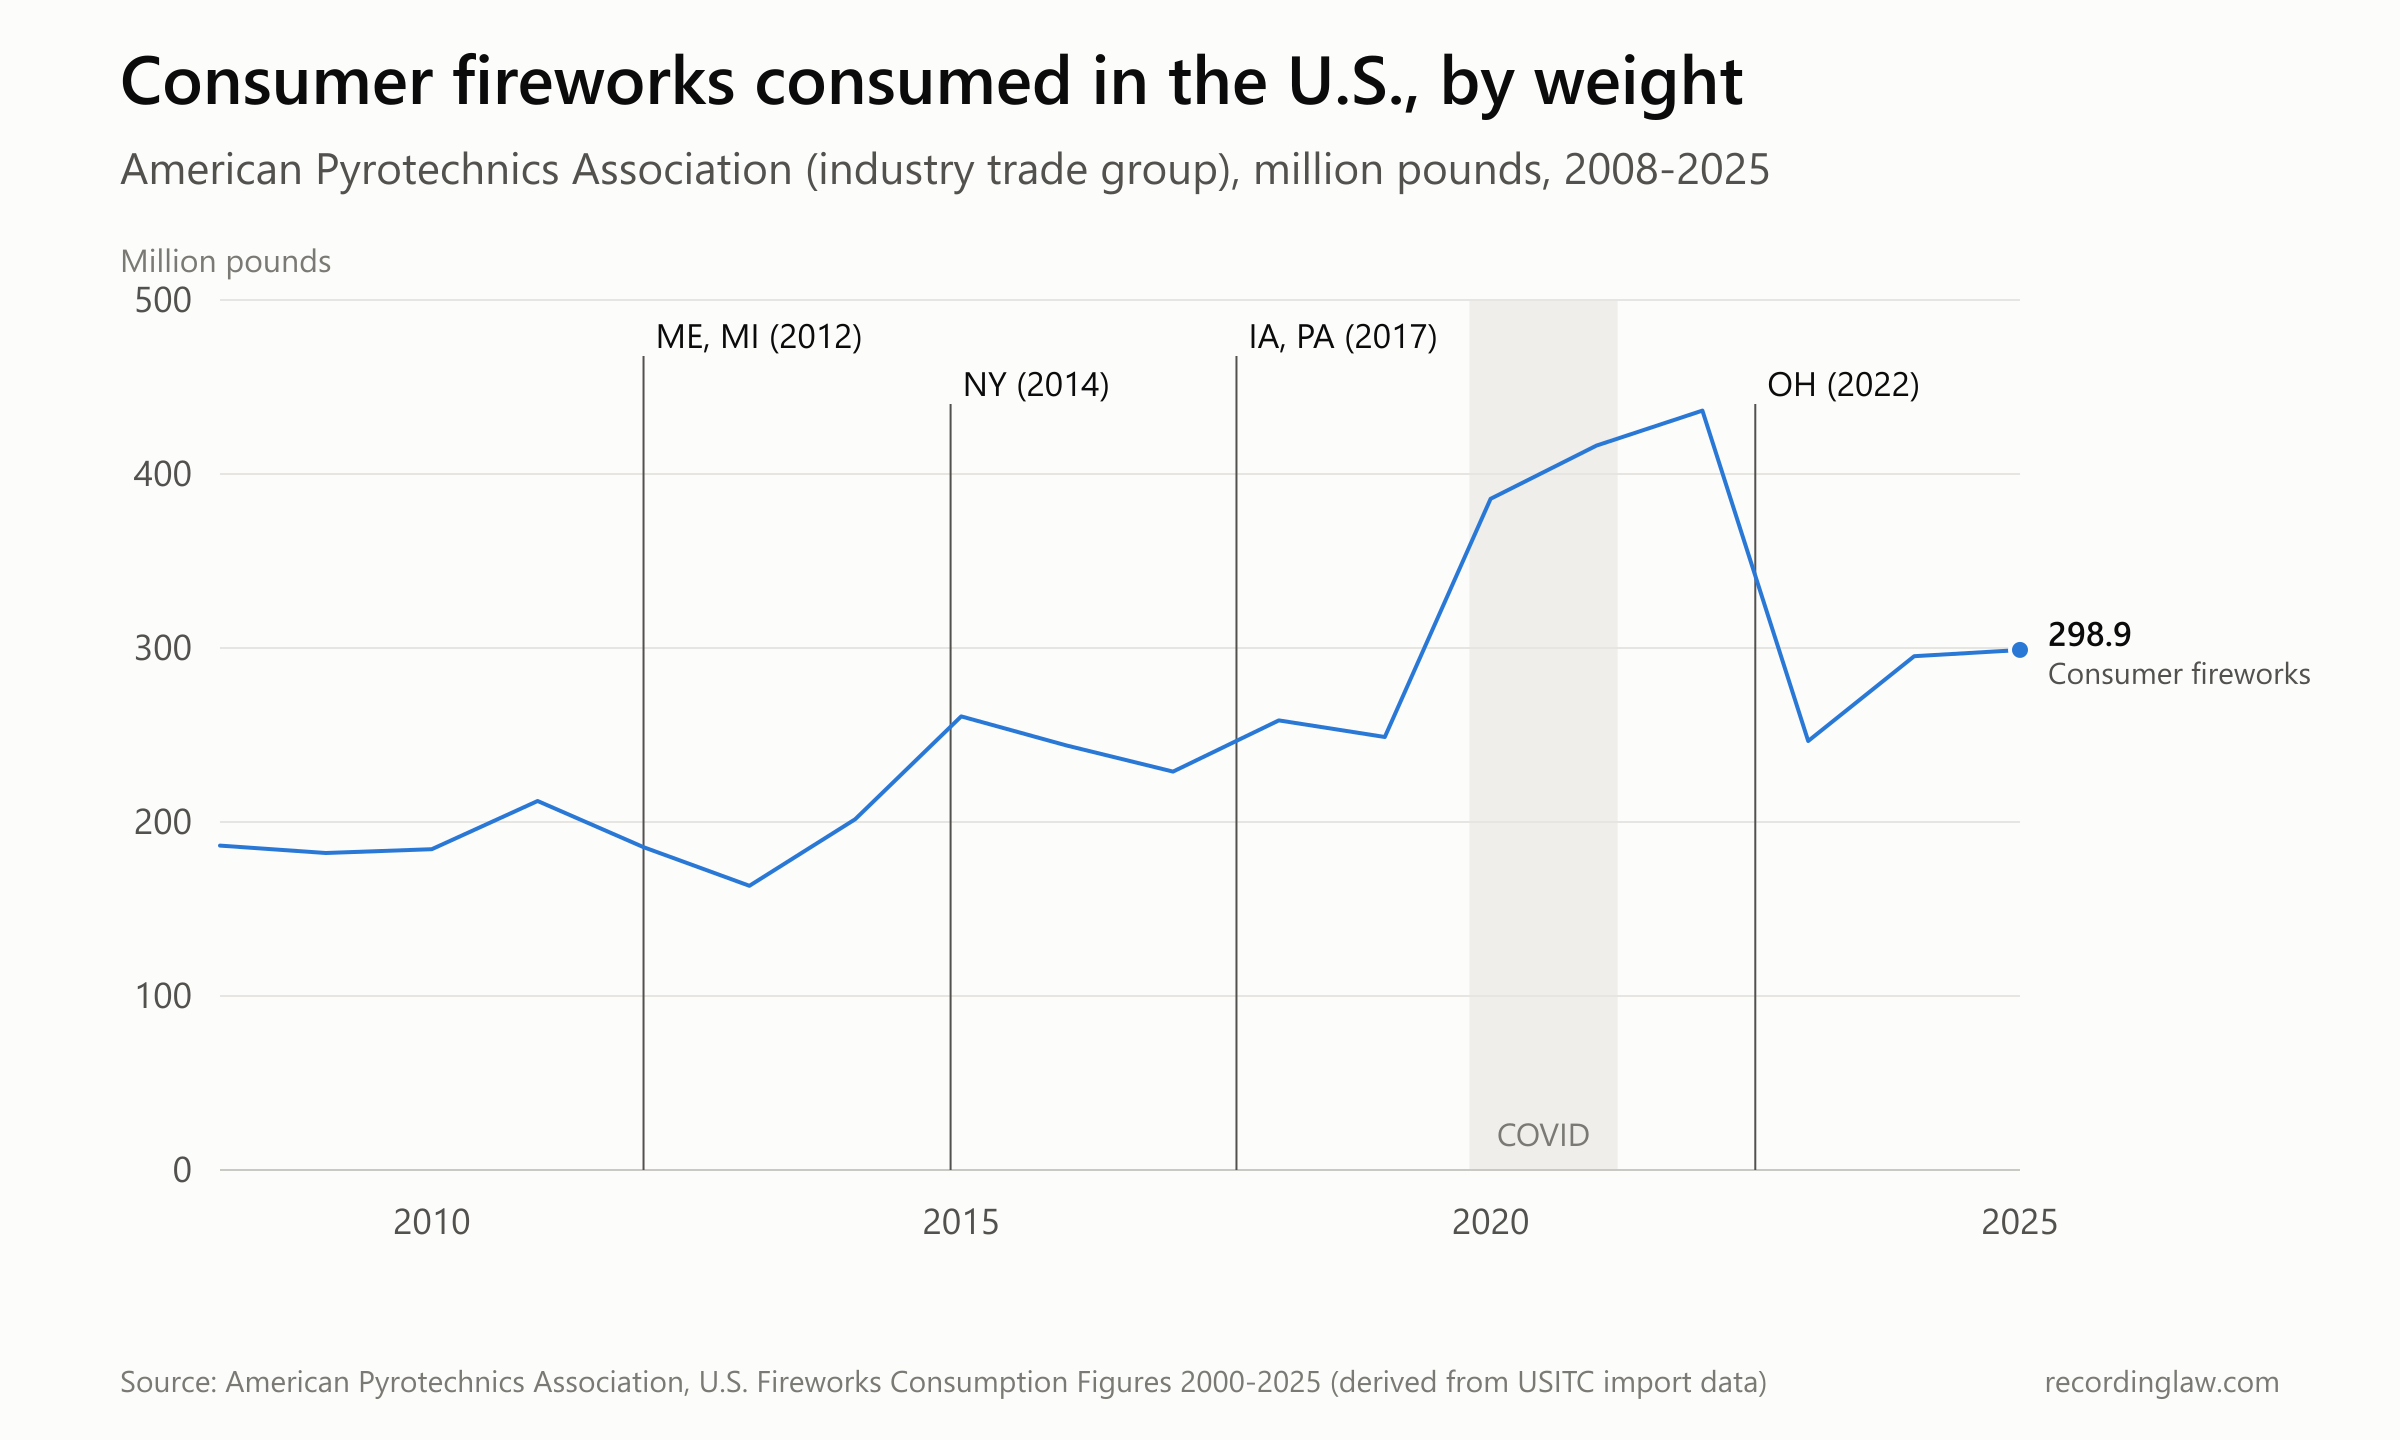
Source: American Pyrotechnics Association, U.S. Fireworks Consumption Figures 2000-2025 (industry data derived from USITC import records).
| Year | Consumer fireworks (million lb, APA) | Consumer revenue (APA, nominal) |
|---|---|---|
| 2008 | 186.4 | $627 million |
| 2017 | 229.0 | $885 million |
| 2019 | 248.9 | $1 billion |
| 2020 | 385.8 | $1.9 billion |
| 2021 | 416.3 | $2.2 billion |
| 2022 | 436.4 | $2.3 billion |
| 2023 | 246.5 | $2.2 billion |
| 2024 | 295.3 | $2.2 billion |
| 2025 | 298.9 | not in the file retrieved |
These are an industry association's figures. APA says its 2020 consumer figure includes a survey of its members, who reported an average 55 percent increase in consumption over 2019. Its revenue figures are rounded and are not adjusted for inflation.
2020 split the market in two directions. APA reports display fireworks revenue of $93 million in 2020, down from $375 million in 2019, while consumer revenue went from $1 billion to $1.9 billion. The injury estimate for 2020, 15,600, was the highest in the annual-report series.
Injuries per pound imported
CPSC divides its injury estimate by the weight of fireworks imported each year. Imports, which cover both consumer and display fireworks, were 208.3 million pounds in 2008, 255.0 million in 2020, 449.1 million in 2022 and 265.6 million in 2023.
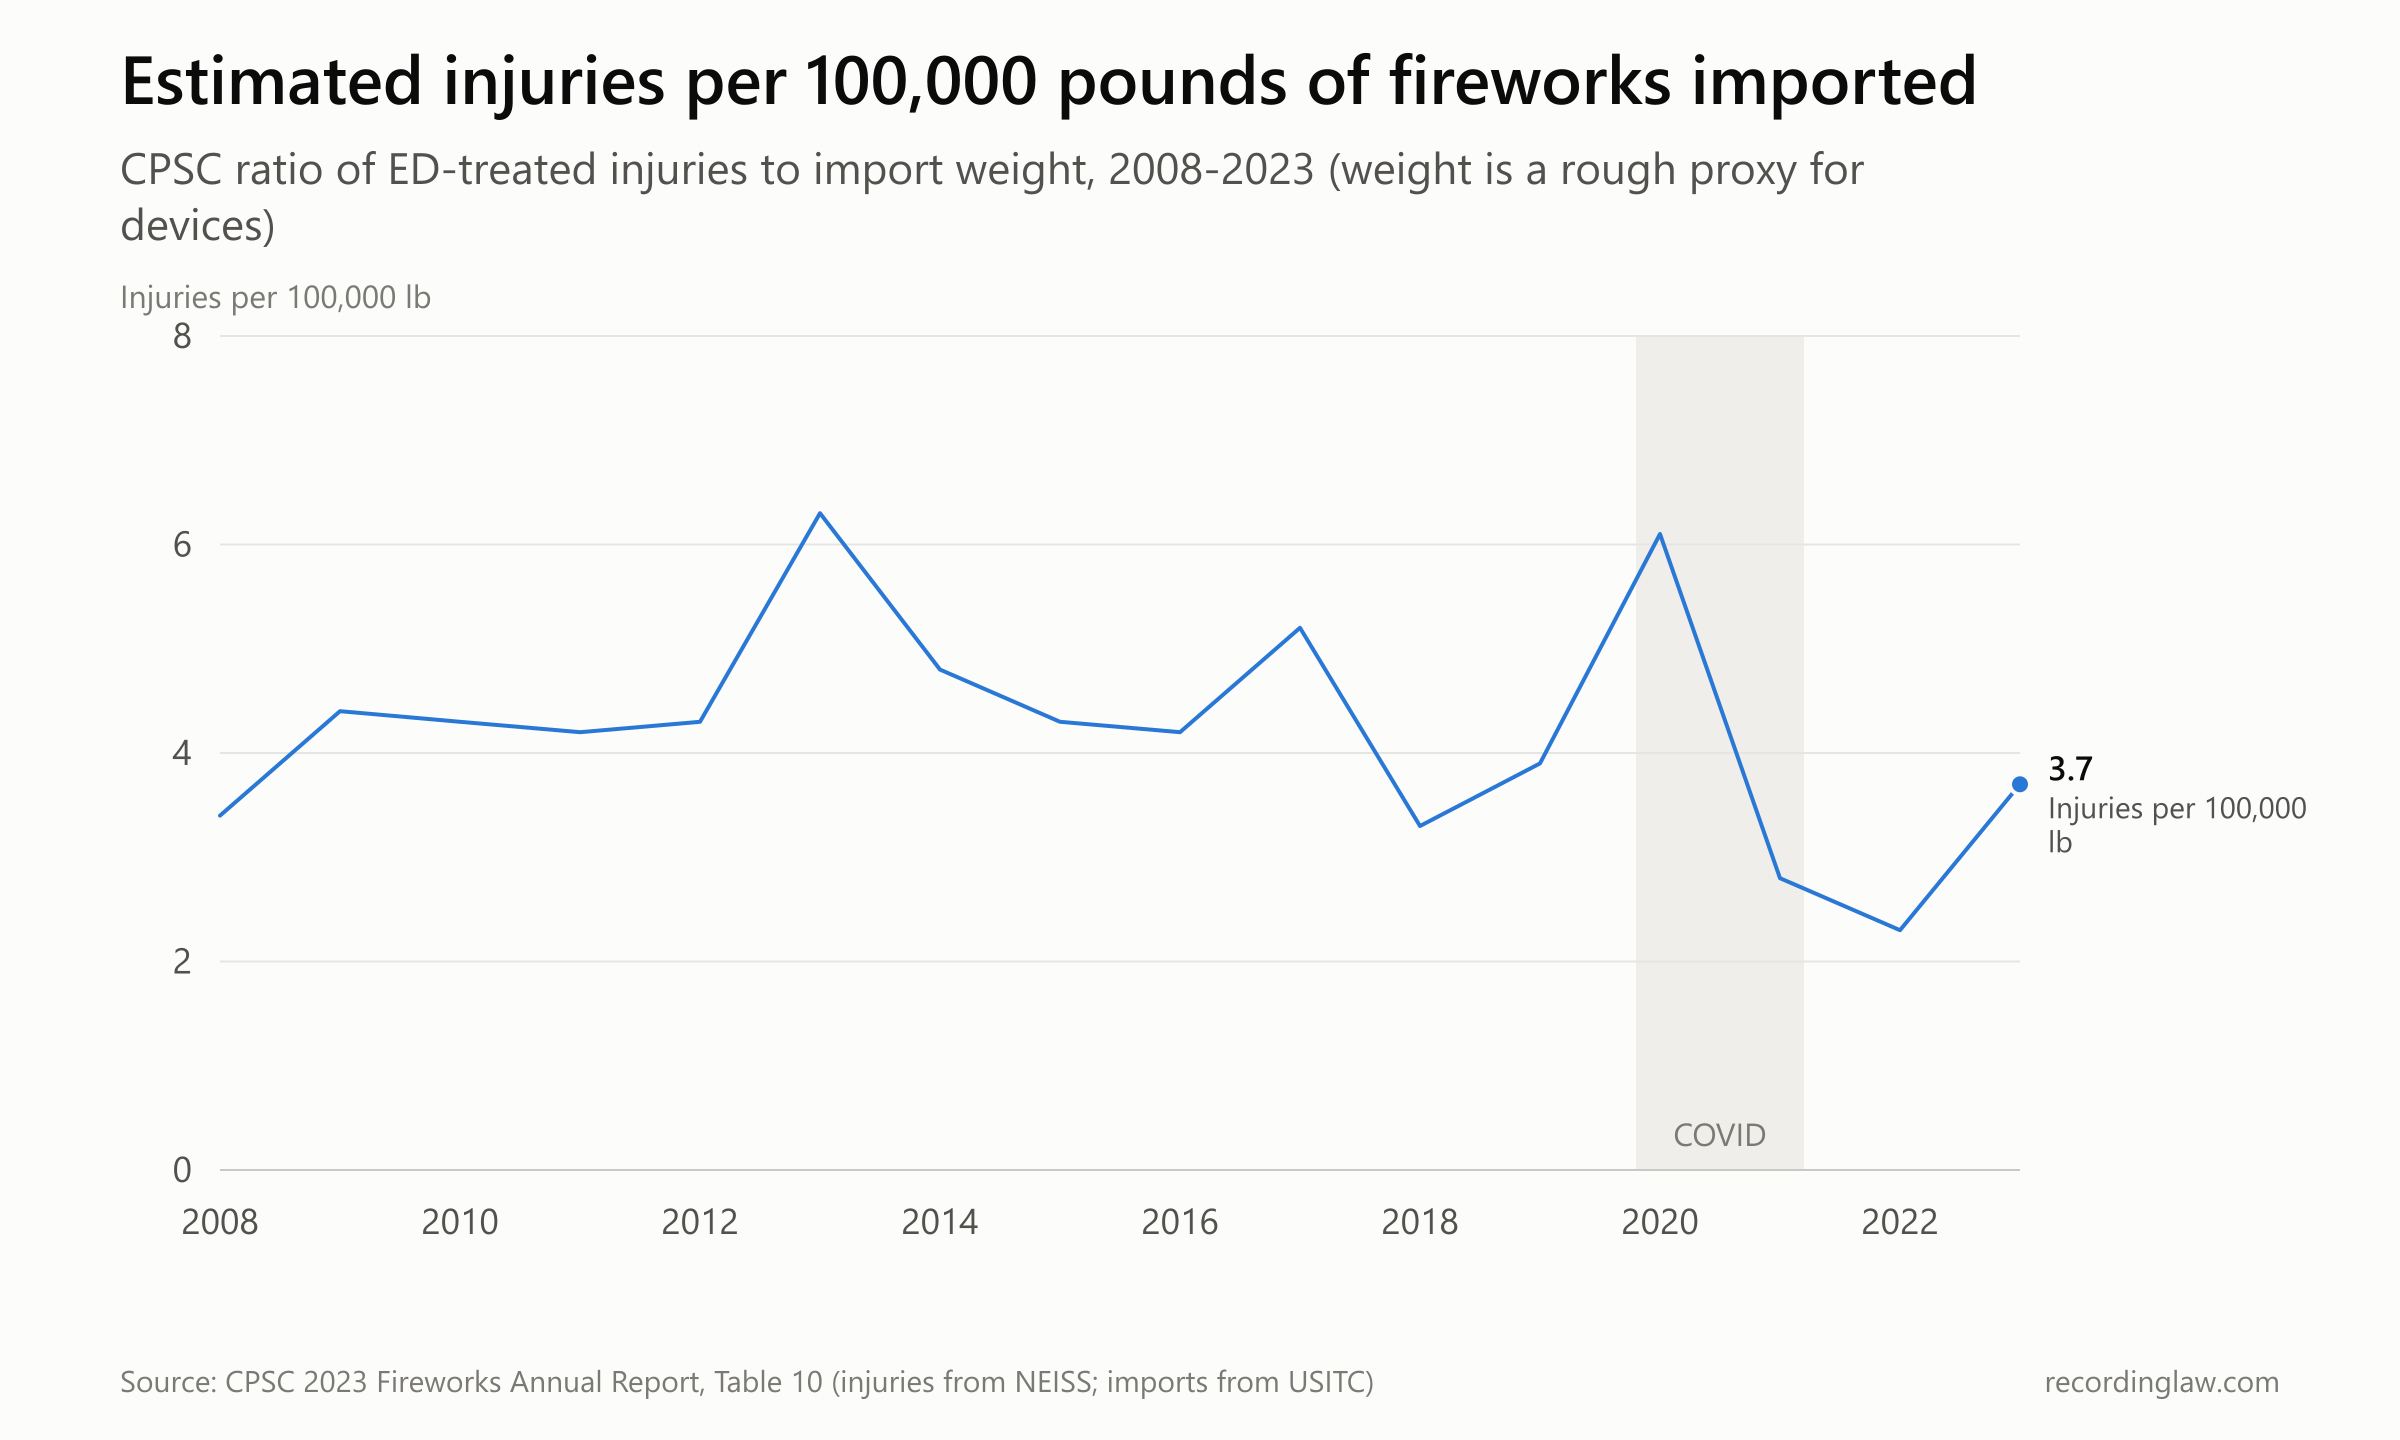
Source: CPSC 2023 Fireworks Annual Report, Table 10 (injuries from NEISS; import weights from USITC).
| Year | Imports (million lb) | Injuries per 100,000 lb |
|---|---|---|
| 2008 | 208.3 | 3.4 |
| 2013 | 180.2 | 6.3 |
| 2017 | 247.0 | 5.2 |
| 2020 | 255.0 | 6.1 |
| 2021 | 415.4 | 2.8 |
| 2022 | 449.1 | 2.3 |
| 2023 | 265.6 | 3.7 |
CPSC says this ratio should be interpreted with caution. Weight is a proxy for the number of devices, and total import weight over-represents heavy devices and under-represents light ones. A shift in the product mix can move the ratio without any change in how often people are hurt.
How we measured
Injuries. 2008 through 2023 come from the CPSC 2023 Fireworks Annual Report, Table 1, with confidence intervals and significance tests from the 2019 through 2023 annual reports. 2024 and 2025 come from CPSC news releases dated June 2025 and June 2026, which give no confidence intervals. As of October 26, 2026, CPSC's reports page lists no annual report after the 2023 edition, and intervals for 2008 through 2018 were not collected. Rates per 100,000 people are CPSC's, using U.S. Census Bureau resident population estimates (different vintages for different years).
Deaths. Taken from CPSC reports and releases as published. CPSC treats them as minimums and revises earlier years. We did not use a separate industry laboratory count for 2024, because its source document could not be opened.
Consumption and revenue. From APA, an industry trade association, which derives consumption from import data. APA's totals differ slightly from CPSC's import weights (for 2022, 461.7 million pounds of all fireworks in APA's file against 449.1 million in CPSC's table).
Laws. The seven entries come from Maine, Michigan, New York, Iowa, Pennsylvania and Ohio legislative or code sources. They are examples. We did not compile every state law change since 2008, including laws in other states that loosened or tightened fireworks rules.
What the data cannot show. All injury figures are national. CPSC does not publish state emergency-department totals, and we found no before-and-after study for any of these six states, so nothing here measures the effect of a single state's law. Other things that could affect national injuries changed over the same years, including the 2020 pandemic and its cancelled public displays, changes in the mix of products sold, and sampling error in NEISS itself. The laws are marked on the charts for timing only.
Frequently Asked Questions
Did fireworks injuries go up after states legalized consumer fireworks?
National estimates rose over the period. CPSC estimated 7,000 emergency-department-treated injuries in 2008 and 9,700 in 2023, and its 2023 report found a statistically significant upward trend of about 561 injuries per year for 2008 through 2023. Earlier reports, testing earlier 16-year windows, found about 202 per year for 2005-2020 and no significant trend for 2004-2019. Estimates for 2004 through 2007 ranged from 9,200 to 10,800. Its news releases give 14,700 for 2024 and about 13,000 for 2025. These are national figures. CPSC does not publish state totals, so the data cannot show whether any one state's law changed injuries in that state.
How many people are injured by fireworks each year in the U.S.?
CPSC estimated 9,700 emergency-department-treated injuries in 2023, with a 95 percent confidence interval of 7,400 to 12,000. Its news releases estimate 14,700 for 2024 and about 13,000 for 2025. In 2023, about 66 percent of injuries were treated between June 16 and July 16.
Why was 2020 so high?
CPSC's 2020 estimate was 15,600 injuries, the highest in the 2008-2023 series. Many public displays were cancelled during the pandemic; CPSC's 2020 report said it was possible this led consumers to set off fireworks themselves, without measuring it. APA, the industry trade group, reports display revenue of $93 million in 2020 against $375 million in 2019, while consumer revenue rose from $1 billion to $1.9 billion. The data show these happened in the same year; they do not measure how much each factor contributed.
How many people die from fireworks each year?
CPSC received reports of at least 8 fireworks deaths in 2023, 11 in 2024 and at least 15 in 2025. From 2008 through 2023 it has reports of 159 deaths, an average of 9.9 a year. CPSC treats these as minimums and revises earlier years in later reports.
Which states legalized consumer fireworks?
Examples include Maine and Michigan (laws effective January 1, 2012), Iowa (Senate File 489, May 9, 2017), Pennsylvania (Act 43, October 30, 2017) and Ohio (House Bill 172, discharge rules effective July 1, 2022). New York's 2014 law allows sparkling devices only in counties and cities that opt in. This is not a complete list; check the state-by-state guide for current rules.
Are fireworks injury numbers exact counts?
No. CPSC estimates them from a national sample of hospital emergency departments, so each figure has a range. For 2023 the 95 percent confidence interval was 7,400 to 12,000 around an estimate of 9,700. In CPSC's 2019-2023 reports, the year-to-year changes it found statistically significant were the rise from 2019 to 2020 (2020 report) and the drop from 2020 to 2021 (2021 report).
Updates
Independently fact-checked against the cited primary sources
Sources and References
- CPSC, 2023 Fireworks Annual Report (Tables 1 and 10; trend, deaths, special study)(cpsc.gov).gov
- CPSC, 2022 Fireworks Annual Report(cpsc.gov).gov
- CPSC, 2021 Fireworks Annual Report(cpsc.gov).gov
- CPSC, 2020 Fireworks Annual Report(cpsc.gov).gov
- CPSC, 2019 Fireworks Annual Report(cpsc.gov).gov
- CPSC news release, June 2025 (2024 injury and death figures)(cpsc.gov).gov
- CPSC news release, June 2026 (2025 injury and death figures)(cpsc.gov).gov
- American Pyrotechnics Association, U.S. Fireworks Consumption Figures 2000-2025 (industry data)(pyro.memberclicks.net)
- American Pyrotechnics Association, Fireworks Revenue by Industry Segment 2000-2024 (industry data)(americanpyro.com)
- Maine Public Law 2011, ch. 416 (LD 83)(mainelegislature.org).gov
- Michigan Fireworks Safety Act, 2011 Public Act 256(legislature.mi.gov).gov
- New York Senate Bill S7888 (Chapter 477 of the Laws of 2014)(nysenate.gov).gov
- Iowa Senate File 489, 2017 Iowa Acts ch. 115(legis.iowa.gov).gov
- Pennsylvania Act 43 of 2017 (HB 542)(legis.state.pa.us).gov
- Ohio Revised Code 3743.45, version effective September 23, 2008 (House Bill 562)(codes.ohio.gov).gov
- Ohio Revised Code 3743.45, version effective September 29, 2015 (House Bill 64)(codes.ohio.gov).gov
- Ohio Revised Code 3743.45, as amended by House Bill 172, effective July 1, 2022(codes.ohio.gov).gov
- CPSC, Fuel, Lighters and Fireworks reports (list of annual fireworks reports)(cpsc.gov).gov