Most Estimates Put the 2018 Opportunity Zones' Added Home-Price Growth Near Zero and Price Levels Under 1% to About 6% Higher

Independently fact-checked against primary sources (last audited November 10, 2026). · 14 primary sources cited on this page. How we verify our legal content
On March 18, 2019, Zillow's research team published a chart of home sale prices in the census tracts that the 2017 tax law had just turned into Opportunity Zones. After the zones were picked, Zillow wrote, "sale prices in Opportunity Zones started growing by more than 20 percent year-over-year." In tracts that had qualified for the program but were passed over, the same chart showed prices "growing more slowly and by single digits."
Nine months later, three economists asked the same question with a different measure. Jiafeng Chen, Edward Glaeser and David Wessel found no detectable effect of zone status on how fast single-family home prices grew. "All estimates rule out price impacts greater than 1.3 percentage points with 95% confidence," they wrote.
The estimates have spread out since then. Economists in the Trump White House reran that test with a newer release of the data. Their estimate was about twice the economists', and it was statistically significant. They put prices 1.1 percent higher after two years.
A study of tracts in large cities found zone home values 3.4 percent higher by 2020 than in comparison tracts. A study of 36.1 million home sales put the rise at 4 to 6 percent. Part of that spread lines up with which test a study ran, and part with which years and places it covered.
A growth-rate test asks whether zone prices rose faster each year than prices in comparison tracts. A price-level test asks whether, by a later year, zone prices had climbed further from their 2017 level than comparison prices had climbed from theirs. The two tests work like different rulers, and they can give different readings.
The answer had stakes on both sides. Critics warned that rising prices would push renters out of the neighborhoods the program was meant to help. Supporters counted rising prices as new wealth for the homeowners who already lived there.
The question is live again. Congress made the tax break permanent in July 2025. On November 5, 2026, Treasury designated 6,576 tracts for a new map of zones, effective January 1, 2027. Did the first round of zones raise home prices, and why do careful studies of them disagree?
Where the estimates land
How far apart are the studies once they sit on one page? The chart below places every home-price estimate in this story by the test behind it. The top group measures how much faster zone prices grew each year. The bottom group measures how much higher they ended up.
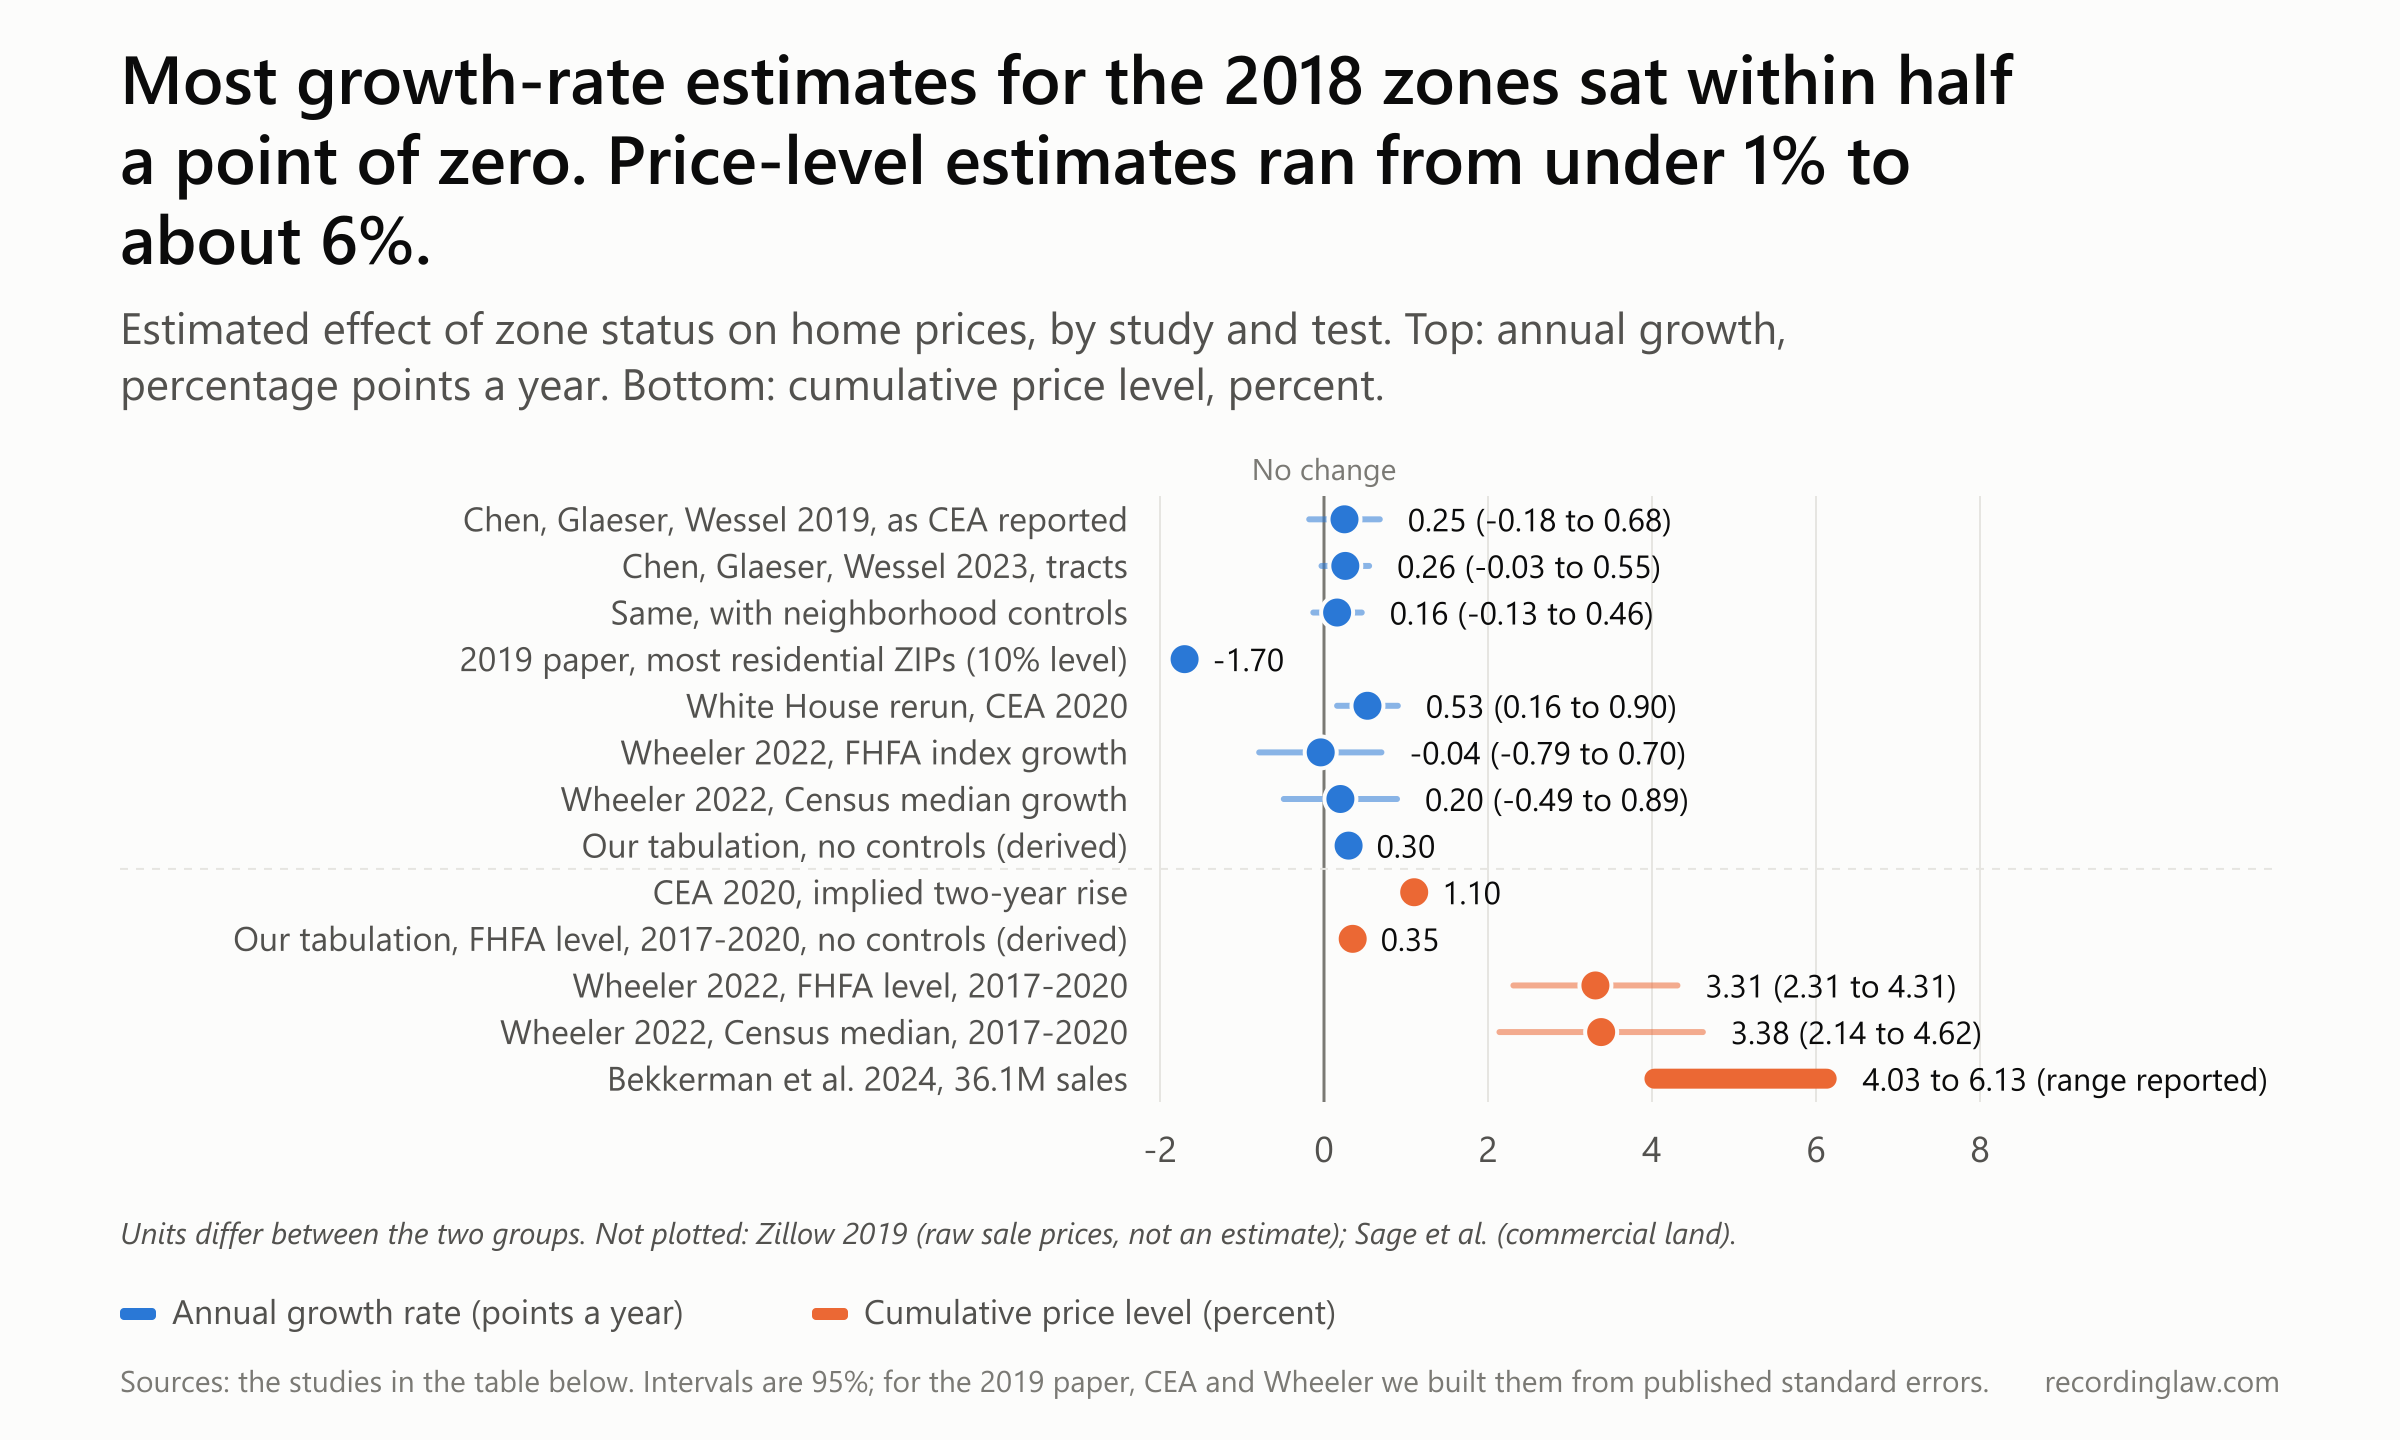
Estimated effect of zone status on home prices, by study and test, with 95 percent intervals where available. Source: the studies listed; intervals for the 2019 working paper, the Council of Economic Advisers and Wheeler built from published standard errors (see How we measured).
| Study | Test | Estimate | 95% interval |
|---|---|---|---|
| Chen, Glaeser and Wessel, 2019 working paper (as the council reported it) | Annual growth, points a year | 0.25 | -0.18 to 0.68 (ours, from standard error 0.22) |
| Chen, Glaeser and Wessel, 2023 published version, tracts | Annual growth, points a year | 0.26 | -0.03 to 0.55 |
| Same, with neighborhood controls | Annual growth, points a year | 0.16 | -0.13 to 0.46 |
| 2019 working paper, most residential ZIP codes, with controls | Annual growth, points a year | -1.7 | not given; significant at the 10 percent level only |
| Council of Economic Advisers, 2020 | Annual growth, points a year | 0.53 | 0.16 to 0.90 (ours, from standard error 0.19) |
| Wheeler, 2022, FHFA index | Annual growth, points a year | -0.04 | -0.79 to 0.70 (ours) |
| Wheeler, 2022, Census median home value | Annual growth, points a year | 0.20 | -0.49 to 0.89 (ours) |
| Our tabulation, FHFA index, no controls | Change in annual growth gap, points a year | 0.30 | none |
| Council of Economic Advisers, 2020 | Implied two-year rise, percent | 1.1 | none given |
| Our tabulation, FHFA index, 2017 to 2020, no controls | Price level, percent | 0.35 | none |
| Wheeler, 2022, FHFA index, 2017 to 2020 | Price level, percent | 3.31 | 2.31 to 4.31 (ours) |
| Wheeler, 2022, Census median home value, 2017 to 2020 | Price level, percent | 3.38 | 2.14 to 4.62 (ours) |
| Bekkerman and co-authors, 2024 | Price level, percent | 4.03 to 6.13 (range reported) | not given in the abstract |
The two groups use different units. The top half is in percentage points a year and the bottom half is in percent, so a dot in the top half cannot be read against one in the bottom half. A gap between two growth rates is given in percentage points, the plain difference between two percentages (from 10% to 12% is two points).
In the top half, every interval drawn runs from below zero to above zero, except the one for the White House rerun by the Council of Economic Advisers. In the bottom half, every estimate sits above zero.
The argument over those numbers started years before the first of them, with the people who designed the tax break.
What the tax break promised
The idea was first set out in writing in April 2015, in a white paper from the Economic Innovation Group. The group is a think tank backed by tech investors, including Napster co-founder Sean Parker. The paper's authors, the economists Jared Bernstein of the Center on Budget and Policy Priorities and Kevin A. Hassett of the American Enterprise Institute, said they had sketched "a new approach to geographically targeted economic policy that could be far more effective than those tried in the past, and at the same time appeal to policymakers of every political persuasion."
The same paper looked back at an earlier attempt. The enterprise zone "program in the 1980s did not have a significant impact on unemployment or property value in designated zones," it said.
Parker had been paying for the push since 2013. "Starting in 2013, Mr. Parker bankrolled a Capitol Hill lobbying effort to pitch the idea to members of Congress," The New York Times later reported, and "that effort was run through his Economic Innovation Group." At an Opportunity Zone conference, the Times reported, Parker said: "When you are a founder of Facebook, and you own a lot of stock," "you spend a lot of time thinking about capital gains."
On April 27, 2016, Sen. Tim Scott, a South Carolina Republican, introduced the Investing in Opportunity Act with Sen. Cory Booker, a New Jersey Democrat, and Reps. Pat Tiberi of Ohio and Ron Kind of Wisconsin. When the four reintroduced it in early 2017, their joint statement promised the bill would "unlock new private investment for communities where millions of Americans face the crisis of closing business, lack of access to capital, and declining entrepreneurship." That statement does not mention home prices.
The bill was folded into the Tax Cuts and Jobs Act that December. An investor with a capital gain could put it into an Opportunity Fund and defer the tax.
An investor's basis is the figure a taxable gain is measured from, so a higher basis leaves less gain to tax. After five years, the investor's basis rose by 10 percent, and after seven years by 15 percent. Gains on the fund investment itself went untaxed if it was held for 10 years.
On December 18, 2017, Congress's scorekeeper, the Joint Committee on Taxation, put the net cost at $1.6 billion over the 10 years from 2018 to 2027. Its table showed the government losing $1.2 billion to $1.7 billion a year in fiscal 2018 through 2025. Then it showed the government gaining $8.1 billion in fiscal 2026 and $2.7 billion in 2027, when deferred gains come due.
Governors picked the zones from tracts that met the income test, and Treasury certified them. When the last states' lists were certified on June 14, 2018, Treasury Secretary Steven T. Mnuchin called the zones "one of the most significant provisions of the Tax Cut and Jobs Act" and said that incentivizing private investment in them "can be transformational."
The roughly 8,700 tracts had an average poverty rate over 32 percent, Treasury said, against 17 percent for the average census tract. Nearly 35 million Americans lived in them.
The sponsors had talked about businesses, capital and jobs. The program's critics were watching the price of a house.
Why critics watched home prices
The warnings started before the map was final. In a March 15, 2018 letter to California Gov. Jerry Brown, the Greenlining Institute and a coalition of California advocacy groups called the program "one potential silver lining" of the tax law. They also wrote that "the Opportunity Zone initiative has the potential to exacerbate the gentrification and displacement process that is devastating precariously housed families all over the state." They asked the state to prefer zones "in places that have anti-displacement measures in place."
In December 2018, the Philadelphia Inquirer described a market already moving on North Broad Street. A broker told the paper his firm was devoting "almost half of [its] time on a daily basis to opportunity zone developments," and an agent described bidding wars for parcels that had drawn little interest before.
Adam Looney, a Brookings Institution economist, gave the paper both cases. Private capital could bring investment that "improves home values for local residents who own their property," he said. "But there is clearly a potential for displacement. If investors come in and basically flip houses ... or local residents can no longer afford their rents, then it's not clear that they would be better off."
A year later, the Institute on Taxation and Economic Policy, a left-leaning tax think tank, called for repeal. Opportunity Zones did not differ fundamentally from earlier programs such as Enterprise Zones and New Market Tax Credits, it wrote in December 2019, adding: "These programs put Black and Latino families at risk of displacement by accelerating gentrification."
A second worry was which tracts governors chose. In Detroit, ProPublica reported in October 2019, Treasury revised its eligibility list in early 2018 and a downtown tract dense with buildings owned by Quicken Loans founder Dan Gilbert became eligible.
"Its median family income was almost 1 1/2 times higher than the opportunity zone eligibility requirements allowed, according to census data," ProPublica wrote. Michigan's governor designated it in April.
Across Detroit, ProPublica found, "Of the 10 most impoverished areas in the city that the governor could have picked, only two made the cut. Of the 10 least impoverished areas, six were picked." Gilbert had joined the Economic Innovation Group's "Founders Circle" in 2015. His companies said they "did not exercise any inappropriate influence," and Treasury said officials who work on the program "had no knowledge of this matter."
Nationally, the record pointed the other way on poverty. The Government Accountability Office found that "on average, the selected tracts had higher poverty and a greater share of non-White populations than eligible, but not selected, tracts."
Supporters answered the gentrification charge with their own counts. "More than 96 percent of the total zones did not show any signs of gentrification at the time they were nominated," Scott said in late 2019. John Lettieri, who leads the Economic Innovation Group, wrote in 2021 that "less than 4 percent, according to two separate studies" of zone neighborhoods had been going through the rapid change associated with gentrification when they were designated.
The number both sides argued over had arrived well before those rebuttals, in March 2019, from Zillow.
A 20 percent jump, and what it measured
Zillow's chart put a large number on zone home prices within a year of the map. It compared three kinds of tracts: the new zones, tracts that qualified but were not picked, and everything else. "Compared to similar tracts that were not selected, real estate sale prices are increasing at a faster rate in Opportunity Zones following their selection," its researchers wrote.
The measure was a 12-month moving average of all arm's-length sale prices. Chen, Glaeser and Wessel later pointed out that it did not control for changes in the quality of the homes sold.
Zillow flagged a limit of its own. In all eligible tracts, it noted, year-over-year price growth had started climbing months before the tax law, the Tax Cuts and Jobs Act (TCJA), passed. It added that "the yellow and green lines moving upwards together in late 2018 may not have been solely due to TCJA and may indicate broader real estate trends in low-income areas." It still read the gap that followed as a sign of demand: "the divergence after the final selection of Opportunity Zones provides an early signal of demand."
Zillow also summarized the skeptics. "Others fear the incentives may concentrate residential redevelopment in communities already vulnerable to gentrification and displacement, without many guardrails to mitigate undesirable outcomes," it wrote.
In October 2019, ProPublica's Detroit story said that "Multiple studies have found that property values in opportunity zones increased because of the tax break." The studies it linked measured commercial property and development land, not homes.
One of them, by Alan Sage, Mike Langen and Alex van de Minne, later published in Real Estate Economics, found that qualifying commercial properties rose 7 to 20 percent in price and vacant land up to 37 percent. "Our results show that tax breaks are priced efficiently," the authors wrote, and they found "limited signs of expected land value appreciation."
Home prices were a separate question. In December 2019, the National Bureau of Economic Research posted a paper aimed squarely at it.
One growth-rate test, two readings
Chen, Glaeser and Wessel set out to measure prices without the mix-of-homes problem in Zillow's average. They used the Federal Housing Finance Agency (FHFA) tract-level repeat-sales index of single-family home prices, which tracks the same houses each time they sell, so a run of bigger or nicer homes coming to market does not push it up.
Theirs was a growth-rate test. They compared annual price growth in zone tracts with growth in low-income tracts that qualified but were not picked, and with each zone's nearest neighbors.
Their working paper ruled out effects above 1.3 percentage points a year, "suggesting that, so far, home buyers don't believe that this subsidy will generate major neighborhood change." The published version, in the Journal of Urban Economics in 2023 with price data through 2020, narrowed that. "Our most credible estimates rule out price impacts greater than 0.5 percentage points with 95% confidence," it said.
The tract-level estimate in that version was 0.26 points a year, with a range from slightly below zero to about 0.55. With neighborhood controls added, it fell to 0.16.
The economists also found one place where zone status moved prices down. Their working paper looked at the most residential ZIP codes, those with the fewest local jobs per resident. In those ZIP codes, with controls, zone status lowered price growth by about 1.7 points, an estimate significant only at the 10 percent level. "Opportunity Zone status reduces prices in areas with little employment, perhaps because buyers think that subsidizing new investment will increase housing supply," they wrote.
They found "a small positive impact of OZ on the number of permits, but not on the number of permits relative to the stock of housing in 2010." And they took on Zillow directly: "the pre-2017 trends in prices between their treatment and control samples do not appear to be parallel."
The federal index has a gap of its own. Of the 8,534 low-income tracts that became zones, the authors counted 3,806 with any price data from 2014 to 2020, and 2,917 with data for the whole period. Fewer than half of the zones are in the measurement at all.
What does that index show if the three groups of tracts are simply lined up side by side? We pulled the same FHFA file, now running through 2025, and averaged the yearly change for tracts with data every year from 2014 to 2020.
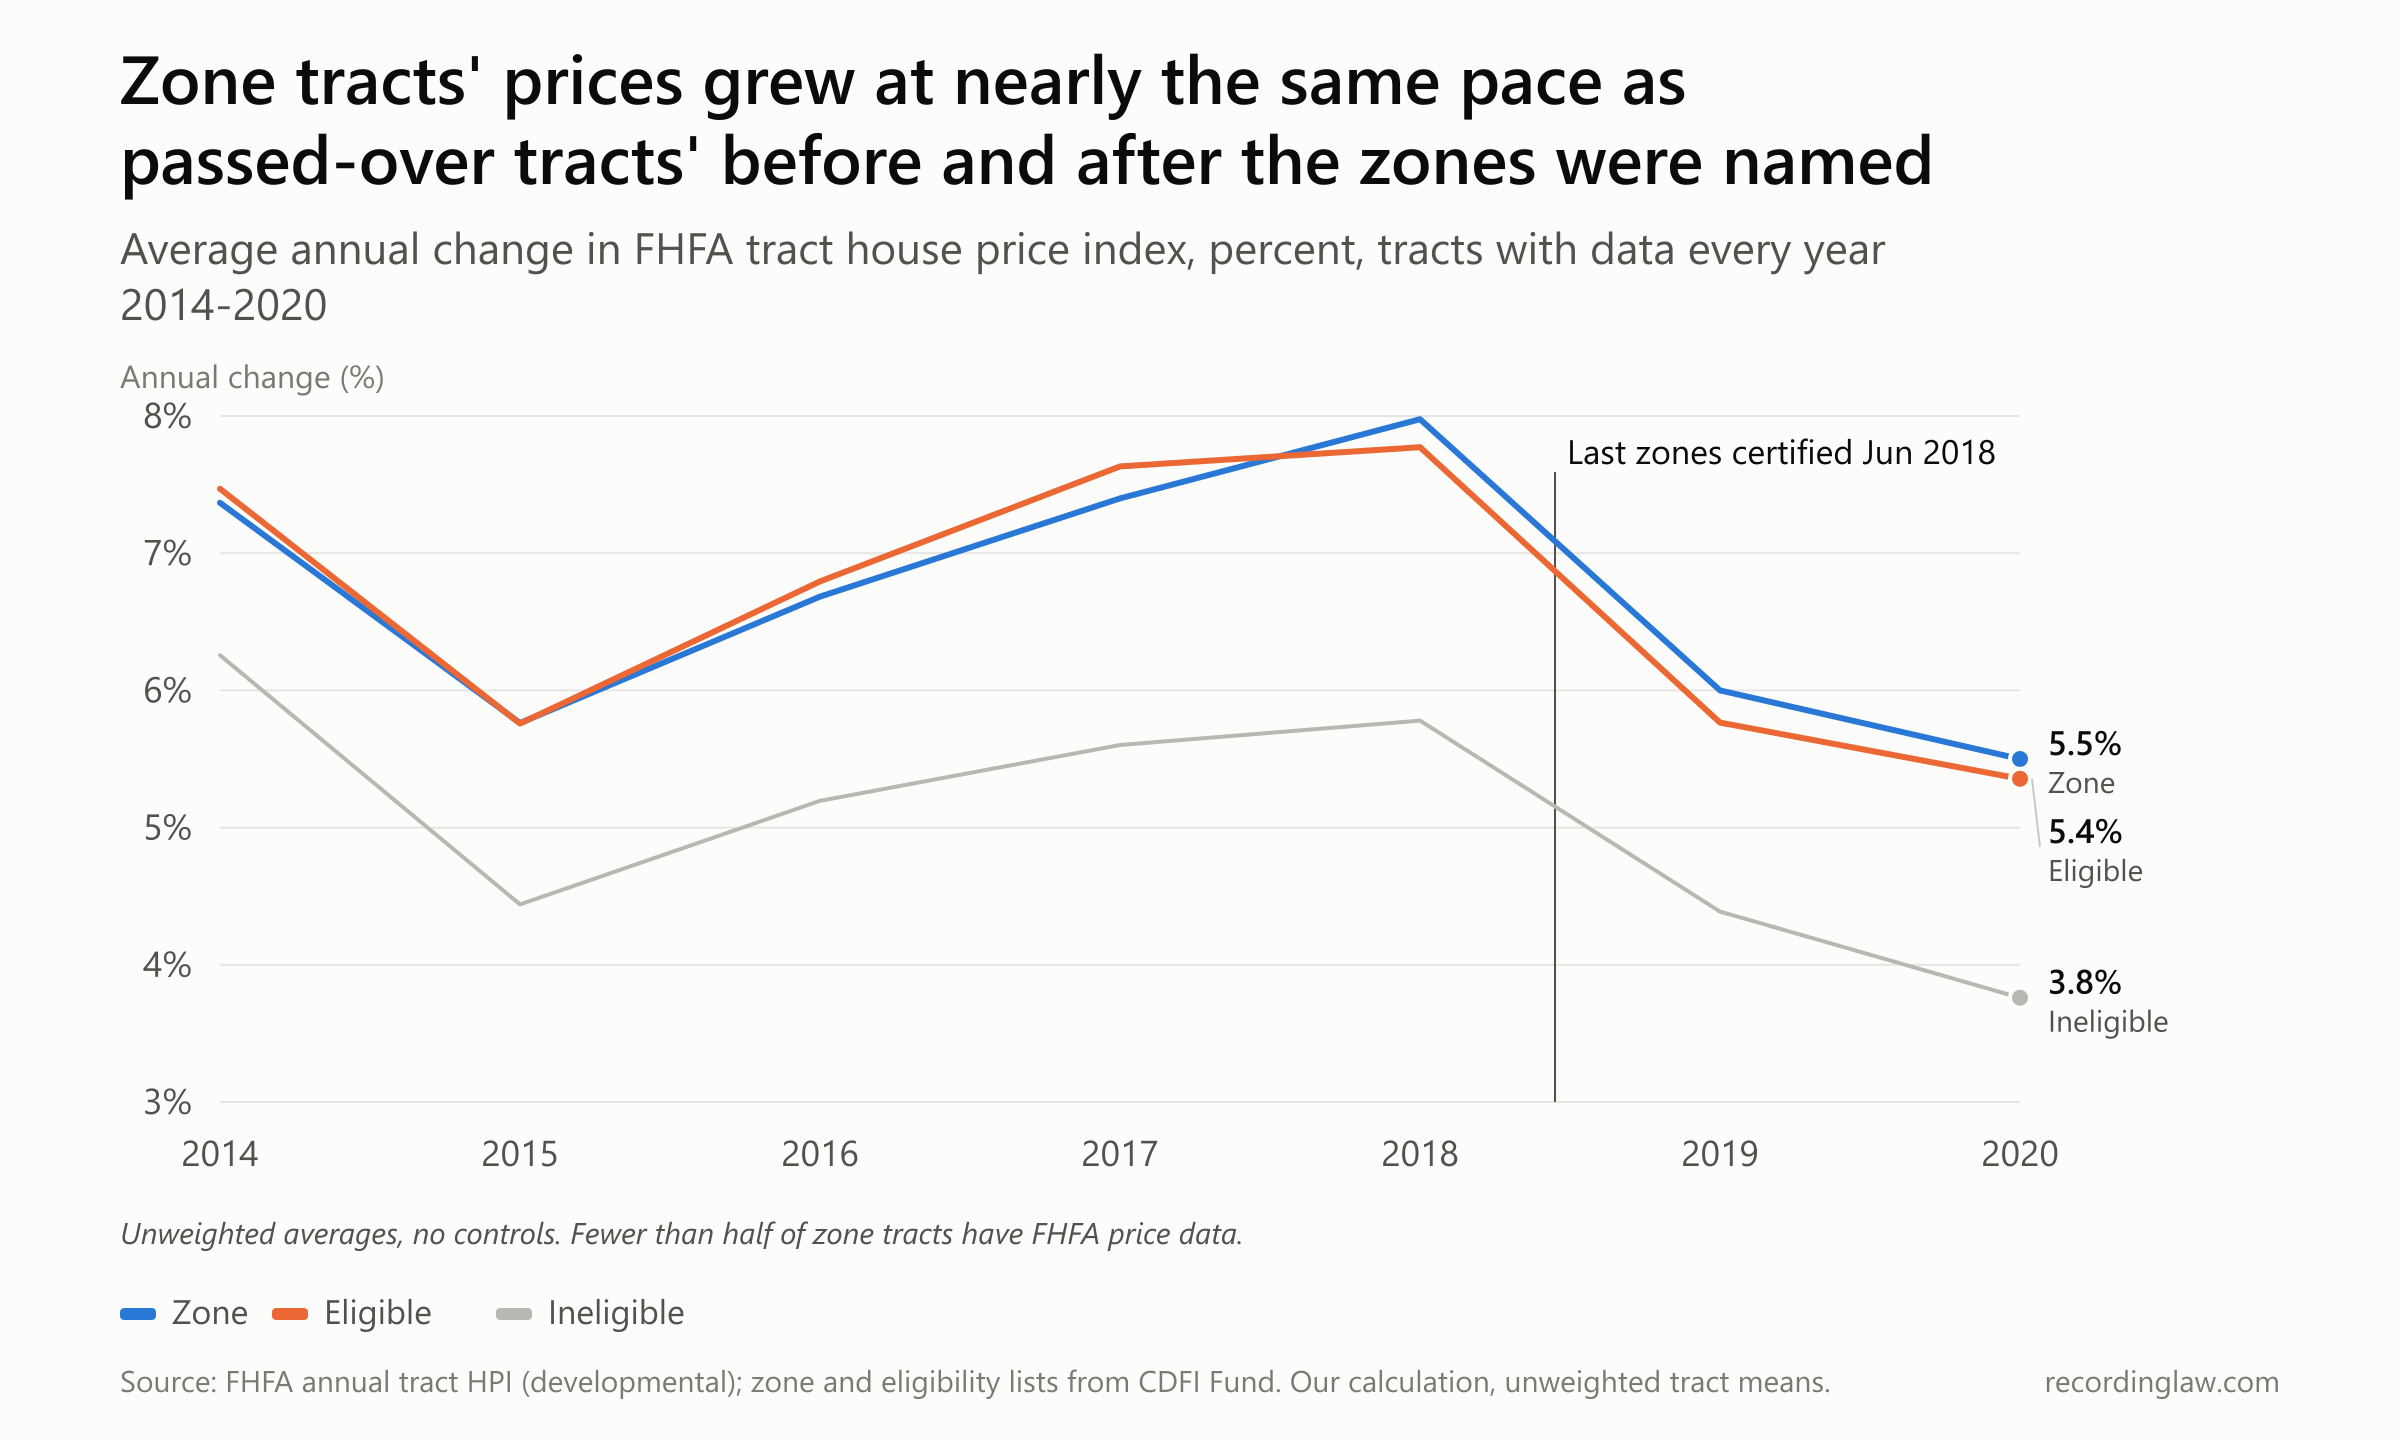
Average annual change in FHFA tract house price index for zone, eligible-not-selected and never-eligible tracts, 2014-2020. Source: FHFA; CDFI Fund; our calculation.
| Year | Zone tracts | Eligible, not selected | Ineligible |
|---|---|---|---|
| 2014 | 7.37% | 7.47% | 6.26% |
| 2015 | 5.76% | 5.76% | 4.44% |
| 2016 | 6.68% | 6.80% | 5.20% |
| 2017 | 7.40% | 7.63% | 5.60% |
| 2018 | 7.98% | 7.77% | 5.78% |
| 2019 | 6.00% | 5.77% | 4.39% |
| 2020 | 5.50% | 5.36% | 3.76% |
Zone tracts and the tracts passed over for them grew at nearly the same pace before and after the zones were named. Zone tracts trailed by about a tenth of a point a year from 2014 to 2017. They led by about two tenths from 2018 to 2020. That is a swing of about 0.3 points, close to the 0.26-point tract estimate in the economists' published version.
Eight months after the working paper appeared, the White House had a number of its own.
In August 2020, the White House Council of Economic Advisers reran the economists' test and read the result as a gain. "We replicate and extend the analysis done by Chen, Glaeser, and Wessel," its report, "The Impact of Opportunity Zones: An Initial Assessment," said. It used FHFA data released in May 2020 and compared 2,700 zones with 10,288 passed-over tracts.
"With the updated and expanded data, we estimate that OZ designation led to a higher annual appreciation of 0.53 percent," the council wrote. Over two years, it said, that "implies a roughly 1.1 percent" rise.
The working paper's base estimate, as the council described it, had been 0.25 points a year (standard error 0.22), with models ranging from 0.09 to 0.74. The figure in parentheses is the standard error, the study's estimate of how much its figure would typically vary by chance if the study were repeated with new data.
Unlike that estimate, the council's 0.53 (standard error 0.19) was statistically significant at the 5 percent level. The council's 0.53 was about twice the working paper's 0.25.
The council's estimate of 0.53 points a year was below the 1.3-point ceiling that the working paper had set. So the two did not conflict on the numbers. Later, the published version's most credible estimates set a lower ceiling of 0.5 points, just under the council's 0.53.
In that version, the economists said the gap between their estimates and the council's came from the council's use of first differences of the price index where they used successive ratios, and from their own added 2020 data. They also said the gap was "within the variation across specifications that we consider."
The council also read the result differently. "The CEA estimates that Opportunity Zone designation alone has caused a 1.1 percent increase in housing values," the council wrote, and "for the nearly half of OZ residents who own their homes, the increase provides an estimated $11 billion in new wealth." It also projected that the money already raised "could lift 1 million people out of poverty."
Each side of the debate could now point to a price rise. To the administration's economists, it was homeowner wealth. To the Greenlining coalition, Looney and others, it was the displacement risk they had warned about. Five years later, the Economic Innovation Group would cite a price rise as a sign of success, pointing to a study that found the zones "raised housing values without any corresponding increase in rents."
That study came from a graduate student at Berkeley who used the other ruler.
How far, not how fast
The next study ran the price-level test, asking how far prices had moved, not how fast. Harrison Wheeler, then a doctoral student at the University of California, Berkeley, built a dataset of development projects in tracts across the largest U.S. cities, about 12,000 tracts in 47 cities. His job-market paper, in its November 2022 version, was supported by a National Science Foundation fellowship, Berkeley's Opportunity Lab and its Fisher Center for Real Estate and Urban Economics.
Measured that way, from 2017 to 2020, zone home values came out 3.4 percent higher than in the passed-over tracts. "I also find that despite the increased supply of housing, median home values also increase 3.4% in OZs by 2020, relative to 2017," he wrote.
Then he ran the growth-rate test on his own data, with the FHFA price index and with Census (ACS) median home values. "Consistent with their findings, neither annual growth in the FHFA home price index or the ACS median home values significantly increased," he wrote of Chen, Glaeser and Wessel.
Wheeler's own tables put the two rulers side by side, though not on identical samples. All four of his estimates are also on the chart near the top of this story.
| Measure | Estimate | Standard error (points) |
|---|---|---|
| FHFA price index, log level, 2017 to 2020 | 3.31% | 0.51 |
| Census (ACS) median home value, log level, 2017 to 2020 | 3.38% | 0.63 |
| Census (ACS) median home value, annual growth | 0.20% | 0.35 |
| FHFA price index, annual growth | -0.04% | 0.38 |
In Wheeler's data, the level estimates come out above 3 percent and the growth-rate estimates near zero, though the two tables use different years and controls. Wheeler gave two reasons for the difference with the earlier study: "1) my sample contains all neighborhoods within the largest U.S. cities, for which I have already documented a strong new development response, and 2) I focus on changes in the log level of home values rather than changes in the annual rate of housing price growth." When he applied the level approach to the earlier study's own price measure, he wrote, "I use the log level of their home price measure and find a nearly identical difference-in-differences estimate for OZ home value appreciation from 2017 to 2020."
His other findings bear on the displacement warning. "Rents remain stable from 2018 to 2020," he wrote. And zone status raised the monthly probability of new development in a tract by 2.9 percentage points, or 20.5 percent.
A third study, published in 2024 in Manufacturing & Service Operations Management by Ron Bekkerman and four co-authors, used 36.1 million residential transactions in all 50 states from 2010 to 2019. "We find that the OZ program increased real estate prices by 4.03%-6.13% but do not observe a significant effect on the transaction volume," they wrote.
The same study found a pattern in how tracts were picked. "Counterintuitively, however, tracts with a higher average real estate price were also more likely to be selected," the authors wrote. Their data come from a proprietary dataset whose provider is not named in the abstract.
In February 2026, the Economic Innovation Group added a supply-side study. It estimated that zone designation added about 416,000 active and vacant residential addresses, or 47.5 per designated low-income tract, by early 2025. Its authors disclosed that "the Economic Innovation Group was the source of the initial white paper proposing Opportunity Zones," and that the paper had no external funding.
That paper argued that price studies alone cannot settle the question. "The lack of a clear prediction on prices makes it impossible to interpret the price effects found in a study if the same study fails to account for quantities," it said, naming Chen, Glaeser and Wessel.
The published price studies stop in 2019 or 2020. What happened after that?
Five more years of the index
With five more years of sales, the federal index shows zone tracts edging ahead of the tracts passed over for them, from a starting point that was already moving. Our second tabulation follows tracts with FHFA data every year from 2014 to 2025: 1,502 zone tracts and 6,439 passed-over tracts. For each year it shows how far zone prices had moved from their 2017 level, minus how far passed-over prices had moved from theirs.
The chart below shows where the zone tracts ended up, relative to the tracts passed over for them.
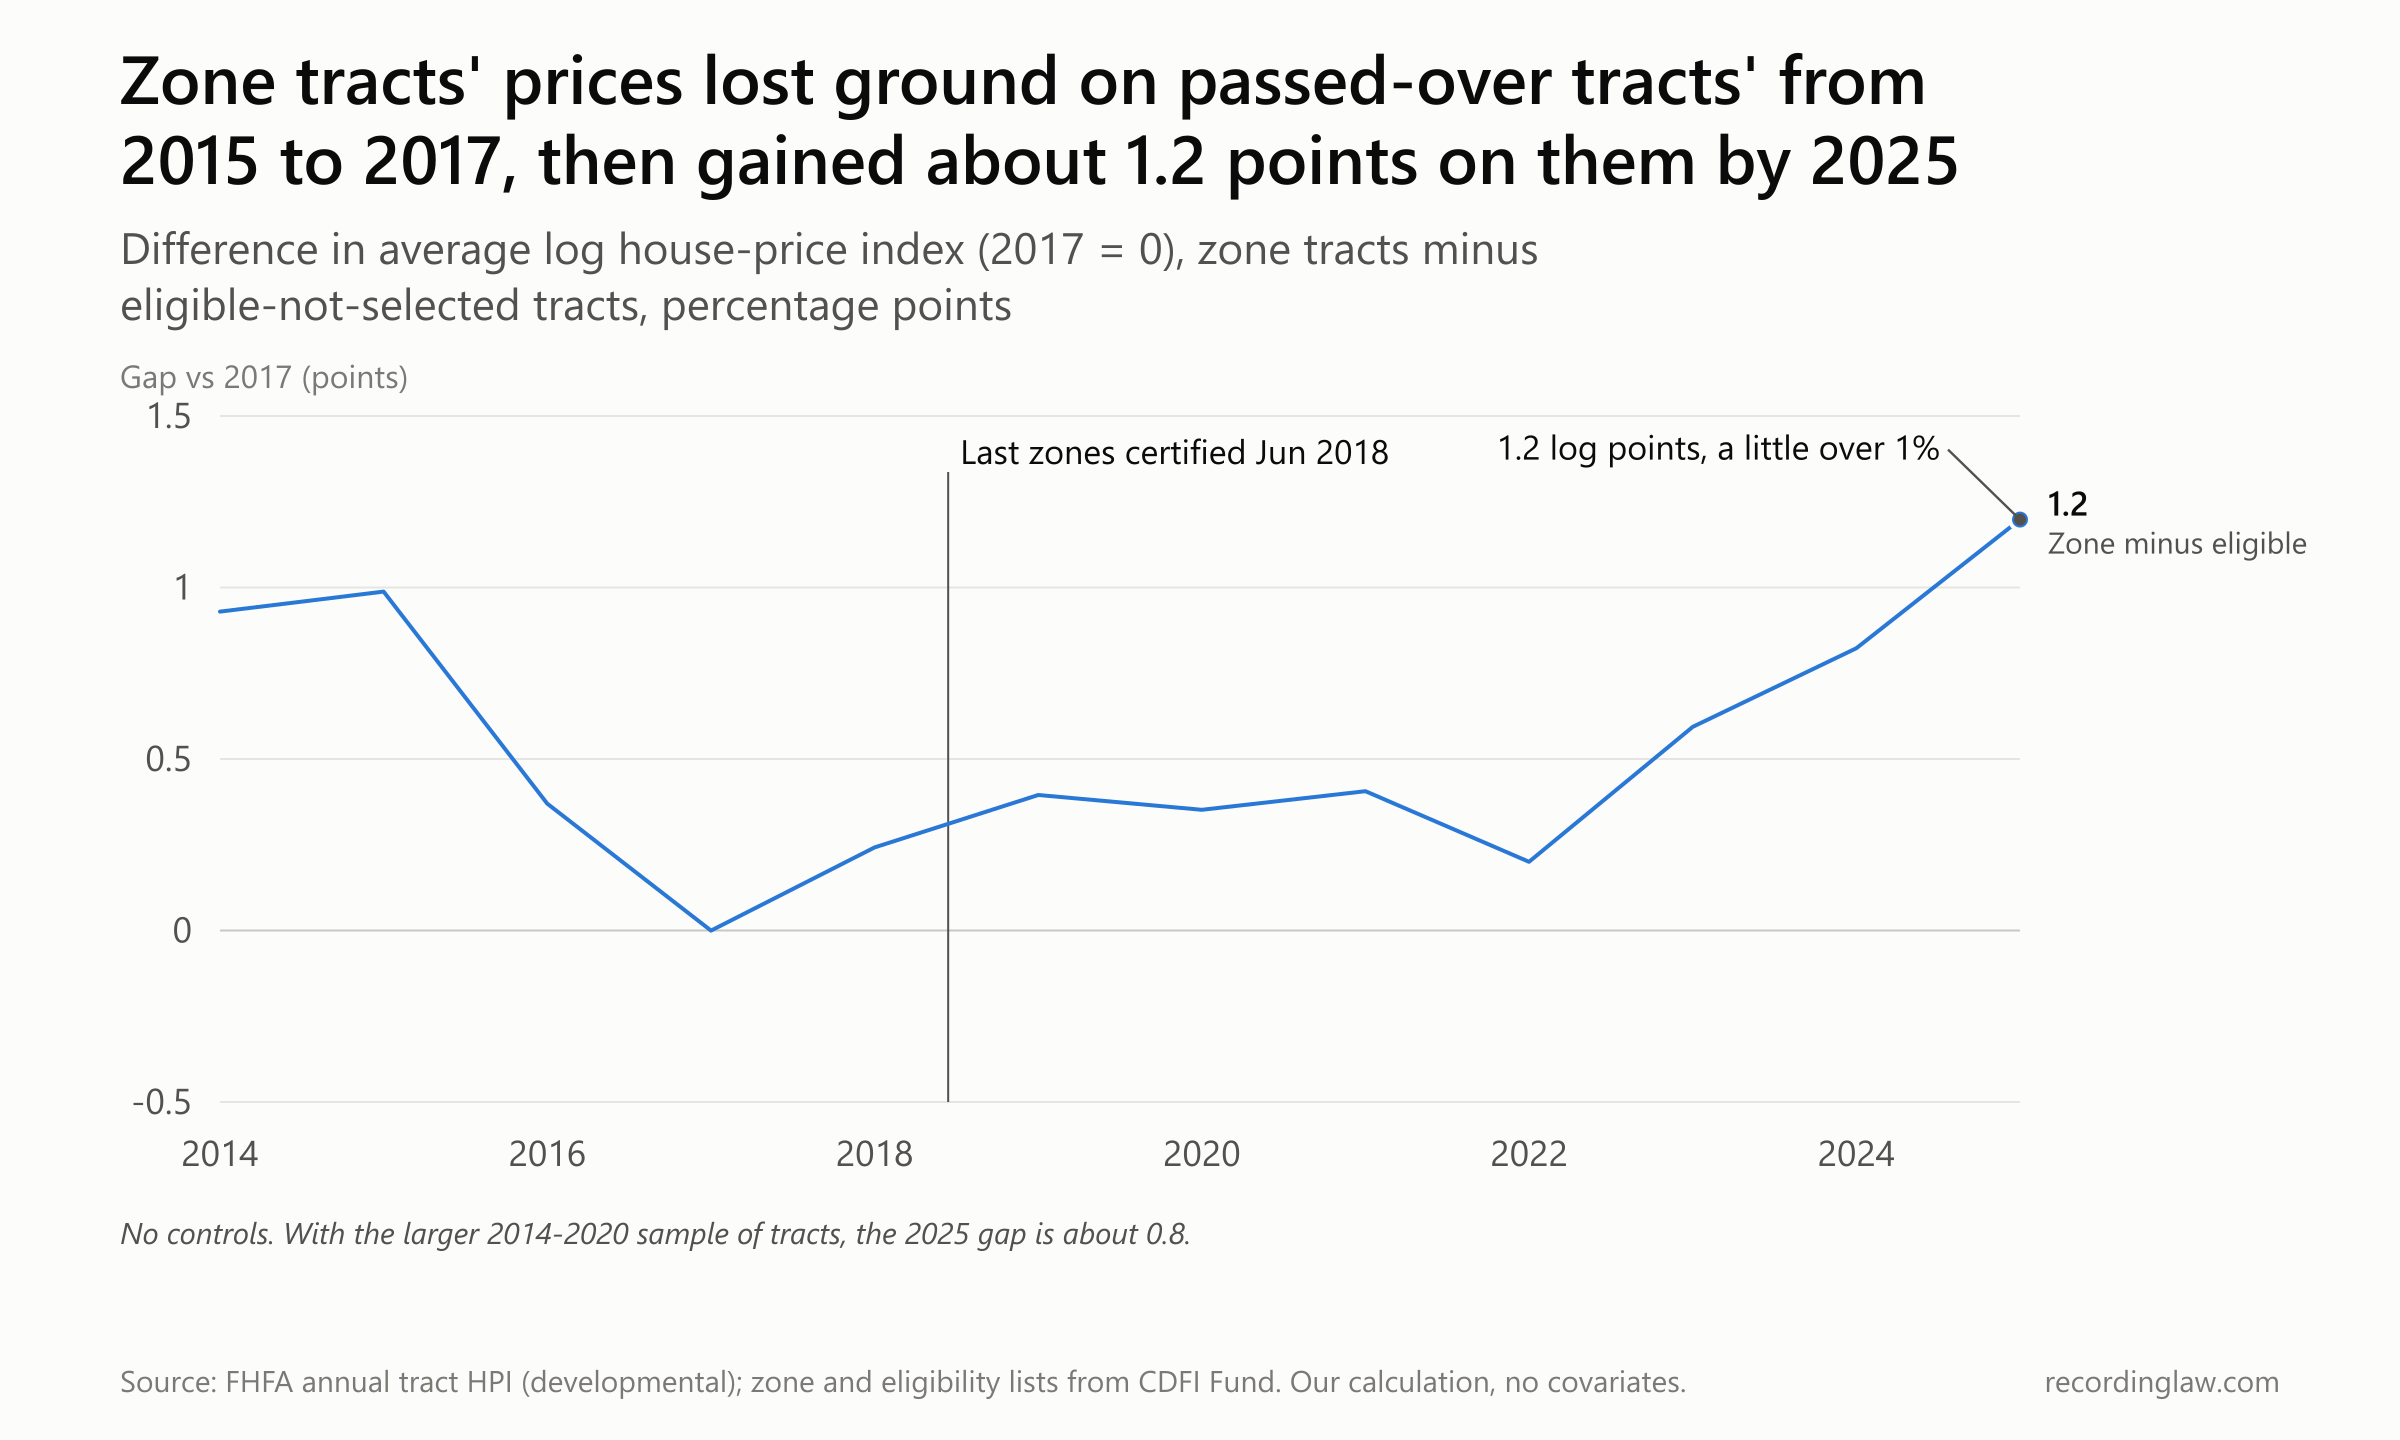
Zone tracts minus eligible-not-selected tracts, average log house price index relative to 2017, 2014-2025. Source: FHFA; CDFI Fund; our calculation, no covariates.
| Year | Zone minus eligible, log points relative to 2017 |
|---|---|
| 2014 | 0.93 |
| 2015 | 0.99 |
| 2016 | 0.37 |
| 2017 | 0.00 |
| 2018 | 0.24 |
| 2019 | 0.40 |
| 2020 | 0.35 |
| 2021 | 0.41 |
| 2022 | 0.20 |
| 2023 | 0.59 |
| 2024 | 0.82 |
| 2025 | 1.20 |
By 2025, zone tracts' prices had risen about 1.2 log points, a little over 1 percent, more than the passed-over tracts' since 2017. But the line was not flat before the zones existed. From 2015 to 2017, zone tracts rose about 1 point less than the passed-over tracts. So the turn could be the program, a trend that was already reversing, or both.
Two more cautions apply here. Using the larger set of tracts with data only through 2020, the 2025 gap is about 0.8 points rather than 1.2. And in 2021 and 2022, prices jumped in every group: about 13 and 16 percent a year in zone tracts and in passed-over tracts alike.
Every home-price estimate since, per year or cumulative to 2020, is far smaller than the yearly gap in Zillow's 2019 chart, where zone prices grew more than 20 percent and passed-over prices by single digits, a gap of more than 10 points. Prices were one way to watch the zones. Another was where investors' money went, and who put it there.
Where the money went
Most of the money went to a small share of the zones. By 2019, according to the IRS figures GAO reported, "over 6,000 of these funds invested about $29 billion in Opportunity Zones." Treasury's Office of Tax Analysis, working from tax returns, put cumulative qualified investment at $112 billion through tax year 2024.
Treasury economists David Coyne and Craig Johnson found that 77 percent of zones in the 50 states and Washington, D.C., received some investment. But they also found "the top 20 percent of OZs accounting for about 90 percent of the total qualifying investment." Real estate made up 58 percent of the property the funds held.
The investors were not typical taxpayers. "The typical Form 8997 filer that also electronically filed a Form 1040 has relatively high income, with a 2024 AGI of $738,000, compared to an AGI of $54,000 for a typical filer from the whole population of electronic Form 1040 filers," the Treasury paper said. Daniel Kowalski, the Trump administration's point person for the zone rules at Treasury, told a room of advisers at the Harvard Club, The New York Times reported in August 2019: "The audience for opportunity zones is inherently fairly small because it's limited to capital-gains income."
Summarizing a 2026 study by Glancy and co-authors on construction in the zones, the Treasury paper said "about two-thirds of the increase was due to governors selecting tracts with pre-existing planning activity." Overall, it concluded, "investment and benefits appear unevenly distributed and often aligned with pre-existing growth trajectories."
Studies of zone residents in the program's first years found little change. Matthew Freedman, Shantanu Khanna and David Neumark of UC Irvine wrote that "Our results point to little or no evidence of positive effects of the Opportunity Zone program on the employment, earnings, or poverty of zone residents." A 2025 follow-up, as Treasury summarized it, found jobs in zones up 1.3 percent, but "fewer than one out of eight went to residents of OZs."
The program's own supporters and critics fought over that record in public. In August 2019, The New York Times ran the headline "How a Tax Break to Help Poor Communities Became a Bonanza for the Rich." It quoted Aaron T. Seybert of the Kresge Foundation, which had supported the effort: "Capital is going to flow to the lowest-risk, highest-return environment," and "Perhaps 95 percent of this is doing no good for people we care about."
The same story also quoted the program's architects. "The early wave, that's not what you judge," Lettieri said. Booker, at a National Association of Counties discussion reported by Fast Company in June 2019, had called the zones "probably the biggest economic development tool that local government leaders have to attract capital and investment into their communities to create jobs and economic opportunity."
In November 2019, Sen. Ron Wyden of Oregon, the top Democrat on the Senate Finance Committee, introduced a bill to add reporting rules and called the program "troubled from the start." The Treasury Department, he said, "has been steering potentially billions in tax breaks to Donald Trump's friends."
In January 2020, Treasury's acting inspector general opened an inquiry into how the zones were chosen, after a request from Rep. Ron Kind of Wisconsin, Rep. Emanuel Cleaver of Missouri, and Sen. Cory Booker, one of the program's original sponsors.
David Wessel, the co-author of the price study, had also written a critical book on the program, "Only the Rich Can Play." Testifying to a House Ways and Means subcommittee in November 2021, he recalled attending "an Opportunity Zone Expo in May 2019 at the Mandalay Bay Resort & Casino in Las Vegas," which sat inside a zone. He said: "I fear that when we finally get all the data, we will learn that Opportunity Zones did more to cut taxes for the wealthy than to improve the lives of people who live in the zones." He also said that "there are places where OZs are working as the proponents promised, including downtown Erie, Pennsylvania."
The Center for American Progress, a progressive think tank, later wrote that the zone tax breaks "tended to subsidize investments in areas that were already on a path toward gentrification," and that they "should not be extended beyond their scheduled 2026 expiration." Congress went the other way.
A permanent program and a second map
On July 4, 2025, the One Big Beautiful Bill Act, which Treasury calls the Working Families Tax Cuts, made the tax break permanent, "creating rolling 10-year rounds of OZ designation," as Treasury's economists described it. The Economic Innovation Group wrote a week later that the question of whether the incentive "would lead to net new activity or simply reward activity that would have happened anyway has been answered."
Treasury opened the first redesignation on July 1, 2026. "With the nomination period now open, governors have the opportunity to help direct private investment to communities that stand to benefit most," Treasury Secretary Scott Bessent said. Governors could nominate from 25,332 eligible tracts, 8,334 of them eligible for new rural benefits.
The governors' window ran 90 days, to September 28, 2026, or October 28 with an extension. On November 5, 2026, Treasury and the IRS designated 6,576 tracts, 2,594 of them rural, as zones taking effect January 1, 2027. The first round had 8,764 zones.
The old round also has a deadline of its own. Under the tax code, gains deferred into first-round funds count as income for the tax year that includes December 31, 2026, or earlier if the investment is sold. Most of the 2025 law's new terms apply to money invested after that date.
The new map runs from January 1, 2027 through December 31, 2036. Investments made from that date get new terms, including a rolling five-year deferral and a rise in basis, the figure a taxable gain is measured from, of 10 percent, or 30 percent for rural funds.
The original zones do not disappear at once. Puerto Rico's expire on December 31, 2027, and the rest on December 31, 2028. So the two maps overlap for two years.
Governors once again nominated the tracts. That choice is what made the first round hard to measure, because every price study had to separate the zones' effect from the reasons governors picked those tracts in the first place.
This time the law also schedules its own test. According to the Economic Innovation Group's summary of the law, Treasury must publish annual data and, in years six and 11 after enactment, reports comparing designated tracts with comparable ones on jobs, poverty, income, housing and business formation. The first of those reports is due around 2031, 16 years after the white paper that started the program.
Zillow published its chart nine months after the last zones were certified. The chart showed zone sale prices growing more than 20 percent a year. By 2025, in the federal index that follows the same houses from sale to sale, zone tracts had gained a little over 1 percent on the tracts passed over for them since 2017, in our tabulation with no controls.
The 2015 white paper had looked back at the enterprise zones of the 1980s and reported that they "did not have a significant impact on unemployment or property value."
How we measured
Academic estimates come from Chen, Glaeser and Wessel (NBER Working Paper 26587, December 2019, and the Journal of Urban Economics Insight version, arXiv 2204.06967); Wheeler's November 2022 job-market paper (Tables B.12 and B.13); Bekkerman et al. (2024, abstract); Sage, Langen and van de Minne (Real Estate Economics, 2023, abstract); the Council of Economic Advisers (August 2020); Freedman, Khanna and Neumark (NBER Working Paper 28573); the Economic Innovation Group's February 2026 housing-supply paper; and Treasury Office of Tax Analysis Working Paper 128 (June 2026). Dates and counts for the new map come from Treasury (including its November 5, 2026 designation release), IRS Revenue Procedure 2026-14 and the Economic Innovation Group. In July 2025, before governors nominated, the Economic Innovation Group had estimated that the count including territories would fall from 8,764 to about 6,555. The December 31, 2026 inclusion date for first-round gains is from the text of 26 U.S.C. 1400Z-2(b)(1), checked on November 10, 2026, with the effective-date note for the 2025 amendments (Pub. L. 119-21, section 70421(c)(5)), which apply to amounts invested after December 31, 2026.
The Economic Innovation Group proposed the program, lobbied for it and is backed by investors including Sean Parker and Ron Conway; it says its 2026 paper had no outside funding.
The Greenlining Institute, the Institute on Taxation and Economic Policy and the Center for American Progress are advocacy groups critical of the program; their funders were not checked.
The Council of Economic Advisers is part of the Executive Office of the President. Wheeler's paper acknowledges an NSF fellowship and two Berkeley centers. Chen, Glaeser and Wessel state no funder; Wessel is also the author of a book critical of the program. A later published version of Wheeler's paper was not found or opened, and only the abstracts of the Bekkerman and Sage papers were read.
We downloaded FHFA's developmental annual tract house price index (through 2025), the CDFI Fund's list of 8,764 designated tracts (8,566 low-income tracts and 198 contiguous tracts) and its February 2018 eligibility file. "Zone" means a designated low-income tract; "eligible, not selected" means a low-income tract that was not designated; "ineligible" means a tract on neither list.
Averages are unweighted, with no controls. The first chart uses tracts with data every year from 2014 to 2020 (2,560 zone, 9,881 eligible, 35,053 ineligible). The level chart uses tracts with data every year from 2014 to 2025 (1,502 zone, 6,439 eligible). With the larger 2014-2020 sample, the 2025 gap is 0.79.
The annual-growth gap (zone minus eligible) averaged -0.11 points in 2014-2017 and +0.19 points in 2018-2020, a difference of 0.30 points a year. A log-point gap of 1.2 corresponds to a little over 1 percent. These are our calculations, not any paper's estimate.
Governors chose the zones, so zone and passed-over tracts differ in ways a simple comparison cannot remove. Fewer than half of zone tracts have FHFA price data, and tract boundaries were not reconciled between the 2010 and 2020 census (19 designated tracts are missing from the eligibility file). The 2021-2022 pandemic price surge hit every group.
The estimates chart groups results by test. Growth-rate rows are in percentage points a year. Level rows are cumulative percent and cannot be compared with the growth rows.
Where a source gave a standard error but no interval, we built a 95 percent interval as the estimate plus or minus 1.96 standard errors: 0.25 plus or minus 0.43 for the 2019 working paper as the council reported it (standard error 0.22); 0.53 plus or minus 0.37 for the council (0.19); -0.04 plus or minus 0.74 and 0.20 plus or minus 0.69 for Wheeler's growth tests (0.379 and 0.353); and 3.31 plus or minus 1.00 and 3.38 plus or minus 1.24 for his level tests (0.508 and 0.631). The 2023 published intervals are the authors' own.
Bekkerman's 4.03 to 6.13 percent is the range stated in the abstract, drawn as a bar with no point. The council's 1.1 percent is its own two-year translation of 0.53 a year. Our 0.30 is the change in the zone-minus-eligible annual growth gap described above, with no controls and no interval. Our 0.35 is the 2020 value of the level tabulation above (0.352 log points, about 0.35 percent), over the same 2017-2020 window as Wheeler, with no controls and no interval.
The working paper's -1.7 for the most residential ZIP codes has no interval in the paper. Zillow's 2019 comparison is not an estimate of the zones' effect and is not plotted, and Sage, Langen and van de Minne measured commercial property and land, not homes. Six of the eight growth-rate rows sit within half a point of zero; the other two are -1.7 and 0.53.
A growth-rate estimate and a level estimate answer different questions, and neither measures rents or who moved. The vertical marker on two charts is June 14, 2018, when Treasury certified the last states' zones. The council's 0.53 is about 2.8 times its standard error of 0.19, above the 1.96 needed for significance at the 5 percent level. The working paper's 0.25 is about 1.1 times its 0.22.
What comes next: first-round deferred gains are included in income for the tax year that includes December 31, 2026. The original zones expire on December 31, 2027 in Puerto Rico and December 31, 2028 elsewhere. Treasury's first comparison report under the 2025 law is due around 2031. We last checked these dates on November 10, 2026, against Treasury's November 5, 2026 designation release and the text of 26 U.S.C. 1400Z-2.
This article reports historical market data and is not investment advice.
Frequently Asked Questions
Did Opportunity Zones raise home prices?
Studies disagree, depending on method, years and place. Chen, Glaeser and Wessel found no detectable effect on annual single-family price growth. In their published version, their most credible estimates ruled out effects above 0.5 points a year. A White House rerun with newer data estimated a statistically significant 0.53 points a year. When Harrison Wheeler measured price levels, he found that median home values in large-city zone tracts rose about 3.4 percent more from 2017 to 2020 than in eligible tracts that were passed over. In a growth-rate test using different years and controls, he found no significant change in annual growth. Bekkerman and co-authors estimated price increases of 4.03 to 6.13 percent.
What is an Opportunity Zone?
It is a census tract designated under the 2017 Tax Cuts and Jobs Act where investors can defer and reduce capital gains taxes by investing through a Qualified Opportunity Fund. Governors nominated tracts and Treasury certified about 8,700 of them in 2018. They had an average poverty rate over 32 percent, according to Treasury.
Did rents rise in Opportunity Zones?
Wheeler's study of large-city tracts found that rents remained stable from 2018 to 2020. The Economic Innovation Group, which proposed the program, cites that finding.
How much money has gone into Opportunity Zones?
Treasury economists found $112 billion in cumulative qualified investment through tax year 2024. About 90 percent went to the top 20 percent of zones, and real estate made up 58 percent of the property funds held.
When do deferred Opportunity Zone gains become taxable?
For investments in the original round, the deferred gain is included in income for the tax year that includes the earlier of two dates: the date the investment is sold, or December 31, 2026. That rule is in 26 U.S.C. 1400Z-2(b)(1), and Treasury economists describe the same rule.
When does the new Opportunity Zone map take effect?
The 2025 law made the program permanent with rolling 10-year maps. On November 5, 2026, Treasury designated 6,576 tracts for the new map, which runs from January 1, 2027 through December 31, 2036. Original zones expire December 31, 2028, or December 31, 2027 in Puerto Rico.
When will the government report on whether Opportunity Zones worked?
According to the Economic Innovation Group's summary of the law, the 2025 law requires Treasury to publish annual data and, in years six and 11 after enactment, to compare designated tracts with comparable ones on measures including jobs, poverty, income and housing. The first of those reports is due around 2031.
Updates
Reworded for readability. No figures, quotes, sources or findings changed.
Restructured as a feature: chart titles state the finding, side details moved to How we measured. Every figure and quote was re-checked against its source.
Independently fact-checked against the cited primary sources
Independently fact-checked against the cited primary sources
Sources and References
- Chen, Glaeser and Wessel, NBER Working Paper 26587 (December 2019)(nber.org)
- Chen, Glaeser and Wessel, Journal of Urban Economics Insight version (arXiv 2204.06967)(arxiv.org)
- Harrison Wheeler, job-market paper on Opportunity Zones (November 2022)(hbwheeler.github.io)
- Bekkerman, Cohen, Liu, Maiden and Mitrofanov, Manufacturing & Service Operations Management (2024), abstract(cris.haifa.ac.il)
- Sage, Langen and van de Minne, Real Estate Economics (2023), abstract(doi.org)
- Council of Economic Advisers, The Impact of Opportunity Zones: An Initial Assessment (August 2020)(trumpwhitehouse.archives.gov).gov
- Freedman, Khanna and Neumark, NBER Working Paper 28573(nber.org)
- Economic Innovation Group, The Impact of Opportunity Zones on Housing Supply (February 2026)(eig.org)
- Economic Innovation Group white paper by Bernstein and Hassett (April 2015)(eig.org)
- Economic Innovation Group, Opportunity Zones 2.0: Where things stand (July 2025)(eig.org)
- Economic Innovation Group, Senator Scott introduces the Investing in Opportunity Act (April 2016)(eig.org)
- Economic Innovation Group, Group started by tech investors bolsters lobbying power(eig.org)
- John W. Lettieri, Tax Notes Federal (June 2021), reprint(eig.org)
- Office of Sen. Tim Scott, Investing in Opportunity Act release (2017; read via Wayback Machine)(web.archive.org).gov
- Office of Sen. Tim Scott, response to Opportunity Zone reform bills (2019; read via Wayback Machine)(web.archive.org).gov
- Senate Finance Committee minority, Wyden Opportunity Zone reform bill (November 2019; read via Wayback Machine)(web.archive.org).gov
- Joint Committee on Taxation, JCX-67-17 (December 18, 2017)(jct.gov).gov
- U.S. Treasury, final round of Opportunity Zone designations (June 14, 2018)(home.treasury.gov).gov
- U.S. Treasury, Opportunity Zone nomination period opens (July 1, 2026)(home.treasury.gov).gov
- U.S. Treasury, Opportunity Zone designations for 2027 (November 5, 2026)(home.treasury.gov).gov
- Coyne and Johnson, Treasury Office of Tax Analysis Working Paper 128 (June 2026)(home.treasury.gov).gov
- Internal Revenue Bulletin 2026-20 (Revenue Procedure 2026-14)(irs.gov).gov
- U.S. Government Accountability Office, GAO-22-104019 (October 2021)(gao.gov).gov
- CDFI Fund, Opportunity Zones(cdfifund.gov).gov
- CDFI Fund, list of designated Qualified Opportunity Zones(cdfifund.gov).gov
- Federal Housing Finance Agency, House Price Index datasets (annual tract HPI)(fhfa.gov).gov
- Zillow Research, Opportunity Zone sale prices (March 18, 2019)(zillow.com)
- Philadelphia Inquirer (December 14, 2018)(inquirer.com)
- Greenlining Institute and coalition, letter to Gov. Edmund G. Brown (March 15, 2018)(greenlining.org)
- Institute on Taxation and Economic Policy (December 2019)(itep.org)
- Center for American Progress, New research adds to evidence that opportunity zone tax breaks are costly and ineffective(americanprogress.org)
- ProPublica, How a Tax Break to Help the Poor Went to NBA Owner Dan Gilbert (October 24, 2019)(propublica.org)
- The New York Times, How a Tax Break to Help Poor Communities Became a Bonanza for the Rich (August 31, 2019)(nytimes.com)
- Fast Company (June 4, 2019)(fastcompany.com)
- NBC News, Treasury inspector general inquiry (January 2020)(nbcnews.com)
- David Wessel, testimony to the House Ways and Means Oversight Subcommittee (November 16, 2021)(brookings.edu)
- 26 U.S. Code 1400Z-2, Special rules for capital gains invested in opportunity zones (Legal Information Institute, with 2025 amendment notes)(law.cornell.edu)