Mortgage Denials Were About Three Times as High at 50-60% Debt-to-Income as at the CFPB's Former 43% Line (2018-2025)

Independently fact-checked against primary sources (last audited November 10, 2026). · 19 primary sources cited on this page. How we verify our legal content
On January 10, 2013, the Consumer Financial Protection Bureau held a field hearing on mortgage policy, set for 11 a.m. in Westminster Hall in Baltimore. Its director, Richard Cordray, used it to announce the rule that would define a standard "qualified mortgage," or QM. A loan that met the standard would carry a legal presumption that the lender had obeyed the new ability-to-repay rules, which require lenders to check that a borrower can afford the loan.
To qualify, Cordray said, a borrower's total monthly debts, including the new house payment, taxes and insurance, generally could not add up to more than 43 percent of monthly gross income. That share is the debt-to-income ratio, or DTI.
"No standard is perfect," Cordray said, "but this standard draws a clear line that will provide a real measure of protection to borrowers and increased certainty to the mortgage market." He named a second goal in the same speech: "Our goal here is not only to stop reckless lending, but to enable consumers to access affordable credit."
In federal lending data from 2018 through 2025, the 43 percent line does not show up as a step in who gets turned down. In 2025, lenders denied about 1 in 13 home-purchase applications from borrowers whose debts came to 43 percent of income, almost exactly the rate at 42 percent or 44 percent. In the band from 50 to 60 percent, the denial rate was about three times as high.
The rule came with a way around the 43 percent line from the first day. It carried a temporary exception for loans that Fannie Mae and Freddie Mac were eligible to buy. Fannie and Freddie are the two government-sponsored enterprises (GSEs) that buy mortgages from lenders.
That exception became known as the GSE patch. By the CFPB's own 2020 account, most mortgage loans qualified through it rather than through the 43 percent test.
The CFPB replaced the cap with a price test in 2020. The patch ran out in 2021 and 2022. That leaves a question the denial numbers can answer. Where did the line that mattered to borrowers actually sit, and who set it?
Where the denials jump
If 43 percent was where mortgages were refused, denial rates should change there. The Home Mortgage Disclosure Act (HMDA) data that lenders file with federal regulators has recorded each applicant's debt-to-income ratio since 2018. It records the ratio in whole percentages from 36 to 49, and in bands outside that range.
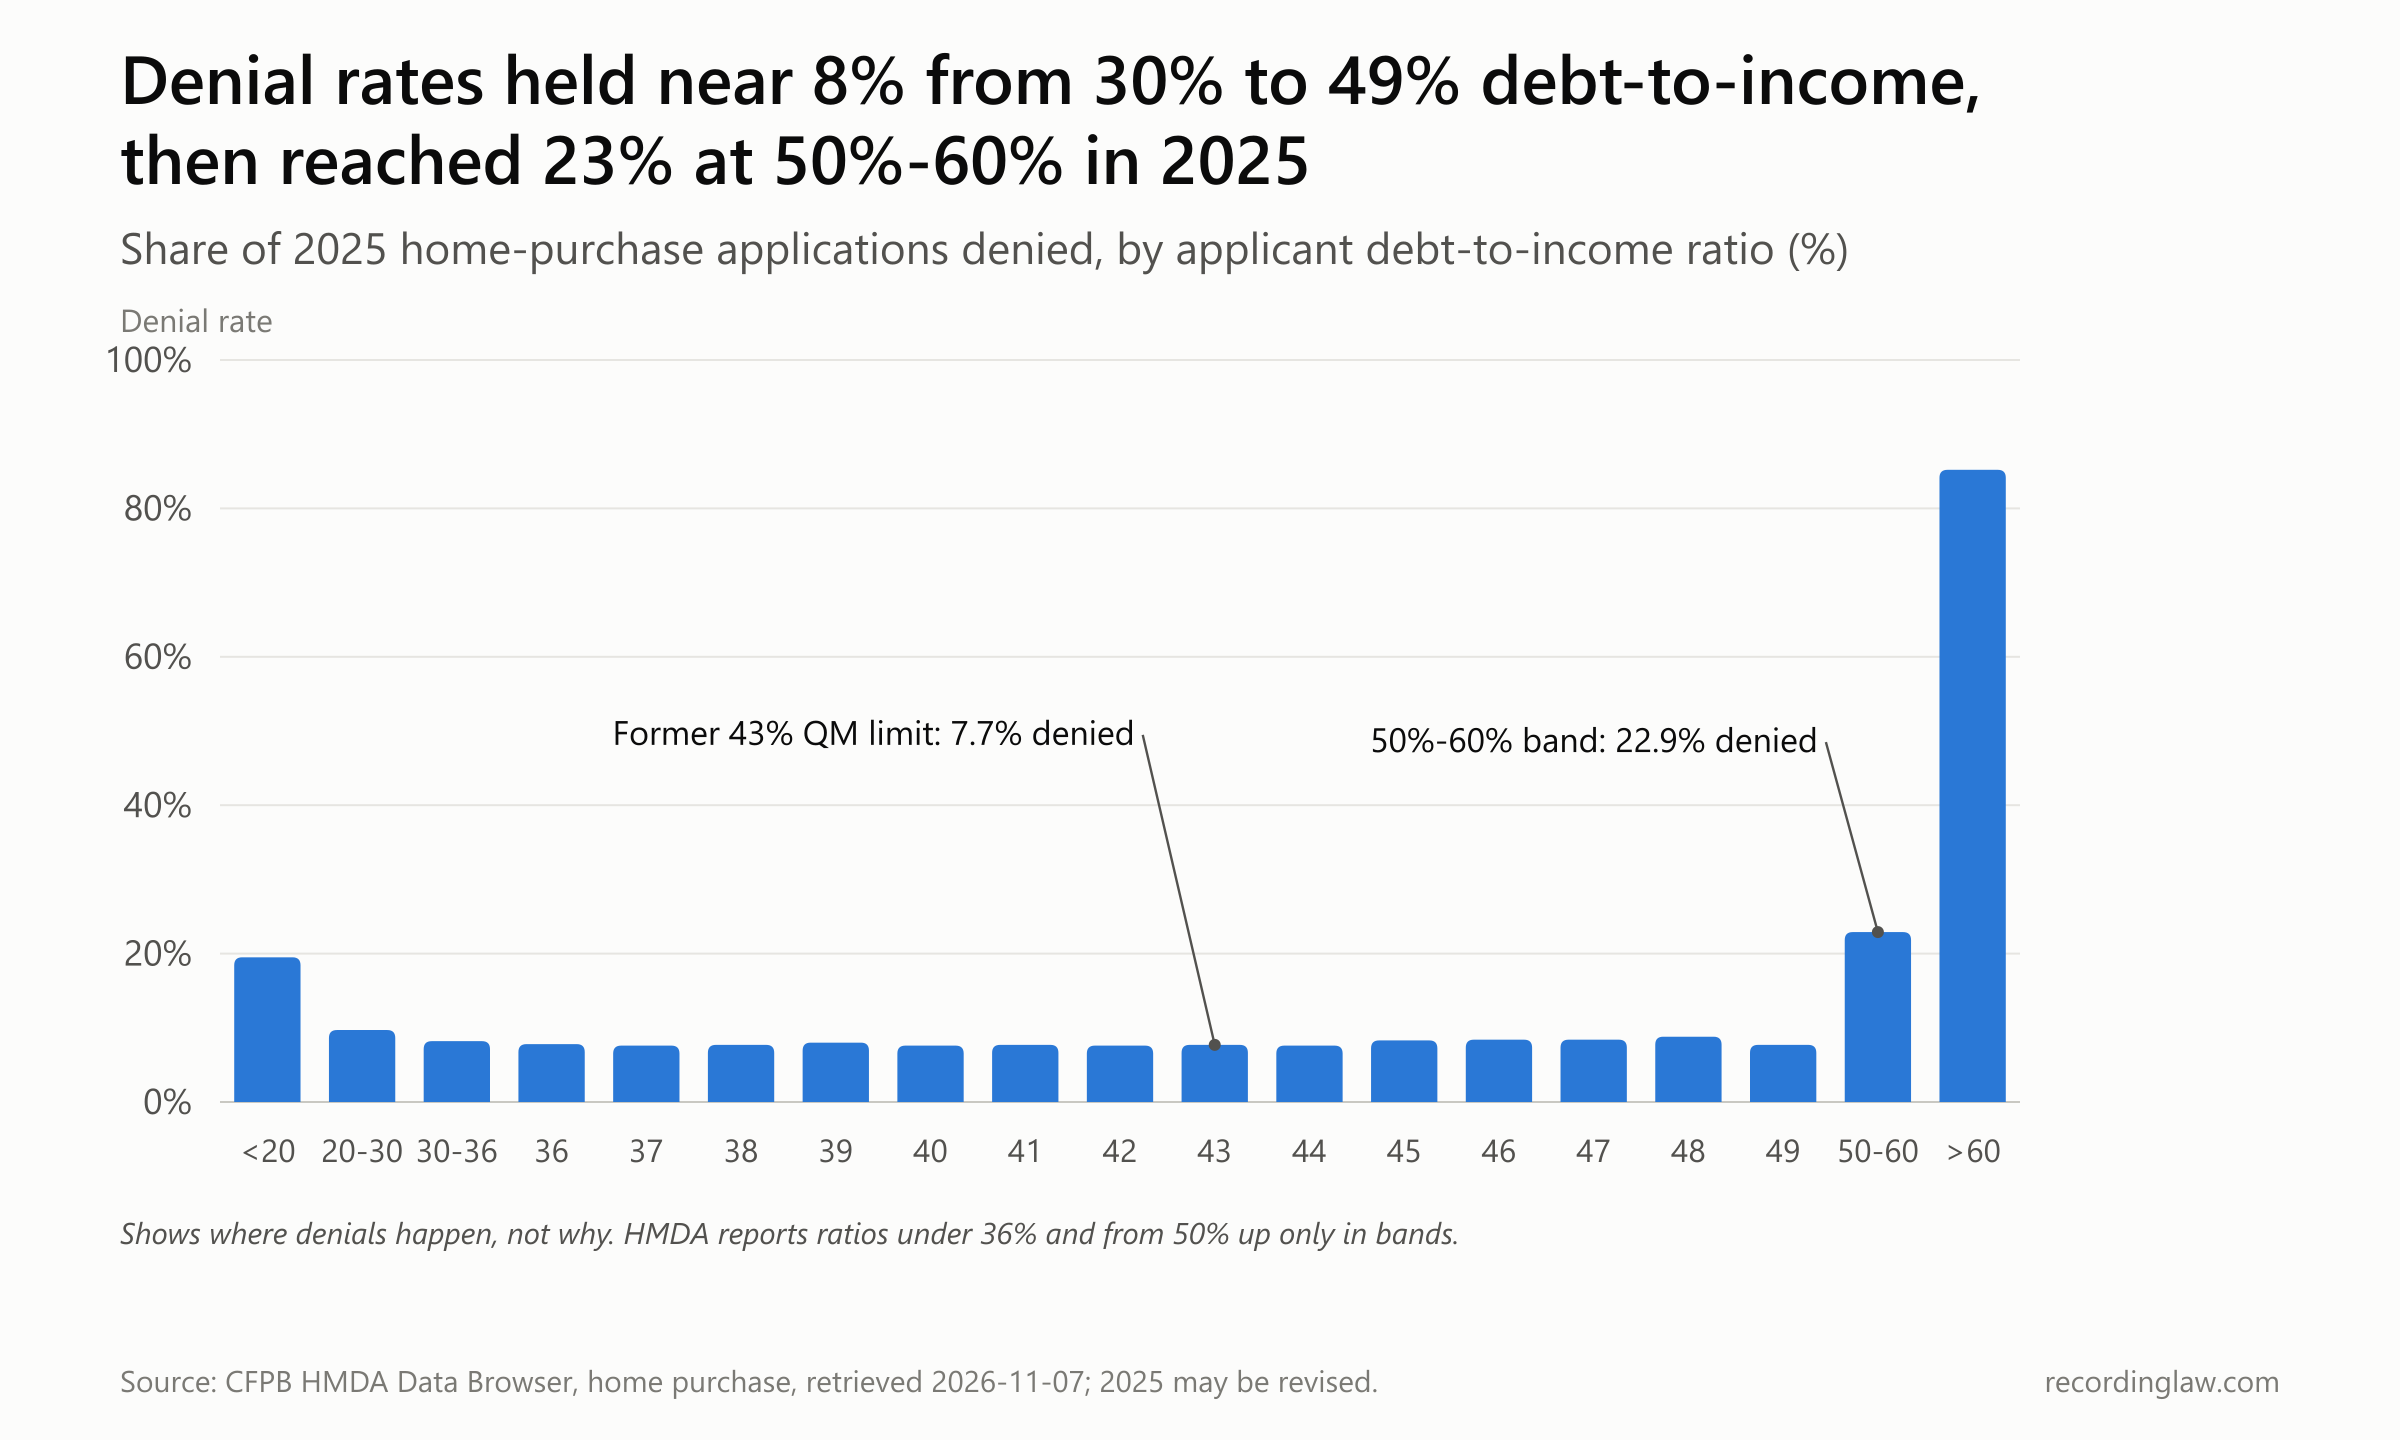
Share of 2025 home-purchase applications denied, by debt-to-income ratio. Source: CFPB HMDA Data Browser; author calculations; 2025 data may be revised.
| Debt-to-income | Denial rate, 2024 | Denial rate, 2025 |
|---|---|---|
| Under 20% | 20.2% | 19.5% |
| 20% to 30% | 9.9% | 9.7% |
| 30% to 36% | 8.2% | 8.2% |
| 40% | 8.0% | 7.6% |
| 42% | 7.9% | 7.6% |
| 43% | 7.8% | 7.7% |
| 44% | 7.7% | 7.6% |
| 46% | 8.7% | 8.4% |
| 48% | 9.2% | 8.8% |
| 49% | 7.7% | 7.7% |
| 50% to 60% | 24.4% | 22.9% |
| Over 60% | 87.5% | 85.2% |
In 2025, from 30 percent to 49 percent, denial rates stayed near 8 percent and never reached 9. The 43 percent mark sits in the middle of that range. The step comes at the 50 to 60 percent band. Above 60 percent, more than four in five applications were denied.
The lowest band, under 20 percent, was also denied more often, about one in five. HMDA does not record why.
The 2025 picture could be a product of the rule change, since the 43 percent limit was gone by then. Whether the line ever left a mark depends on what it covered while it was in force. So the next sections go back to where the number came from, and then to what it covered.
A clear line, with an exception built in
The number did not come from Congress. The Dodd-Frank Act of 2010 defined a qualified mortgage in part as one that complies with "any guidelines or regulations established by the Bureau relating to ratios of total monthly debt to monthly income." The 43 came from the Bureau's own rule.
It had been on the table for ten months. In a July 2012 comment letter, the Mortgage Bankers Association, a trade group funded by member lenders, told the CFPB that "In March 2012, some lenders and consumer groups met with the CFPB and proposed a maximum total-debt-to-income ratio (TDTI) of 43 percent." The letter does not name them.
The same letter argued that "the 43 percent TDTI, which would ensure a loan is regarded as a QM, is a problem," citing Federal Housing Finance Agency data showing that 23 percent of loans Fannie and Freddie acquired from 1997 to 2009 had ratios of 44 percent or more. "There is no real reason looking at the FHFA data to choose 43, 44 or even 46 as the default," it said.
The Bureau defended the figure as generous. Next to the 36 percent benchmark in Fannie Mae and Freddie Mac guidelines, it wrote in the final rule, 43 was "a relatively liberal one which allows ample room for consumers to qualify for an affordable mortgage." It added that "the 43 percent threshold has been utilized by the Federal Housing Administration (FHA) for many years as its general boundary for defining affordability."
The same document said no single number could do the job. "The Bureau acknowledges, based on its analysis of the data, that there is no 'magic number' which separates affordable from unaffordable mortgages," it wrote, describing instead "a gradual increase in delinquency rates as debt-to-income ratios increase." It also counted how many loans sat on the far side of the line: "approximately 22 percent of mortgage loans are made with a debt-to-income ratio that exceeds 43 percent," even in a market it called credit-constrained.
The rule did not apply the line to every loan, at least at first. Cordray told the Baltimore audience the rule would "temporarily broaden its coverage of Qualified Mortgages to allow a transitional period while other parts of the government, including the Congress, map a path forward toward reform of the secondary market for mortgage financing." In practice, the patch let loans eligible for purchase by Fannie Mae or Freddie Mac be qualified mortgages above 43 percent.
The patch was set to expire no later than January 10, 2021, or earlier if the two companies left federal conservatorship. The two companies were then in conservatorship, a form of government control under the Federal Housing Finance Agency.
The Bureau also made a prediction about loans that fell outside both the cap and the exception. "Over the long term," it wrote, it expected "a robust and sizable market for prudent loans beyond the 43 percent threshold" even without the legal protection a qualified mortgage carried.
On announcement day, Talk Business & Politics in Arkansas reported that a manager at Arvest Mortgage said the 43% rule would knock a few people out of loan qualification even though they might be creditworthy and able to repay. A lender at First Security Bank said some investors buying loans in the secondary market already permitted debt-to-income ratios up to 50% for borrowers with very strong credit scores of 740 and higher, the outlet reported.
MBA chairman Debra W. Still both praised the rule and cautioned about it, Inman News reported. She applauded its legal safe harbor for lenders and said the rule would "effectively block the return of risky product features and inadequate documentation." She cautioned that "credit is tighter than at any point we can remember," singling out the rule's 3 percent cap on points and fees and its interest-rate threshold for the safe harbor. She added: "However, if the result is a tightening of credit as lenders pull back from offering loans that would create greater risk of litigation, the CFPB may need to quickly revisit the rule to avoid harming the housing recovery."
Who the line reached
When the rule took effect on January 10, 2014, the open question was which loans the line would actually touch. Earlier that week, according to the New York Daily News as reported by The Real Deal, Cordray told the National Association of Realtors: "These simple principles will help us ensure that the mortgage market never melts down again the way it did just a few short years ago, making people's lives miserable in the process."
In December 2013 the CFPB had already pushed back on the way the rule was being described. Its fact sheet put it as a pair: "Fiction: The Ability-to-Repay Rule requires all mortgages to cap debt-to-income at 43 percent. Fact: The Ability-to-Repay Rule does not mandate debt-to-income ratios." A lender could still make a loan above 43 percent outside the qualified-mortgage category, without the presumption of compliance that came with it.
Four days after the effective date, a House Financial Services subcommittee held a hearing whose printed title began "How Prospective and Current Homeowners Will Be Harmed by the CFPB." Bill Emerson, chief executive of Quicken Loans, testified for the MBA as its vice chairman. If the 43 test was not met, his written statement said, "the loan simply does not qualify regardless of compensating factors," among them the borrower's cash reserves, residual income or payment history.
The National Association of Realtors, a trade group funded by its members, pointed to the loans the exception did not cover. Jumbo loans are mortgages too large for Fannie or Freddie to buy. "Even if the GSE exception is maintained, jumbo loans and non-GSE or non-government backed loans will be subject to the 43 percent DTI cap making them more costly or less likely to be made," its statement for the hearing said. "For jumbo loans in particular, the DTI cap could impose significant restrictions in high cost areas."
Five years later the CFPB measured both groups, as the law required it to. For borrowers above 43 percent who qualified for a Fannie, Freddie or government-backed loan, its January 2019 assessment found "the Rule has not decreased access to credit since such mortgages meet the standard for QM loans." In the Fannie and Freddie segment, the share of high-debt loans had been about 15 percent before the rule in two of the datasets it used (about 10 percent in a third) and grew after it.
Outside the patch, the cap did turn loans away. Using application data from nine larger lenders, the assessment found from 2014 to 2016 the rule "displaced between 63 and 70 percent of approved applications for home purchase among non-QM High DTI borrowers." Those were mostly jumbo loans.
The borrowers in that group had debt-to-income ratios above 43 percent, and their loans fell outside the qualified-mortgage category. Measured against all of those lenders' purchase loans, the displaced loans equaled 1.5 to 2.0 percent.
The assessment found the rule "was generally not associated with an improvement in loan performance" on its early-delinquency measure. It also noted that delinquency had already been historically low before the rule. A year later, four Federal Reserve researchers at Dallas and Atlanta summed up the reach in one line: "Taken together, this means that the 43 percent DTI rule did not apply to the vast majority of mortgages originated over the past six years."
When lenders and civil-rights groups agreed
By 2019 the exception's 2021 deadline was close, and the fight over it lined up the usual opponents on the same side. "Though advocates and industry are rarely aligned, they are starting to coalesce around a plan that would call for the elimination of the CFPB's 43% DTI limit," Kate Berry wrote in American Banker that August.
The stakes were large. American Banker reported an estimate from Moody's Investors Service: roughly 15 percent of home loan volume, $200 billion to $300 billion in loans, would be affected if the patch ended. The Realtors estimated that more than 3.3 million home purchases financed since 2014 fell in that segment, and the MBA wrote that expiration without a plan "will have dramatic negative consequences for the housing market, resulting in more expensive or unavailable credit," HousingWire reported.
In September 2019, seventeen consumer, civil-rights and fair-housing groups wrote to CFPB Director Kathleen Kraninger. Among them were the NAACP, the National Consumer Law Center, the National Fair Housing Alliance and the Center for Responsible Lending. The Center for Responsible Lending is a nonprofit policy group affiliated with Self-Help, a nonprofit community development lender.
"If the Patch expires with the DTI threshold still in place, and without other adjustments to the Qualified Mortgage definition, we anticipate that the change will negatively affect the consumers for whom access to credit is already hard to come by: low-income borrowers, borrowers of color, and borrowers with student debt," they wrote. They asked the Bureau to "eliminate the 43 percent debt-to-income (DTI) ratio threshold and the associated Appendix Q for prime and near-prime loans as singular requirements for Qualified Mortgage status," while keeping ability to repay "a key component" of qualified mortgages.
Evidence that debt still mattered came from the four Dallas and Atlanta Fed researchers. Writing in March 2020, they found that "high DTI ratios are associated with a greater incidence of mortgage default, even after controlling for other borrower and loan characteristics," a link they said was "muted during strong housing markets but much more pronounced during periods of market stress." On loans from 2012 to 2015, they wrote, the weak link reflected an economic recovery that "suppressed their higher risk, which would likely reemerge if the economy were to go into recession." They said they intended further work "to ensure that the positive relationship between DTI ratios and default is robust" and offered the analysis as helpful "in policy deliberations about the ability-to-repay rule."
The case for keeping a debt test came from smaller banks. The Independent Community Bankers of America (ICBA), a trade group funded by member banks, argued in a comment letter that a price-based approach "could be easily manipulated and would favor the largest mortgage lenders," its own magazine reported. It proposed keeping "a range of DTI thresholds above the 43 percent, capped at 50 percent." An unnamed research center, as summarized by the CFPB, argued that a debt limit "would provide friction during a housing boom."
When the Bureau wrote its replacement rule, it put the patch in one number. Based on 2018 data, "approximately 957,000 loans--16 percent of all closed-end first-lien residential mortgage originations in 2018--would be affected by the expiration of the Temporary GSE QM loan definition" if the 43 percent limit stayed.
Taking the line down, on two dates
On December 10, 2020, the CFPB issued a rule that "removes the General QM loan definition's 43 percent DTI limit and replaces it with price-based thresholds." The General QM definition is the standard qualified-mortgage test that the 2013 rule set up. The Bureau said in its announcement that "a loan's price is a strong indicator of a consumer's ability to repay" and that "conditioning QM status on a specific DTI limit could impair access to responsible, affordable credit." Under the price test, a loan's QM status depends on how far its annual percentage rate sits above a benchmark, the average prime offer rate.
"Our final rule's price-based approach strikes the best balance between assessing consumers' ability to repay and promoting access to responsible, affordable mortgage credit," said Kathleen Kraninger, the CFPB's director. The announcement also said this about the patch: "Most mortgage loans are QMs pursuant to this provision, also known as 'the Patch.'"
Both sides of the 2019 alliance welcomed it. "MBA applauds the Bureau for releasing the final General and Seasoned QM rules," said Bob Broeksmit, the MBA's president and chief executive. Mike Calhoun of the Center for Responsible Lending and Lisa Rice of the National Fair Housing Alliance said the rule "correctly removes a strict debt-to-income (DTI) cutoff in order for a loan to qualify as QM."
The rule took effect March 1, 2021, with compliance required from July 1, 2021. The patch's end came on two different dates.
On January 14, 2021, the Treasury Department and the Federal Housing Finance Agency amended their agreements with Fannie Mae and Freddie Mac to limit the companies' purchases of loans outside the revised qualified-mortgage definition from July 1, 2021. Fannie Mae told lenders that patch loans not meeting the revised rule had to "have application dates on or before Jun. 30, 2021." Freddie Mac set the same July 1, 2021, application cutoff. Both companies required those loans to be sold to them by August 31, 2021, at the latest.
On April 27, 2021, the CFPB moved its own compliance date from July 1, 2021, to October 1, 2022. "So many consumers have been hit hard by the pandemic and the economic downturn, and we want to ensure that responsible, affordable mortgages remain available," said Acting Director Dave Uejio. The MBA had opposed the proposed delay, saying it "will not expand access to credit and will inject considerable uncertainty into the housing market."
Under the delay, the patch expired legally on October 1, 2022. For new applications at Fannie and Freddie, it had ended 15 months earlier.
Was there a step at 43 while the cap applied?
HMDA's debt-to-income field reaches back to 2018, when the cap still applied to loans outside the patch. The years before 2025 look the same.
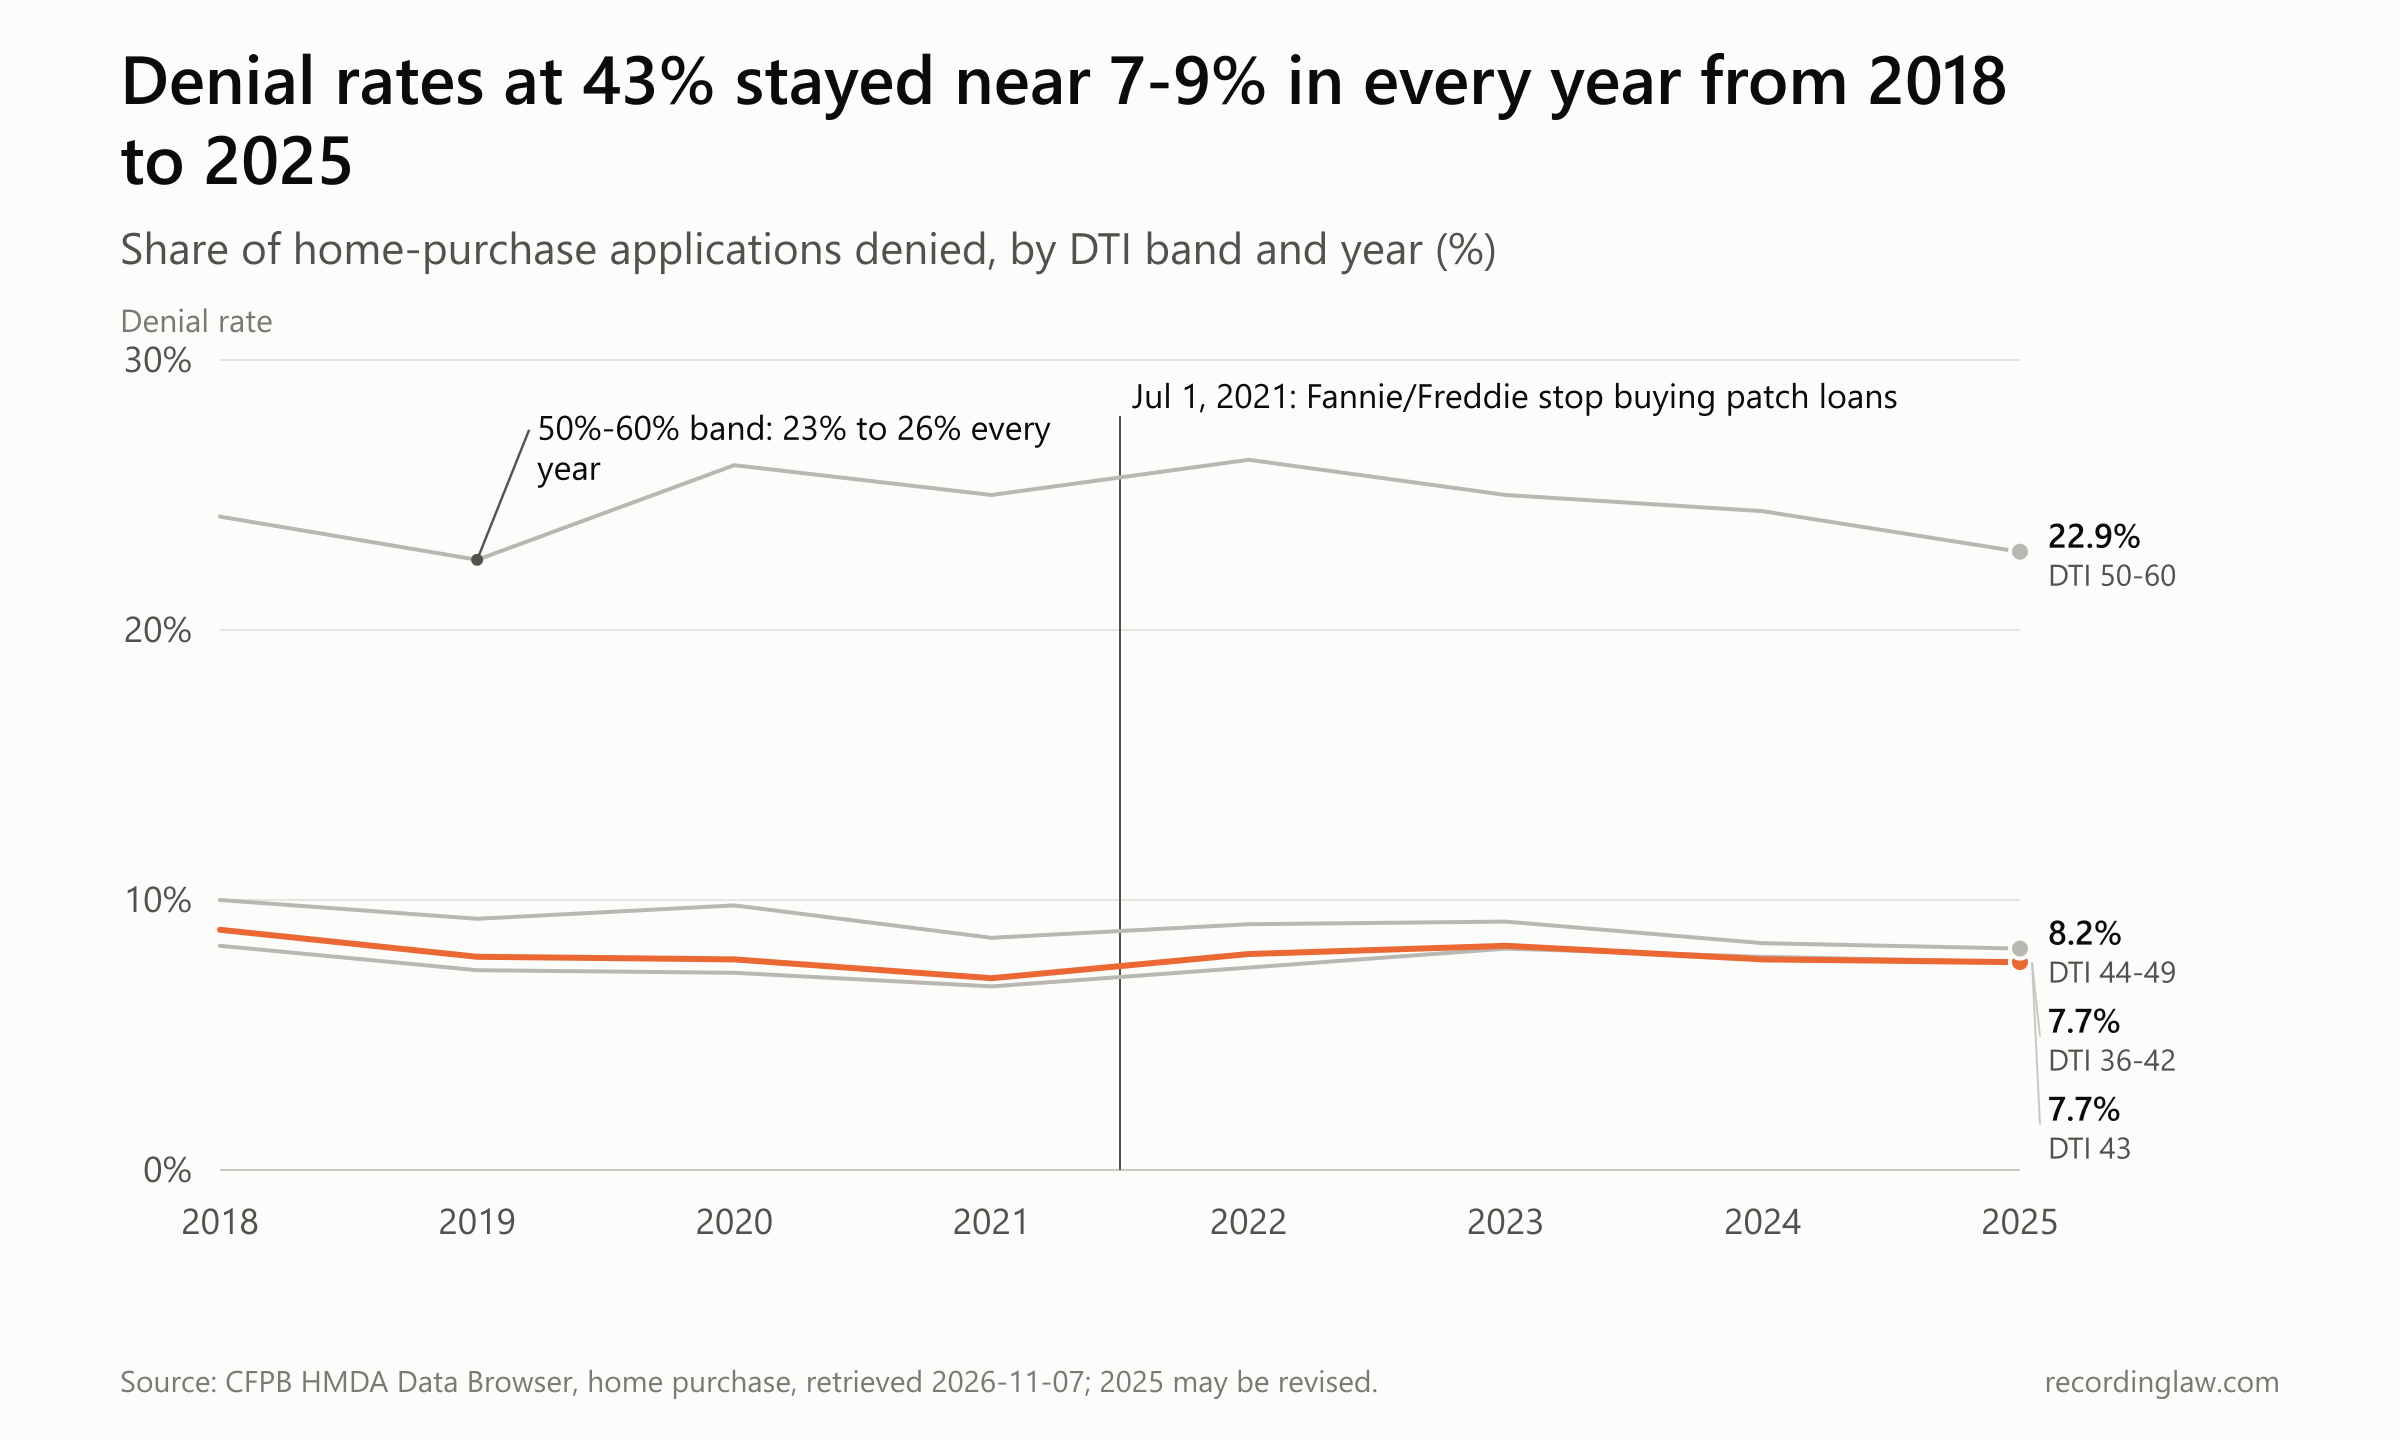
Denial rate by debt-to-income band, home-purchase applications, 2018-2025. The vertical line marks July 1, 2021, the original compliance date of the 2020 rule and the application cutoff after which Fannie Mae and Freddie Mac stopped buying patch loans; the CFPB later moved its compliance date to October 1, 2022. Source: CFPB HMDA Data Browser; author calculations; 2025 data may be revised.
| Year | DTI 36-42 | DTI 43 | DTI 44-49 | DTI 50-60 | Over 60 |
|---|---|---|---|---|---|
| 2018 | 8.3% | 8.9% | 10.0% | 24.2% | 82.1% |
| 2019 | 7.4% | 7.9% | 9.3% | 22.6% | 84.0% |
| 2020 | 7.3% | 7.8% | 9.8% | 26.1% | 89.7% |
| 2021 | 6.8% | 7.1% | 8.6% | 25.0% | 88.9% |
| 2022 | 7.5% | 8.0% | 9.1% | 26.3% | 87.1% |
| 2023 | 8.2% | 8.3% | 9.2% | 25.0% | 86.2% |
| 2024 | 7.9% | 7.8% | 8.4% | 24.4% | 87.5% |
| 2025 | 7.7% | 7.7% | 8.2% | 22.9% | 85.2% |
In every year from 2018 to 2025, the denial rate at exactly 43 percent sat within less than a point of the rate for 36 to 42 percent, before and after the patch ended. The 50 to 60 percent band ran at 2.9 to 3.7 times the 36 to 42 percent rate throughout.
Two St. Louis Fed economists, Manu García and Carlos Garriga, tested the same question statistically in a June 2026 analysis of more than 30 million home-purchase applications from 2018 to 2024. They measured changes in denial rates in percentage points, the plain difference between two percentages (from 10% to 12% is two points).
Using a regression-discontinuity method, which compares applications just below and just above a cutoff, they estimated the jump in denials at 43 percent at less than half a percentage point. At 50 percent, they estimated it at 15 to 17 percentage points.
"The 43% mark that has drawn enormous regulatory attention barely registers in actual lending decisions," they wrote. "The 50% mark, which has received no comparable scrutiny, is where applications hit a wall."
Their estimate and the flat lines above share a limit. Denial rates describe applications that were filed. They cannot show borrowers who never applied, or loans that went to FHA or to Fannie and Freddie instead. That is the kind of shift the CFPB's 2019 assessment measured, with lender data that HMDA does not have.
No crowd under 43, a crowd at 49
A line that mattered might also leave a second mark. Applications would pile up just under it. That kind of cluster would appear if borrowers and lenders were working to fit loans beneath it.
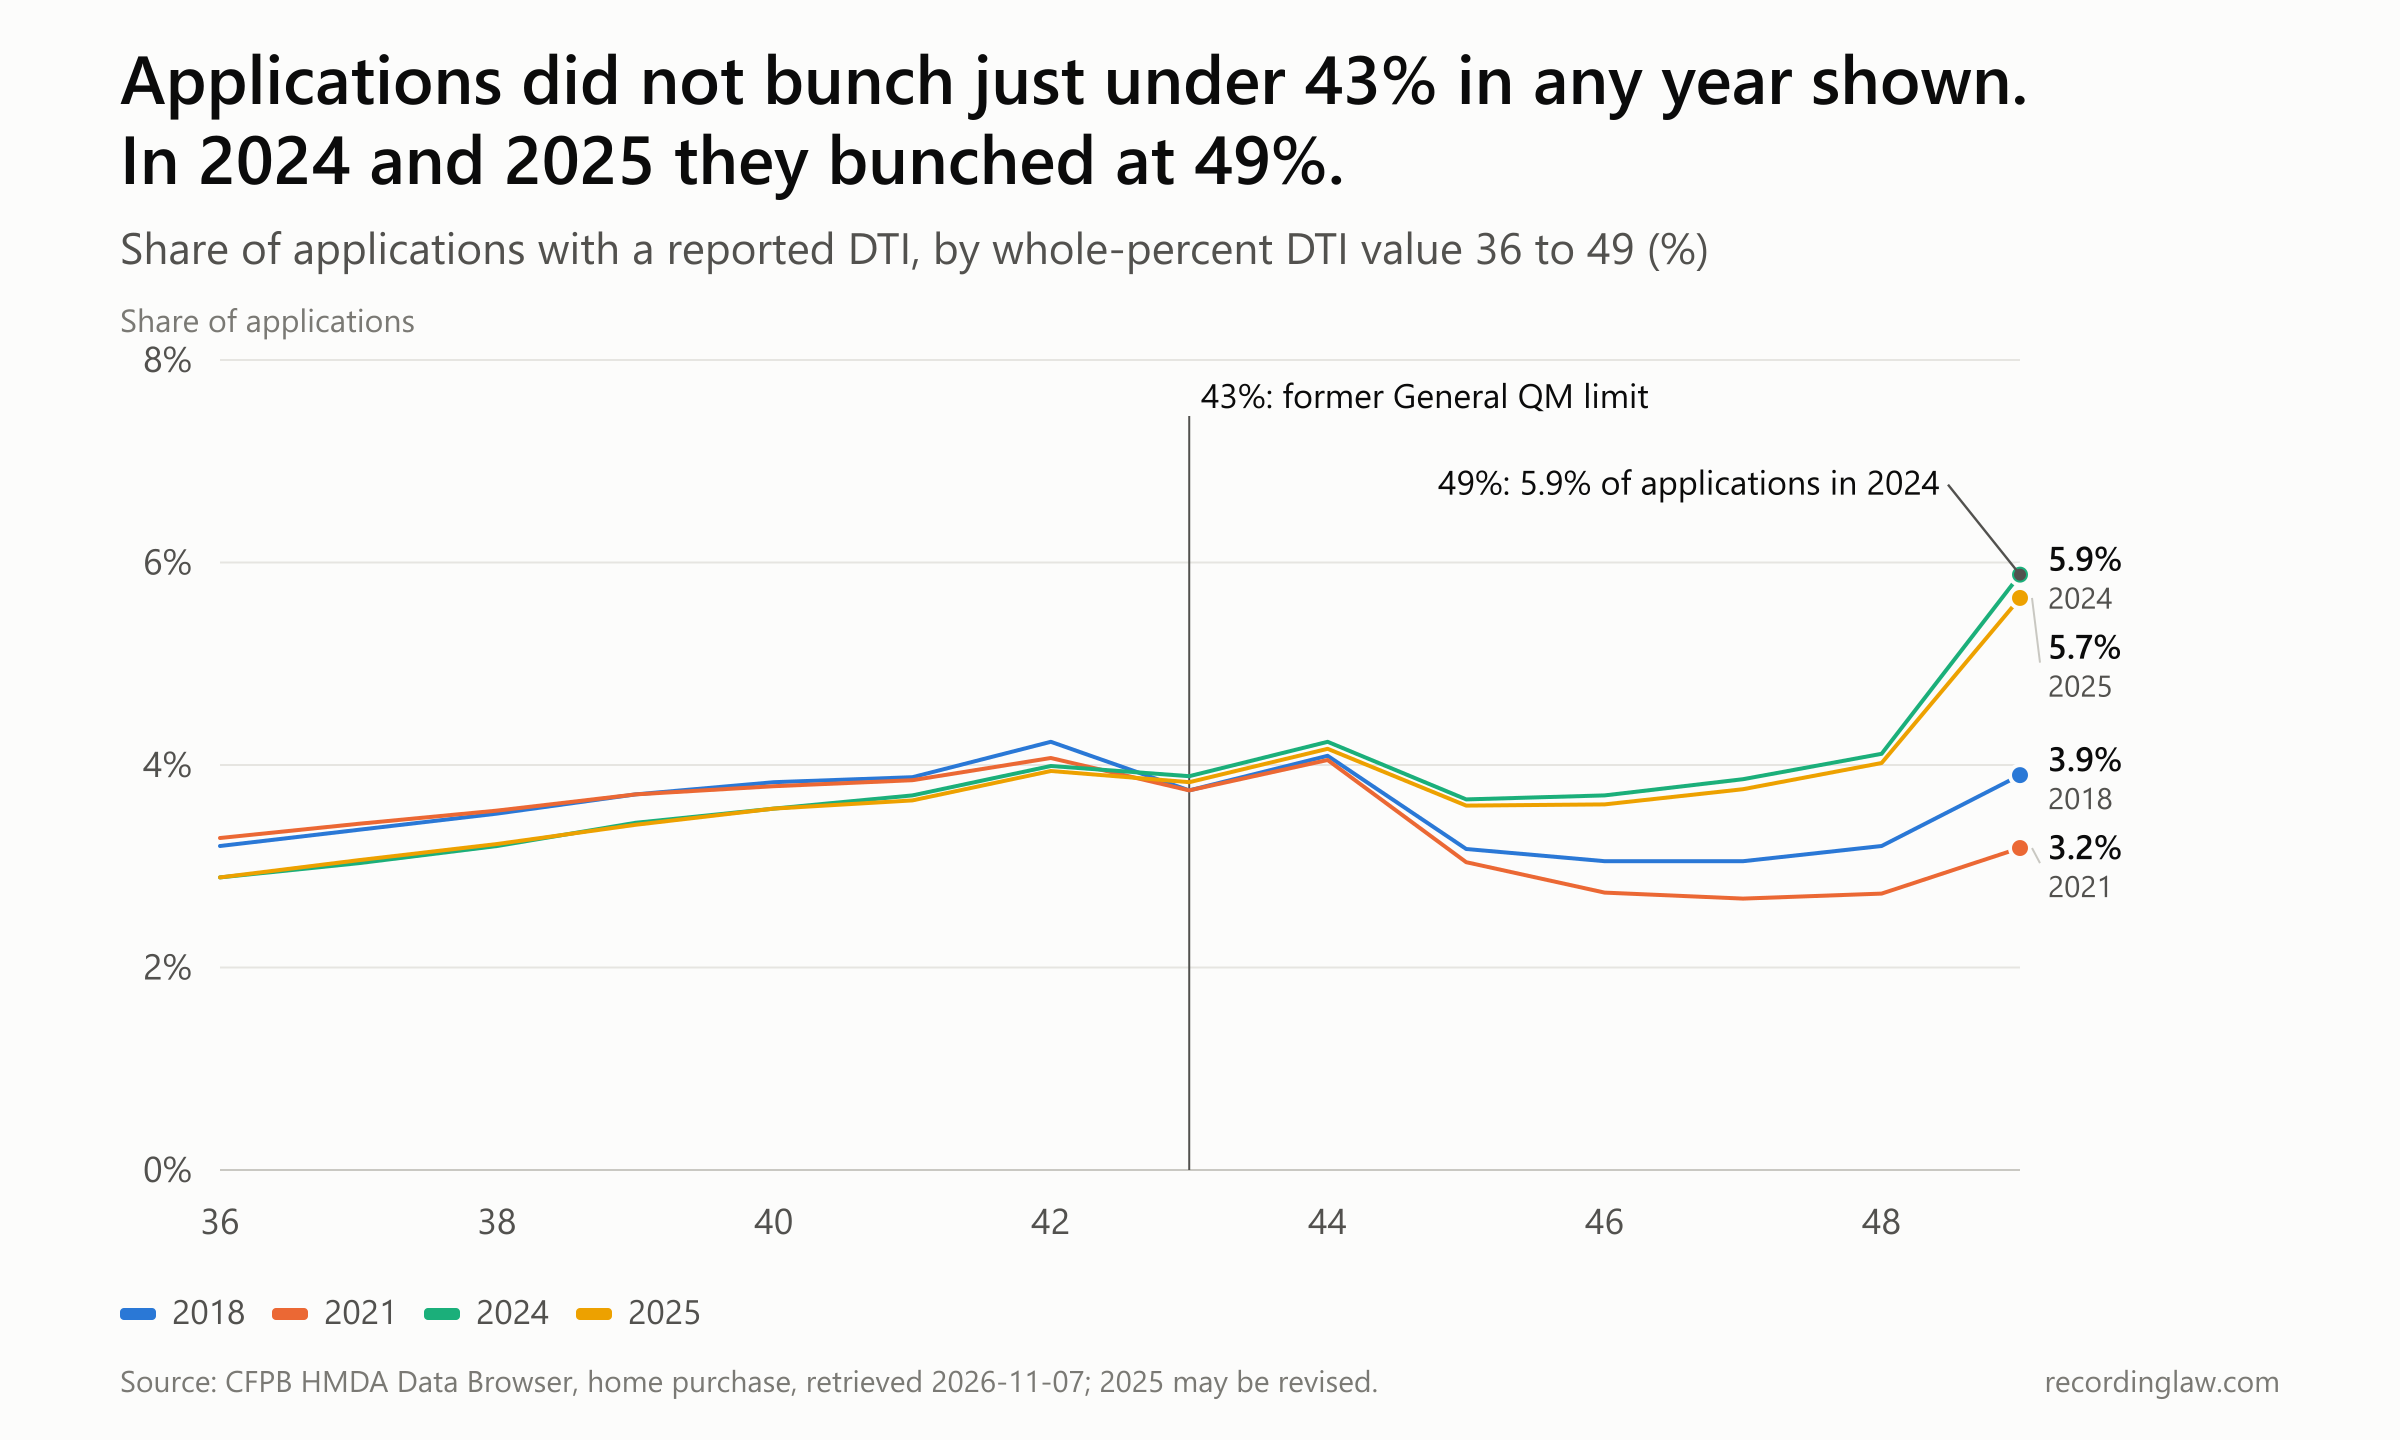
Share of home-purchase applications with a reported debt-to-income ratio at each whole-percent value from 36 to 49, in 2018, 2021, 2024 and 2025. The vertical line marks 43 percent, the former General QM limit, which expired legally on October 1, 2022. Source: CFPB HMDA Data Browser; author calculations; 2025 data may be revised.
| DTI | 2018 | 2021 | 2024 | 2025 |
|---|---|---|---|---|
| 42% | 4.23% | 4.07% | 3.99% | 3.94% |
| 43% | 3.75% | 3.75% | 3.89% | 3.83% |
| 44% | 4.09% | 4.05% | 4.23% | 4.16% |
| 48% | 3.20% | 2.73% | 4.11% | 4.02% |
| 49% | 3.90% | 3.18% | 5.88% | 5.65% |
There is no pile-up below 43. In 2018, when the cap still applied to loans outside the patch, 43 itself held fewer applications than either 42 or 44. "If anything, there are slightly fewer applications just below 43% than just above," the St. Louis Fed economists wrote.
The pile-up is at 49, the last whole-percent value before the 50 to 60 percent band. Its share of applications rose from 3.9 percent in 2018 to 5.9 percent in 2024, and was 5.7 percent in 2025. The data show where applications cluster, not why.
Who stops at 50?
If the wall at 50 is not in the CFPB's rule, the data narrow down where to look. HMDA records each application's loan type. This story groups them as conventional loans or as FHA, VA and USDA loans, which are government-backed. Split the applications by loan type and the 50 to 60 percent band looks like two different markets.
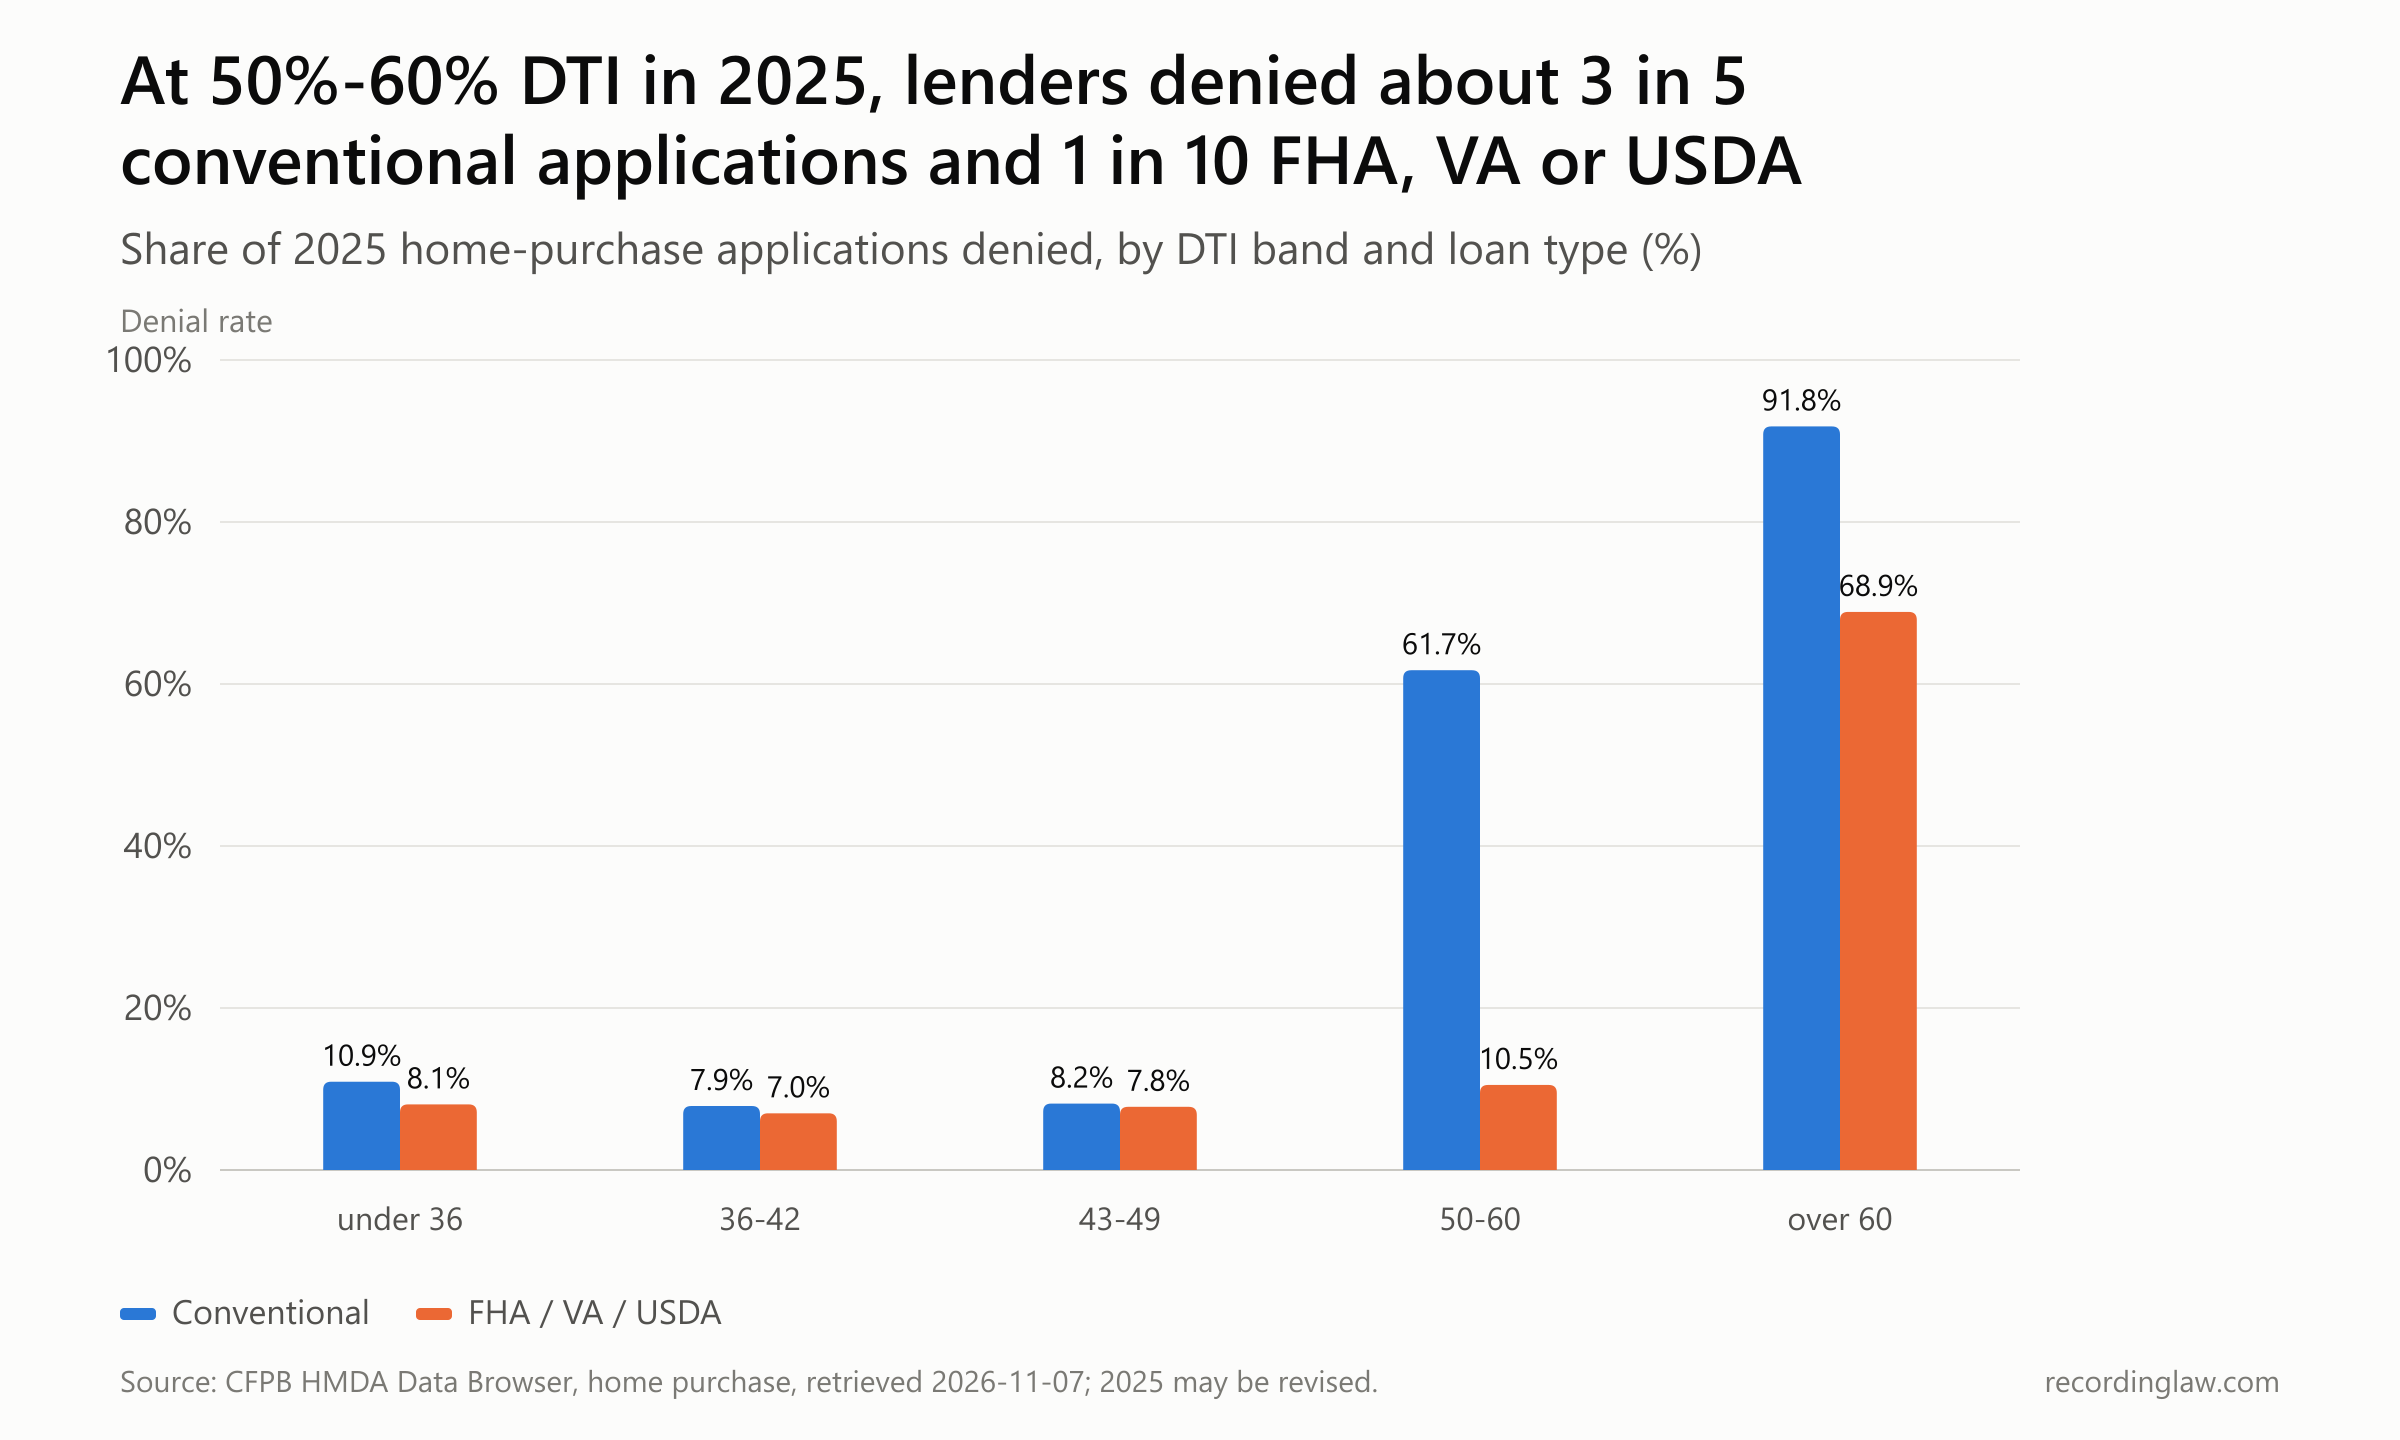
2025 denial rate by debt-to-income band, conventional versus FHA, VA and USDA home-purchase applications. Source: CFPB HMDA Data Browser; author calculations; 2025 data may be revised.
| Debt-to-income | Conventional 2018 | Conventional 2024 | Conventional 2025 | FHA/VA/USDA 2018 | FHA/VA/USDA 2024 | FHA/VA/USDA 2025 |
|---|---|---|---|---|---|---|
| Under 36% | 9.3% | 11.1% | 10.9% | 10.3% | 8.4% | 8.1% |
| 36% to 42% | 7.9% | 8.2% | 7.9% | 9.2% | 7.1% | 7.0% |
| 43% to 49% | 9.7% | 8.5% | 8.2% | 10.3% | 7.6% | 7.8% |
| 50% to 60% | 60.8% | 66.1% | 61.7% | 13.0% | 10.5% | 10.5% |
| Over 60% | 87.6% | 92.9% | 91.8% | 69.1% | 71.6% | 68.9% |
In 2025, about three in five conventional applications in the 50 to 60 percent band were denied. For FHA, VA and USDA loans in the same band, it was about one in ten, a few points above their rate at lower ratios. The jump past 49 is mostly a conventional-loan jump.
The government programs write their own limits. The VA's standard is "41 percent or less," with higher ratios allowed through added review and a residual-income test. FHA's qualified-mortgage definition, in its federal regulation, is based on loan price and has no debt-to-income term.
For FHA loans, HUD's 2014 manual-underwriting guidance allowed ratios up to 40 percent for housing payments and 50 percent for total debt with certain compensating factors. HUD said in 2013 that most FHA-insured loans are underwritten through its automated TOTAL Mortgage Scorecard.
Fannie Mae's own eligibility rules also set a ceiling. Its Selling Guide, as of November 10, 2026, caps debt-to-income at 50 percent for loans run through its automated underwriting system, Desktop Underwriter, and at 45 percent for manually underwritten loans.
A loan above those limits is not eligible for sale to Fannie Mae. That is one plausible reason conventional denials climb past 49, but HMDA does not record which rule a lender applied to any denial.
The 2020 rule did not put another debt-to-income number in place of 43. It uses price. The St. Louis Fed economists read the wall at 50 as lender practice: under the ability-to-repay standard, "lenders appear willing to extend this flexibility up to about 50%."
The ICBA's 2020 proposal would have capped its range of thresholds at the same number. And in January 2013, on the day the rule was announced, an Arkansas lender at First Security Bank had already said some investors allowed debt-to-income ratios up to 50 percent for borrowers with strong credit.
What the denial data cannot settle
HMDA carries debt-to-income only from 2018. The years when the 43 percent cap first applied, from 2014 on, cannot be seen on this measure. The post-crisis tightening of those years would blur any comparison anyway.
The ratio in the file is the one the lender reported. Denials also have reasons other than debt-to-income. In 2025, 231,000 of about 608,000 denied home-purchase applications listed debt-to-income among their reasons, which is 38 percent. The rest did not list it.
Debt still mattered to who was denied in recent years. The St. Louis Fed working paper behind the June post found that credit access is "highly sensitive to monetary policy" and that the Federal Reserve's 2022-2023 tightening "drove aggregate denial rates from 12.2% to 15.7% via the debt-to-income (DTI) channel." In this story's tally, the overall home-purchase denial rate went from 11.7 percent in 2021 to 15.0 percent in 2023, and was 13.9 percent in 2025. The paper's rates use a different denominator from this story's, so the two sets should not be mixed.
The Dallas and Atlanta Fed researchers' 2020 finding is about defaults: the default risk of high-debt loans shows up in periods of market stress. This story's data cover denials, not defaults, so they cannot test that finding.
Where the line sits now
In February 2021 the CFPB said it "will consider at a later date whether to initiate another rulemaking to reconsider other aspects of the General QM Final Rule." As of November 10, 2026, the Federal Register listed no CFPB rulemaking since January 2025 that revisited the General QM definition.
The Bureau took two other qualified-mortgage actions in that period. A January 2025 rule made PACE home-improvement financing ineligible for QM status. The other was the annual inflation adjustment to the price-threshold loan amounts, which the Bureau makes each January 1.
The next national look at where denials fall is the 2026 HMDA data, which regulators release annually and which is expected in 2027.
In Baltimore, Cordray called 43 percent "a clear line." In the lending data from 2018 to 2025, the clear step in denials comes after 49, in the 50 to 60 percent band, mostly in conventional loans. In 2025 lenders turned down about three in five conventional applications there. Fifty percent appears in Fannie Mae's underwriting limits, not in the 2020 rule.
How we measured
Denial rates. All denial rates come from the CFPB's HMDA Data Browser nationwide loan-level files for 2018 to 2025, filtered to home-purchase loans (loan purpose 1) with action taken 1, 2 or 3. Denial rate is denied applications divided by originated loans plus applications approved but not accepted plus denied applications. Withdrawn and incomplete files are excluded. All occupancy, lien and property types are included, and all loan types unless "conventional" (loan type 1) or "FHA/VA/USDA" (loan types 2 to 4) is stated. Because the Data Browser API cannot group by debt-to-income, the filtered files were streamed and tallied by debt-to-income value, action taken and loan type.
Counts. The tallied files contain 41.0 million home-purchase applications with a decision from 2018 to 2025 (5,196,305 in 2018; 5,345,166 in 2019; 5,859,387 in 2020; 6,337,348 in 2021; 5,296,326 in 2022; 4,254,263 in 2023; 4,319,109 in 2024; 4,358,716 in 2025). The 2024 and 2025 totals match the Data Browser API counts: in 2025, 3,592,033 originated, 158,865 approved but not accepted and 607,818 denied. The 2025 data may be revised by resubmissions after our retrieval on November 7, 2026.
Debt-to-income values. HMDA reports whole percentages from 36 to 49 and bands elsewhere (under 20, 20 to under 30, 30 to under 36, 50 to 60, over 60). The 50 to 60 band cannot show whether denials change at exactly 50. Application shares use applications with a reported ratio as the denominator, excluding "NA" and "Exempt."
Arithmetic in the text. "About 1 in 13" is the 2025 denial rate at 43 percent (7.7 percent). "About three times as high" in the opening compares 22.9 percent (50 to 60 percent band, 2025) with 7.7 percent (exactly 43 percent, 2025; the rate at 49 percent was also 7.7 percent); the ratio is 2.97. "2.9 to 3.7 times" compares the 50 to 60 percent band with the 36 to 42 percent band in each year: from 2.9 (2018) to 3.7 (2021). "About three in five" is 61.7 percent; "about one in ten" is 10.5 percent. The 38 percent share of denials citing debt-to-income is 231,003 of 607,818 denials in 2025 with code 1 in any of the four denial-reason fields. A denial can list several reasons, and the share is for 2025 only. The title's "about three times" compares the 50 to 60 percent band with exactly 43 percent in each year from 2018 to 2025: the ratio runs from 2.7 (2018) to 3.5 (2021), and is 3.0 in 2025. "23% to 26% every year" on the band chart rounds the 50 to 60 percent band's range of 22.6 percent (2019) to 26.3 percent (2022).
The St. Louis Fed study. García and Garriga's estimates come from a regression-discontinuity analysis and bunching test on HMDA home-purchase applications from 2018 to 2024, with binned ratios converted to midpoints (St. Louis Fed working paper 2026-007, not peer reviewed; the figures cited here are from the June 2026 blog post and the working paper's abstract). Their baseline denial rate of about 15 percent for 2024 uses a different denominator from ours (14.45 percent for all loan types, 15.54 percent for conventional loans), so their rates and ours should not be mixed. Their post describes 43 percent as set by Congress in the Dodd-Frank Act. The statute leaves the ratio to the Bureau, and 43 percent is from the CFPB's 2013 rule.
Dates. The 2013 rule was issued January 10, 2013, and took effect January 10, 2014. The replacement rule was issued December 10, 2020, took effect March 1, 2021, and had a mandatory compliance date of July 1, 2021, delayed on April 27, 2021, to October 1, 2022. Fannie Mae and Freddie Mac stopped buying patch loans for applications received on or after July 1, 2021, under the January 14, 2021, amendments to their agreements with the Treasury.
What this cannot show. HMDA is observational. Patterns in denial rates do not show what the 43 percent rule caused, and cannot capture applications never filed or loans routed to other programs. Lender-reported ratios may differ from the ratio used in the decision. The CFPB's 2019 assessment, which did measure the rule's effect, used application data from nine lenders that are not public. The FHA figures cited are from HUD's 2014 guidance; the current HUD handbook may differ. The Fannie Mae limits cited are from Selling Guide section B3-6-02 as dated April 2, 2025, and live on November 10, 2026; they may not describe the limits in force in 2018 to 2024.
Frequently Asked Questions
What was the 43% debt-to-income rule for mortgages?
Under the CFPB's ability-to-repay rule, which took effect January 10, 2014, a standard (General) qualified mortgage required the borrower's total monthly debt to be no more than 43% of monthly income. Loans eligible for purchase by Fannie Mae or Freddie Mac could qualify above 43% under a temporary exception, and FHA, VA and USDA loans had their own definitions.
Is the 43% DTI limit still in effect?
No. The CFPB's December 2020 rule removed the 43% limit from the General QM definition and replaced it with price-based thresholds. Compliance with the new rule became mandatory on October 1, 2022, after a delay from July 1, 2021.
Did Congress set the 43% debt-to-income limit?
No. The Dodd-Frank Act's qualified-mortgage definition refers to guidelines or regulations established by the Bureau relating to debt-to-income ratios. The 43% figure came from the CFPB's 2013 rule.
What was the GSE patch, and when did it end?
The patch, formally the Temporary GSE QM definition, let loans eligible for purchase by Fannie Mae or Freddie Mac be qualified mortgages even above 43% debt-to-income. Fannie and Freddie stopped buying patch loans for applications after June 30, 2021, under amended agreements with the Treasury. The patch expired legally on October 1, 2022.
At what debt-to-income ratio are mortgages usually denied?
In 2025 HMDA home-purchase data, denial rates stayed between 7.6% and 8.8% from 30% to 49% debt-to-income. They rose to 22.9% in the 50% to 60% band and reached 85.2% above 60%. For conventional loans the 50% to 60% band was denied 61.7% of the time; for FHA, VA and USDA loans, 10.5%. These are national averages, not a prediction for any one application.
Can an FHA or VA loan go above 43% debt-to-income?
Yes, under those programs' own rules. FHA's qualified-mortgage definition is price-based, and HUD's 2014 manual-underwriting guidance allowed up to 50% total debt with compensating factors. VA's standard is 41% or less, with higher ratios allowed through added review and a residual-income test. Current lender requirements may differ.
How many mortgage denials are because of debt-to-income?
In 2025, 231,003 of 607,818 denied home-purchase applications, about 38%, listed debt-to-income ratio among their denial reasons in HMDA data. Lenders can list up to four reasons, so this is not the share denied for debt-to-income alone.
Updates
Reworded for readability. No figures, quotes, sources or findings changed.
Restructured as a feature: chart titles state the finding, side details moved to How we measured. Every figure and quote was re-checked against its source.
Independently fact-checked against the cited primary sources
Independently fact-checked against the cited primary sources
Sources and References
- CFPB/FFIEC HMDA Data Browser, nationwide home-purchase loan-level data, 2018-2025 (retrieved Oct 31 and Nov 7, 2026)(ffiec.cfpb.gov).gov
- HMDA Data Browser API, 2025 home-purchase counts by action taken(ffiec.cfpb.gov).gov
- Manu García and Carlos Garriga, What 30 Million Applications Reveal About Mortgage Denial Thresholds, St. Louis Fed On the Economy, June 4, 2026(stlouisfed.org)
- García and Garriga, The Determinants of Mortgage Denial Using Public Data, St. Louis Fed Working Paper 2026-007 (April 29, 2026)(fedinprint.org)
- CFPB, Prepared Remarks of Richard Cordray at the Ability-to-Repay Rule Field Hearing, Jan 10, 2013(consumerfinance.gov).gov
- CFPB blog, field hearing notice for Baltimore, Jan 10, 2013(consumerfinance.gov).gov
- Ability-to-Repay and Qualified Mortgage Standards final rule, 78 FR 6408 (Jan 30, 2013)(federalregister.gov).gov
- 15 U.S.C. 1639c (Truth in Lending Act section 129C, added by the Dodd-Frank Act)(law.cornell.edu)
- CFPB, Ability-to-Repay Rule: Fact vs. Fiction (December 2013)(files.consumerfinance.gov).gov
- CFPB, Ability-to-Repay and Qualified Mortgage Rule Assessment Report (January 2019)(files.consumerfinance.gov).gov
- Qualified Mortgage Definition (General QM Loan Definition) final rule, 85 FR 86308 (Dec 29, 2020)(federalregister.gov).gov
- CFPB rule page, General QM Loan Definition(consumerfinance.gov).gov
- CFPB press release, Dec 10, 2020(consumerfinance.gov).gov
- Delay of mandatory compliance date, 86 FR 22844 (Apr 30, 2021)(federalregister.gov).gov
- CFPB press release, Apr 27, 2021(consumerfinance.gov).gov
- CFPB public statement on General QM and Seasoned QM final rules, 86 FR 11623 (Feb 26, 2021)(federalregister.gov).gov
- Truth in Lending annual threshold adjustments, FR Doc 2025-22773 (Dec 15, 2025)(federalregister.gov).gov
- Fannie Mae Lender Letter LL-2021-09, Apr 8, 2021(singlefamily.fanniemae.com)
- Freddie Mac Guide Bulletin 2021-13, Apr 8, 2021 (lender-hosted mirror; guide.freddiemac.com requires login)(tenaco.com)
- Mortgage Bankers Association comment letter to the CFPB, July 9, 2012(consumerfinancemonitor.com)
- Talk Business & Politics, New mortgage qualification rules unveiled, January 2013(talkbusiness.net)
- Inman News, Jan 10, 2013(inman.com)
- The Real Deal, Qualified mortgage rules go into effect, Jan 10, 2014(therealdeal.com)
- Written statement of Bill Emerson, House Financial Services subcommittee hearing, Jan 14, 2014(financialservices.house.gov).gov
- National Association of Realtors, statement for the record, Jan 14, 2014 hearing(narfocus.com)
- W. Scott Frame, Kristopher Gerardi, Daniel Sexton and Joseph Tracy, Dallas Fed Economics, Mar 24, 2020(dallasfed.org)
- Kate Berry, Consumer groups, lenders find common cause against CFPB mortgage provision, American Banker/National Mortgage News, Aug 27, 2019(nationalmortgagenews.com)
- HousingWire, Housing industry calls for end of QM patch DTI limit, Sept 17, 2019(housingwire.com)
- Consumer, civil-rights and fair-housing coalition letter to CFPB Director Kraninger, Sept 10, 2019(consumerfed.org)
- Independent Banker (ICBA), ICBA offers alternative to redefining QM (2020)(independentbanker.org)
- MBA statement on CFPB final General QM and Seasoned QM rules, December 2020(newslink.mba.org)
- Center for Responsible Lending and National Fair Housing Alliance joint statement, Dec 11, 2020(nationalfairhousing.org)
- MBA Newslink, MBA Urges No Delay to CFPB QM Final Rule (April 2021)(newslink.mba.org)
- 24 CFR 203.19, FHA qualified mortgage definition(ecfr.gov).gov
- HUD Mortgagee Letter 2014-02, FHA manual underwriting(hud.gov).gov
- HUD press release 13-188, Dec 11, 2013(archives.hud.gov).gov
- 38 CFR 36.4340, VA underwriting standards(ecfr.gov).gov
- Fannie Mae Selling Guide B3-6-02, Debt-to-Income Ratios (04/02/2025)(selling-guide.fanniemae.com)
- Center for Responsible Lending, About CRL(responsiblelending.org)