Shoplifting 2019 to 2023: Flat in FBI SRS Estimates, Up 17.5% in Current NIBRS Data

Independently fact-checked against primary sources (last audited November 6, 2026). · 13 primary sources cited on this page. How we verify our legal content
How much has shoplifting changed since 2019? In FBI-based data, the answer depends on which dataset you open. FBI Summary Reporting System (SRS) estimates published by the Council on Criminal Justice (CCJ) put shoplifting at 1,148,539 incidents in 2019 and 1,149,336 in 2023, essentially the same number.
CCJ's published National Incident-Based Reporting System (NIBRS) rate went from 159.3 to 308.8 shoplifting offenses per 100,000 people over the same years, 93% higher, a figure CCJ notes the FBI later revised. The FBI's Crime Data Explorer (CDE), as retrieved in October 2026, shows a NIBRS rate of 295.7 in 2019 and 347.5 in 2023, 17.5% higher.
Over those years, the share of the US population living in areas whose police agencies report to NIBRS rose from 51.9% to 84.9%. In a fixed group of 17 states that reported near-complete NIBRS data throughout, the 2023 rate was 2.9% below 2019. Police data from Chicago, Los Angeles and New York City moved in three different directions.
One crime, three national answers
The FBI has collected crime data through two systems. The SRS shoplifting figures are FBI estimates of incident counts. According to CCJ, the FBI produced them by calculating the share of larceny incidents that were shoplifting, using agencies that sent supplemental data on larceny types (13,848 agencies in 2019 and 15,298 in 2023, including NIBRS agencies). NIBRS figures on the CDE are rates: offenses per 100,000 people living in the areas of the agencies that report to NIBRS.
Because one series is an estimated count and the others are rates, the chart below indexes each to its 2019 value (2019 = 100). That puts them on one scale. It shows how each line moved relative to 2019, not how many shoplifting incidents there were.
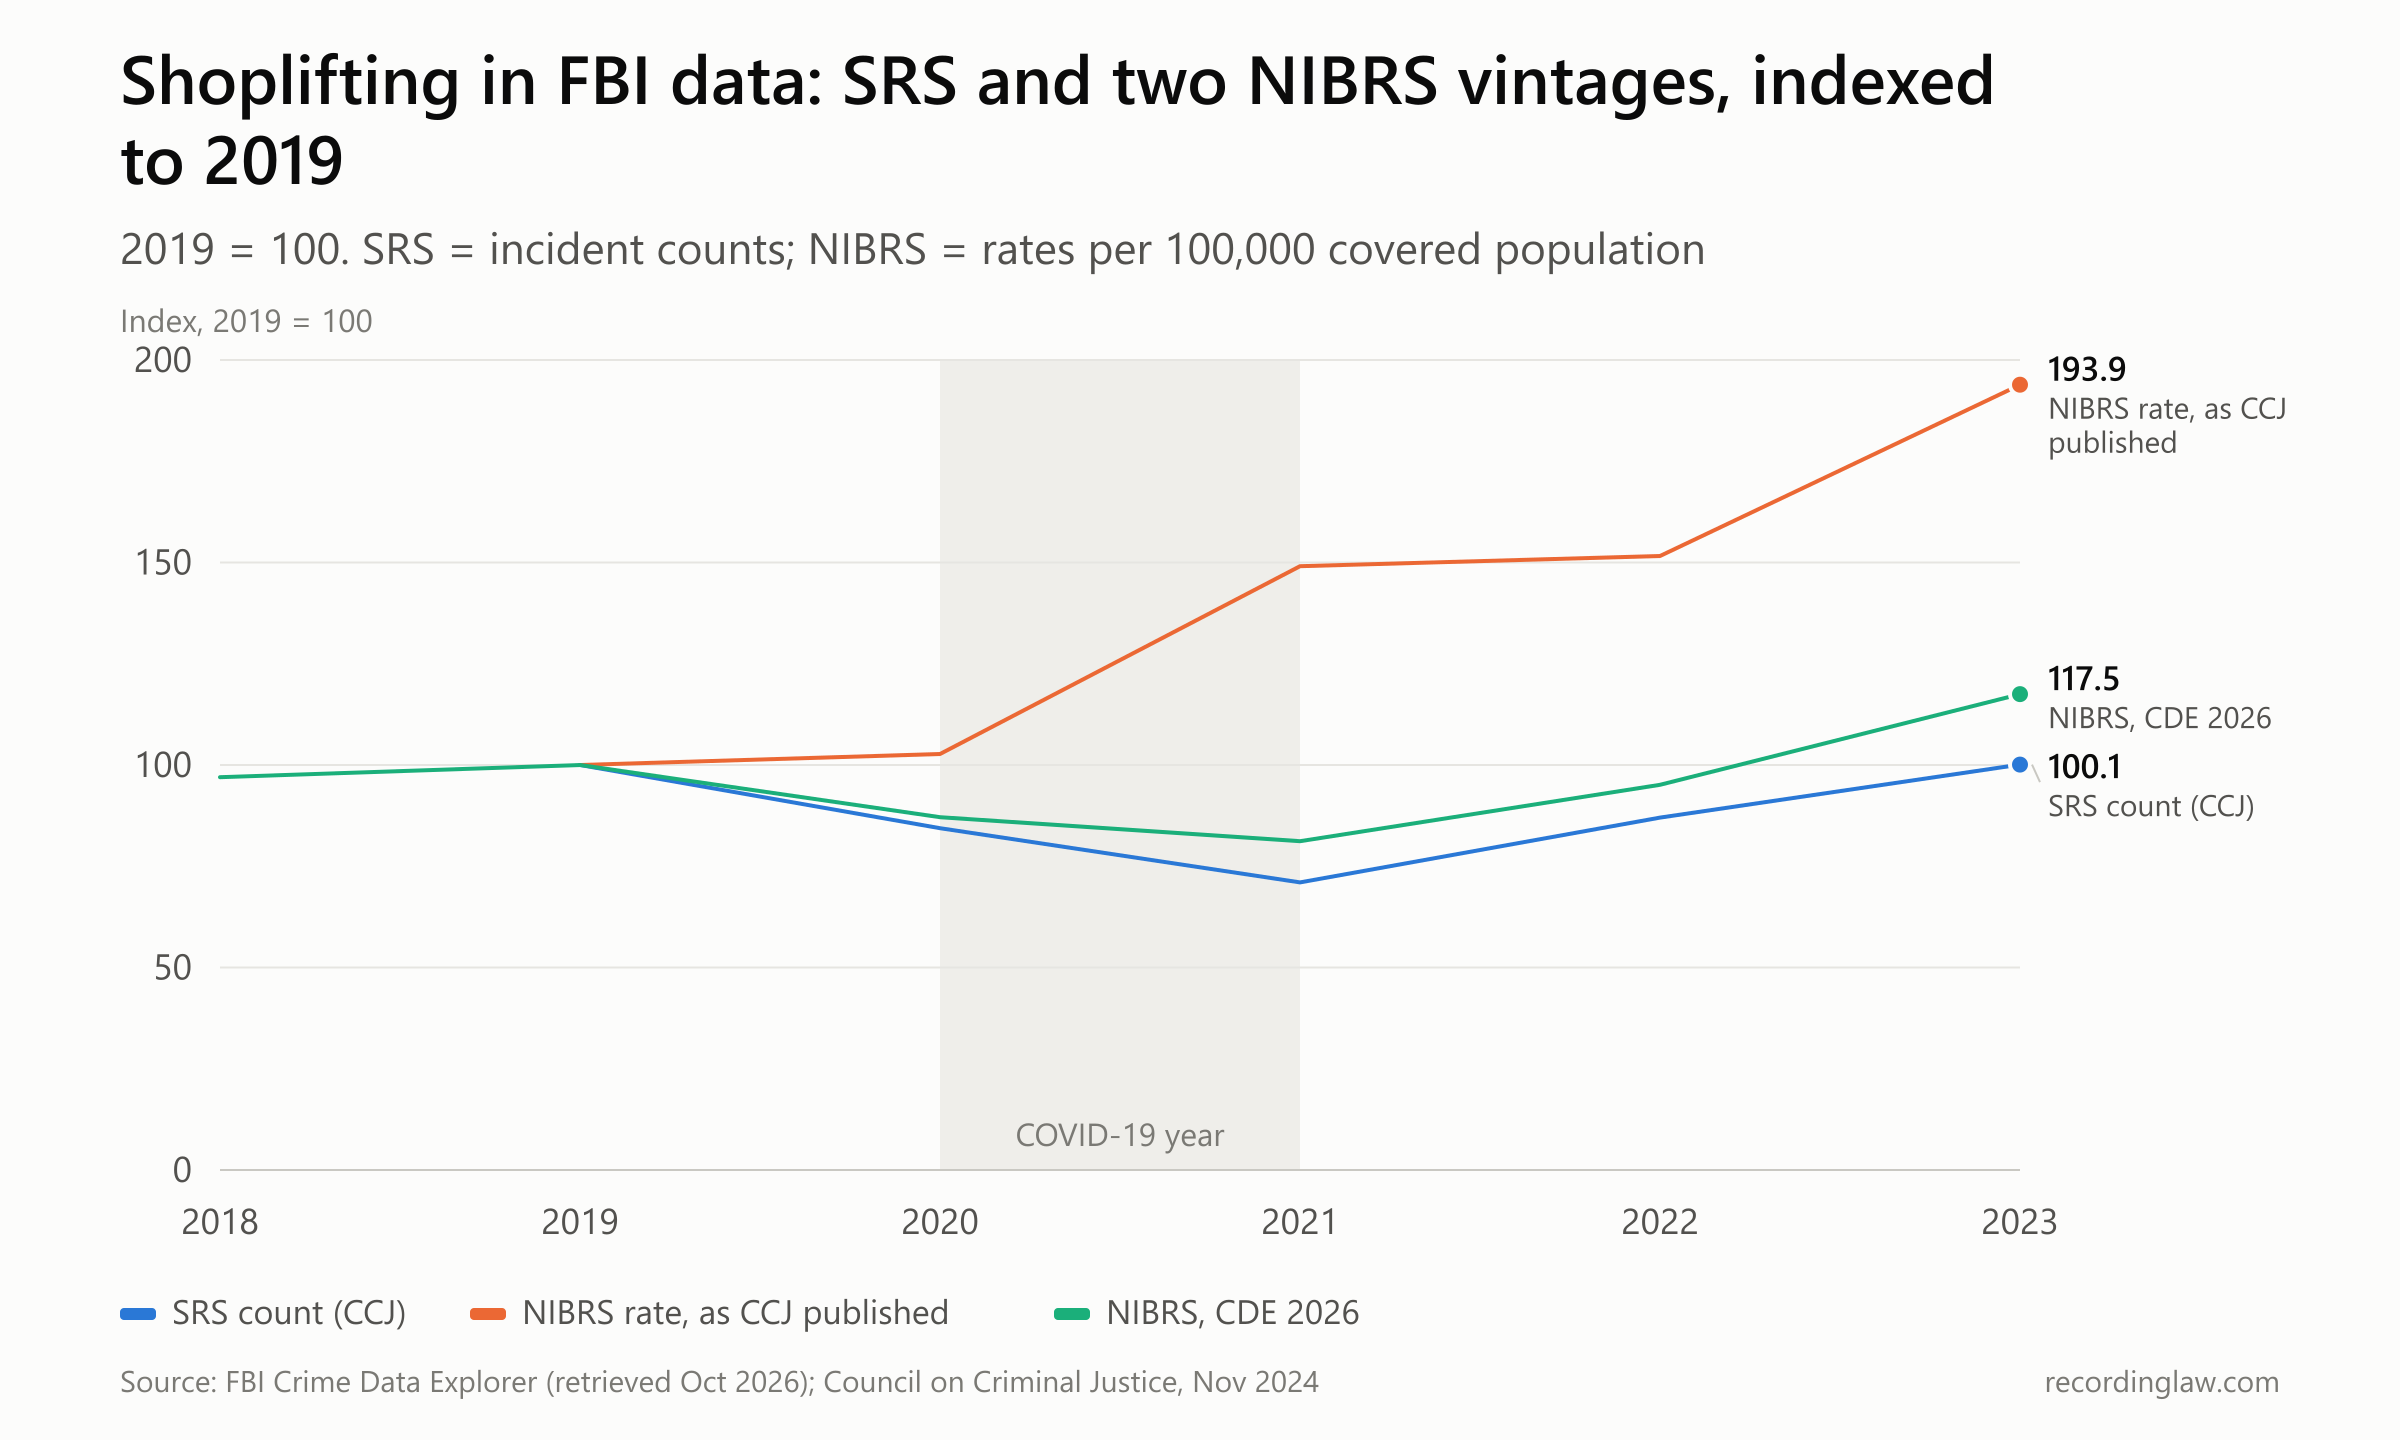
Source: Council on Criminal Justice, "Between the Aisles" (SRS estimates and its published NIBRS rates, 2019-2023); FBI Crime Data Explorer, NIBRS offense 23C, retrieved October 2026.
| Year | SRS estimated incidents (CCJ) | NIBRS rate, as CCJ published | NIBRS rate, CDE Oct 2026 |
|---|---|---|---|
| 2018 | not published | not published | 286.9 |
| 2019 | 1,148,539 | 159.3 | 295.7 |
| 2020 | 968,972 | 163.6 | 257.7 |
| 2021 | 815,746 | 237.5 | 240.1 |
| 2022 | 999,394 | 241.5 | 281.1 |
| 2023 | 1,149,336 | 308.8 | 347.5 |
The SRS estimate fell 15.6% from 2019 to 2020 (CCJ rounds this to 16%), reached 815,746 in 2021, and was back at its 2019 level in 2023.
The two NIBRS lines describe the same offense in the same years but do not match. In CCJ's published version, the rate rose in 2020 and again in 2021. In the version the CDE shows today, the rate fell in both of those years, to 240.1 in 2021, then rose to 347.5 in 2023.
CCJ states that the FBI revised the rates after CCJ published its figures. The current FBI data does not reproduce CCJ's published numbers.
The coverage behind the NIBRS line
NIBRS participation grew quickly over this period. According to CCJ, 8,497 agencies submitted NIBRS data to the FBI in 2019 and 16,334 did in 2023. Elsewhere in the same report, CCJ gives 16,334 as the 2023 total of agencies reporting through either SRS or NIBRS. Among agencies serving cities of 250,000 or more, the share in NIBRS went from 46% to 86%.
The CDE's own population figures show the same growth. The chart below gives the share of the US population living in NIBRS-reporting agencies' areas each year.
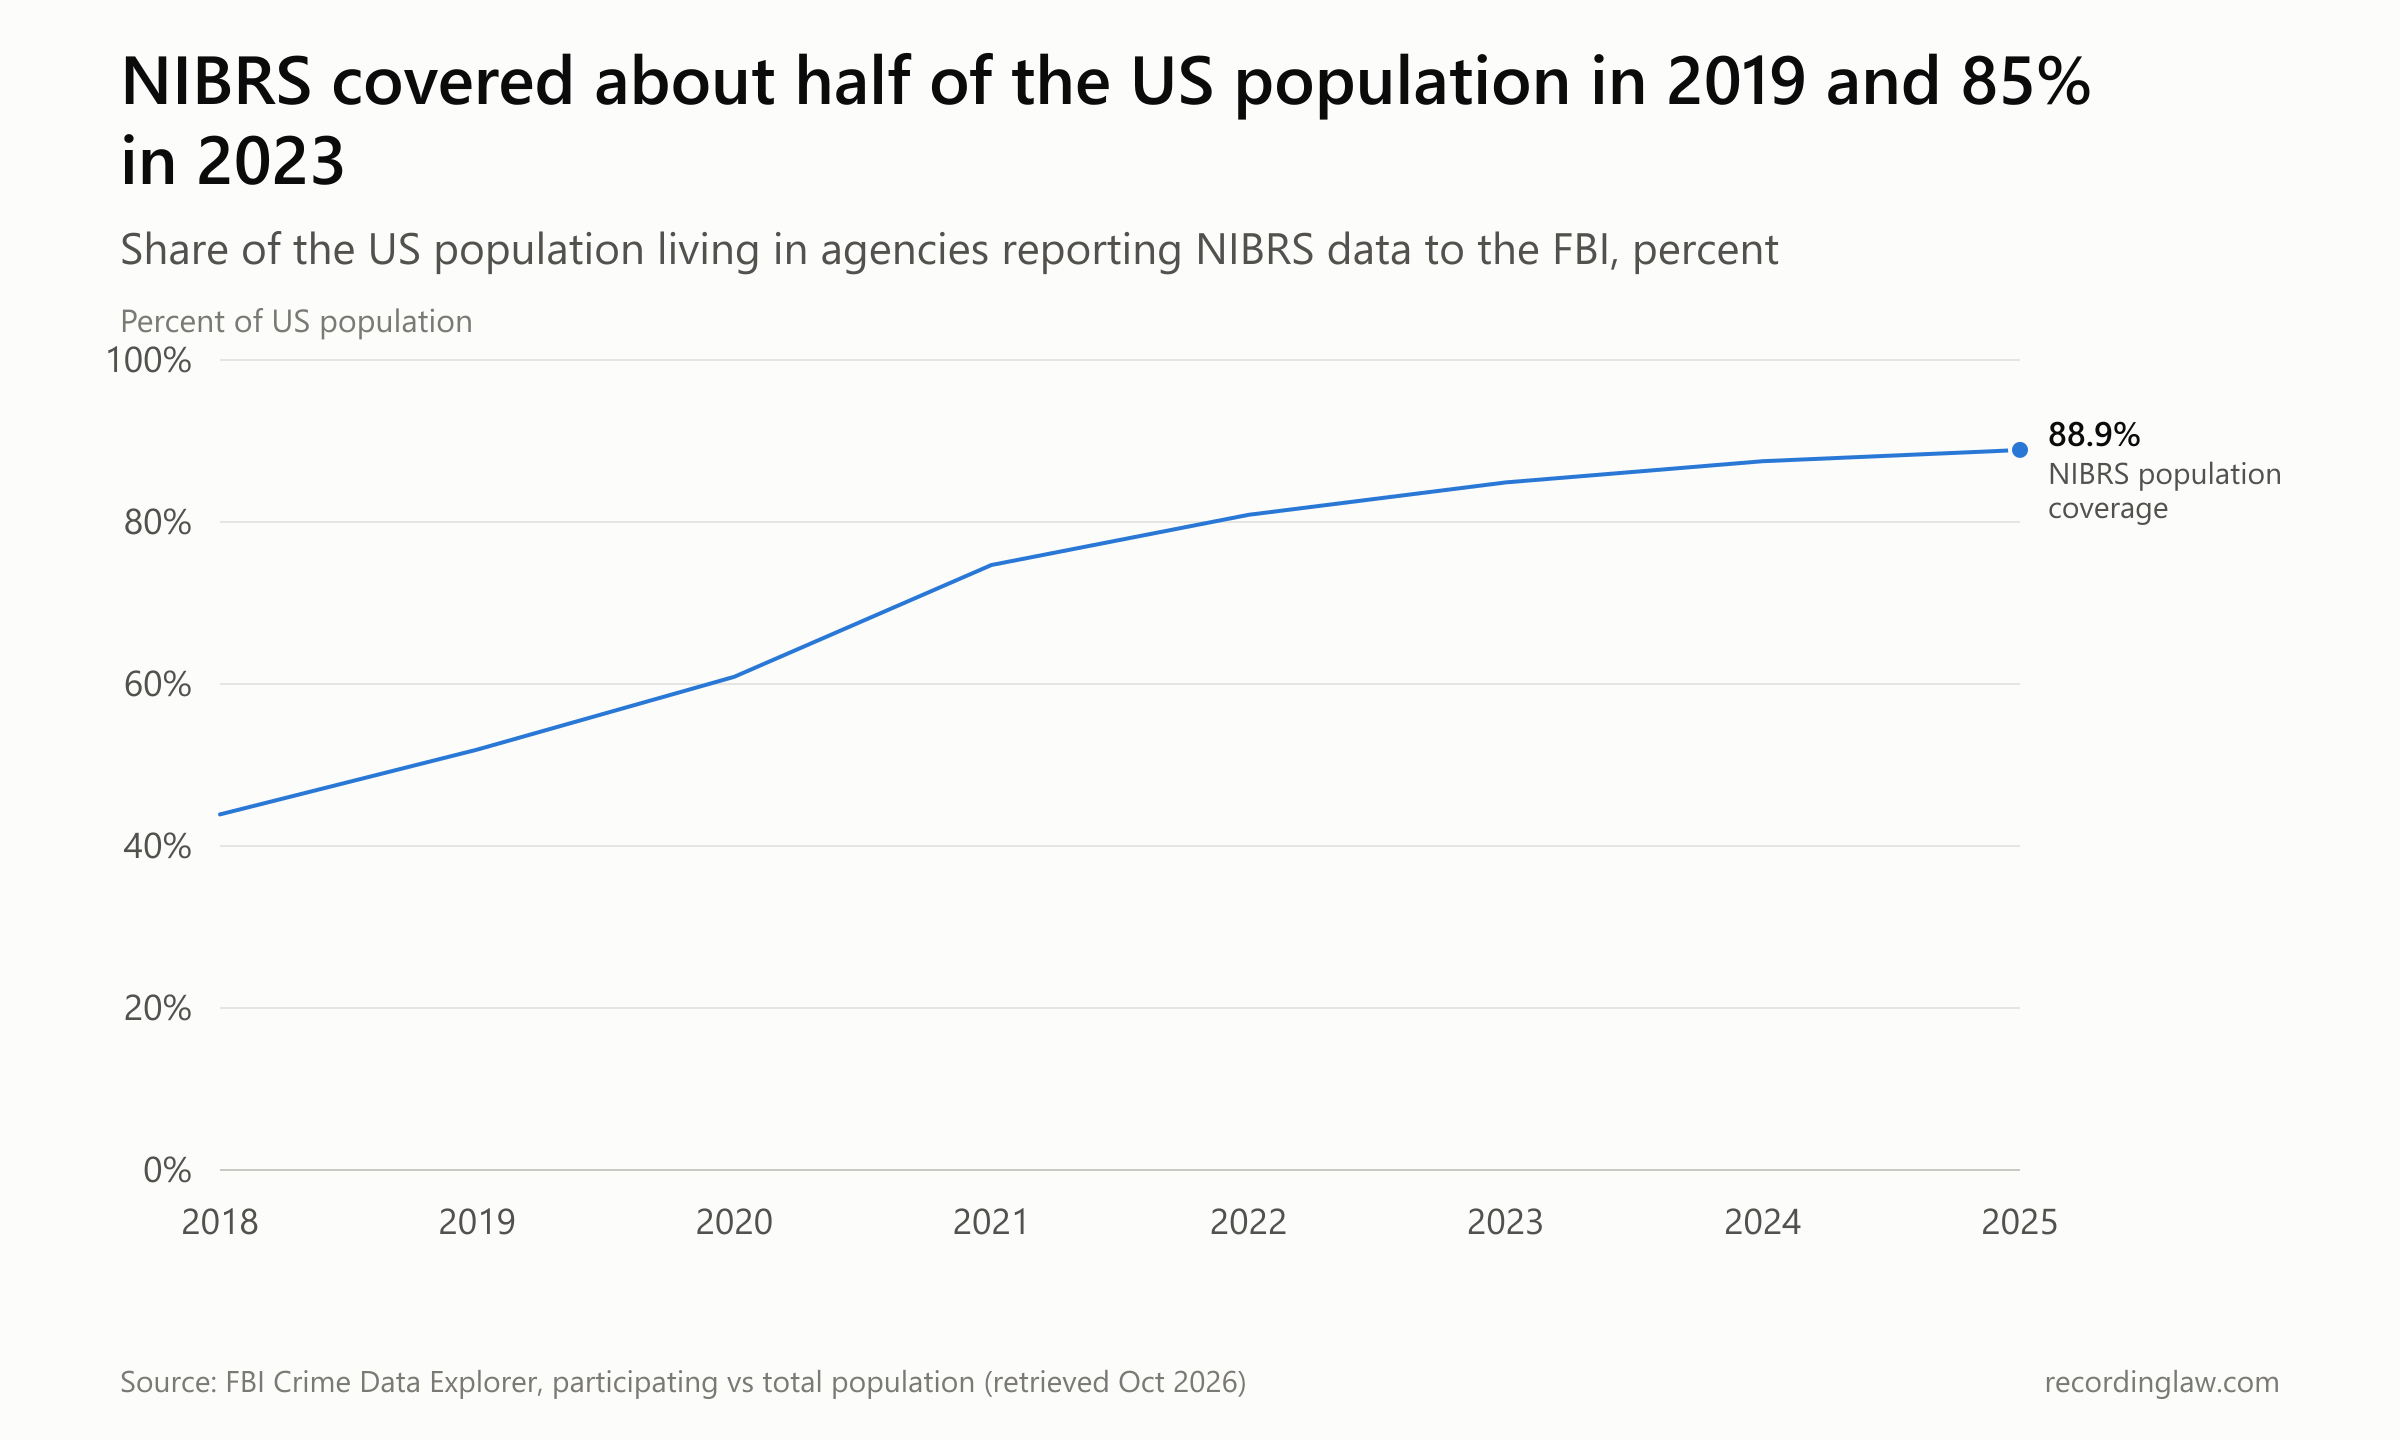
Source: FBI Crime Data Explorer, participating population divided by total population, average of 12 months, retrieved October 2026.
| Year | Population covered by NIBRS | NIBRS shoplifting incidents (CDE) |
|---|---|---|
| 2018 | 43.9% | 416,140 |
| 2019 | 51.9% | 509,038 |
| 2020 | 60.9% | 521,900 |
| 2021 | 74.7% | 602,229 |
| 2022 | 80.9% | 766,261 |
| 2023 | 84.9% | 998,947 |
| 2024 | 87.5% | 1,128,230 |
| 2025 | 88.9% | 1,077,353 |
The raw NIBRS incident count nearly doubled from 2019 to 2023, while the NIBRS rate rose 17.5%. The count grew partly because more agencies were reporting, so year-to-year counts are not comparable.
The rate adjusts for how many people are covered, but not for which places are covered. If the places that joined NIBRS later have higher or lower shoplifting rates than the places that reported from the start, the national rate moves even when nothing changes in any one place.
Holding the states constant
One way to reduce that effect is to follow the same places every year. We built an approximate fixed panel from the CDE's state-level NIBRS data: every state whose NIBRS population coverage never fell under 90% in any month from January 2018 to December 2025.
Seventeen states met that test: Arkansas, Colorado, Delaware, Idaho, Iowa, Kentucky, Michigan, Montana, New Hampshire, North Dakota, Oregon, Rhode Island, South Carolina, Tennessee, Vermont, Virginia and Washington. California, Illinois and New York are not among them. The panel rate is the sum of the 17 states' shoplifting incidents divided by their average covered population, per 100,000 people.
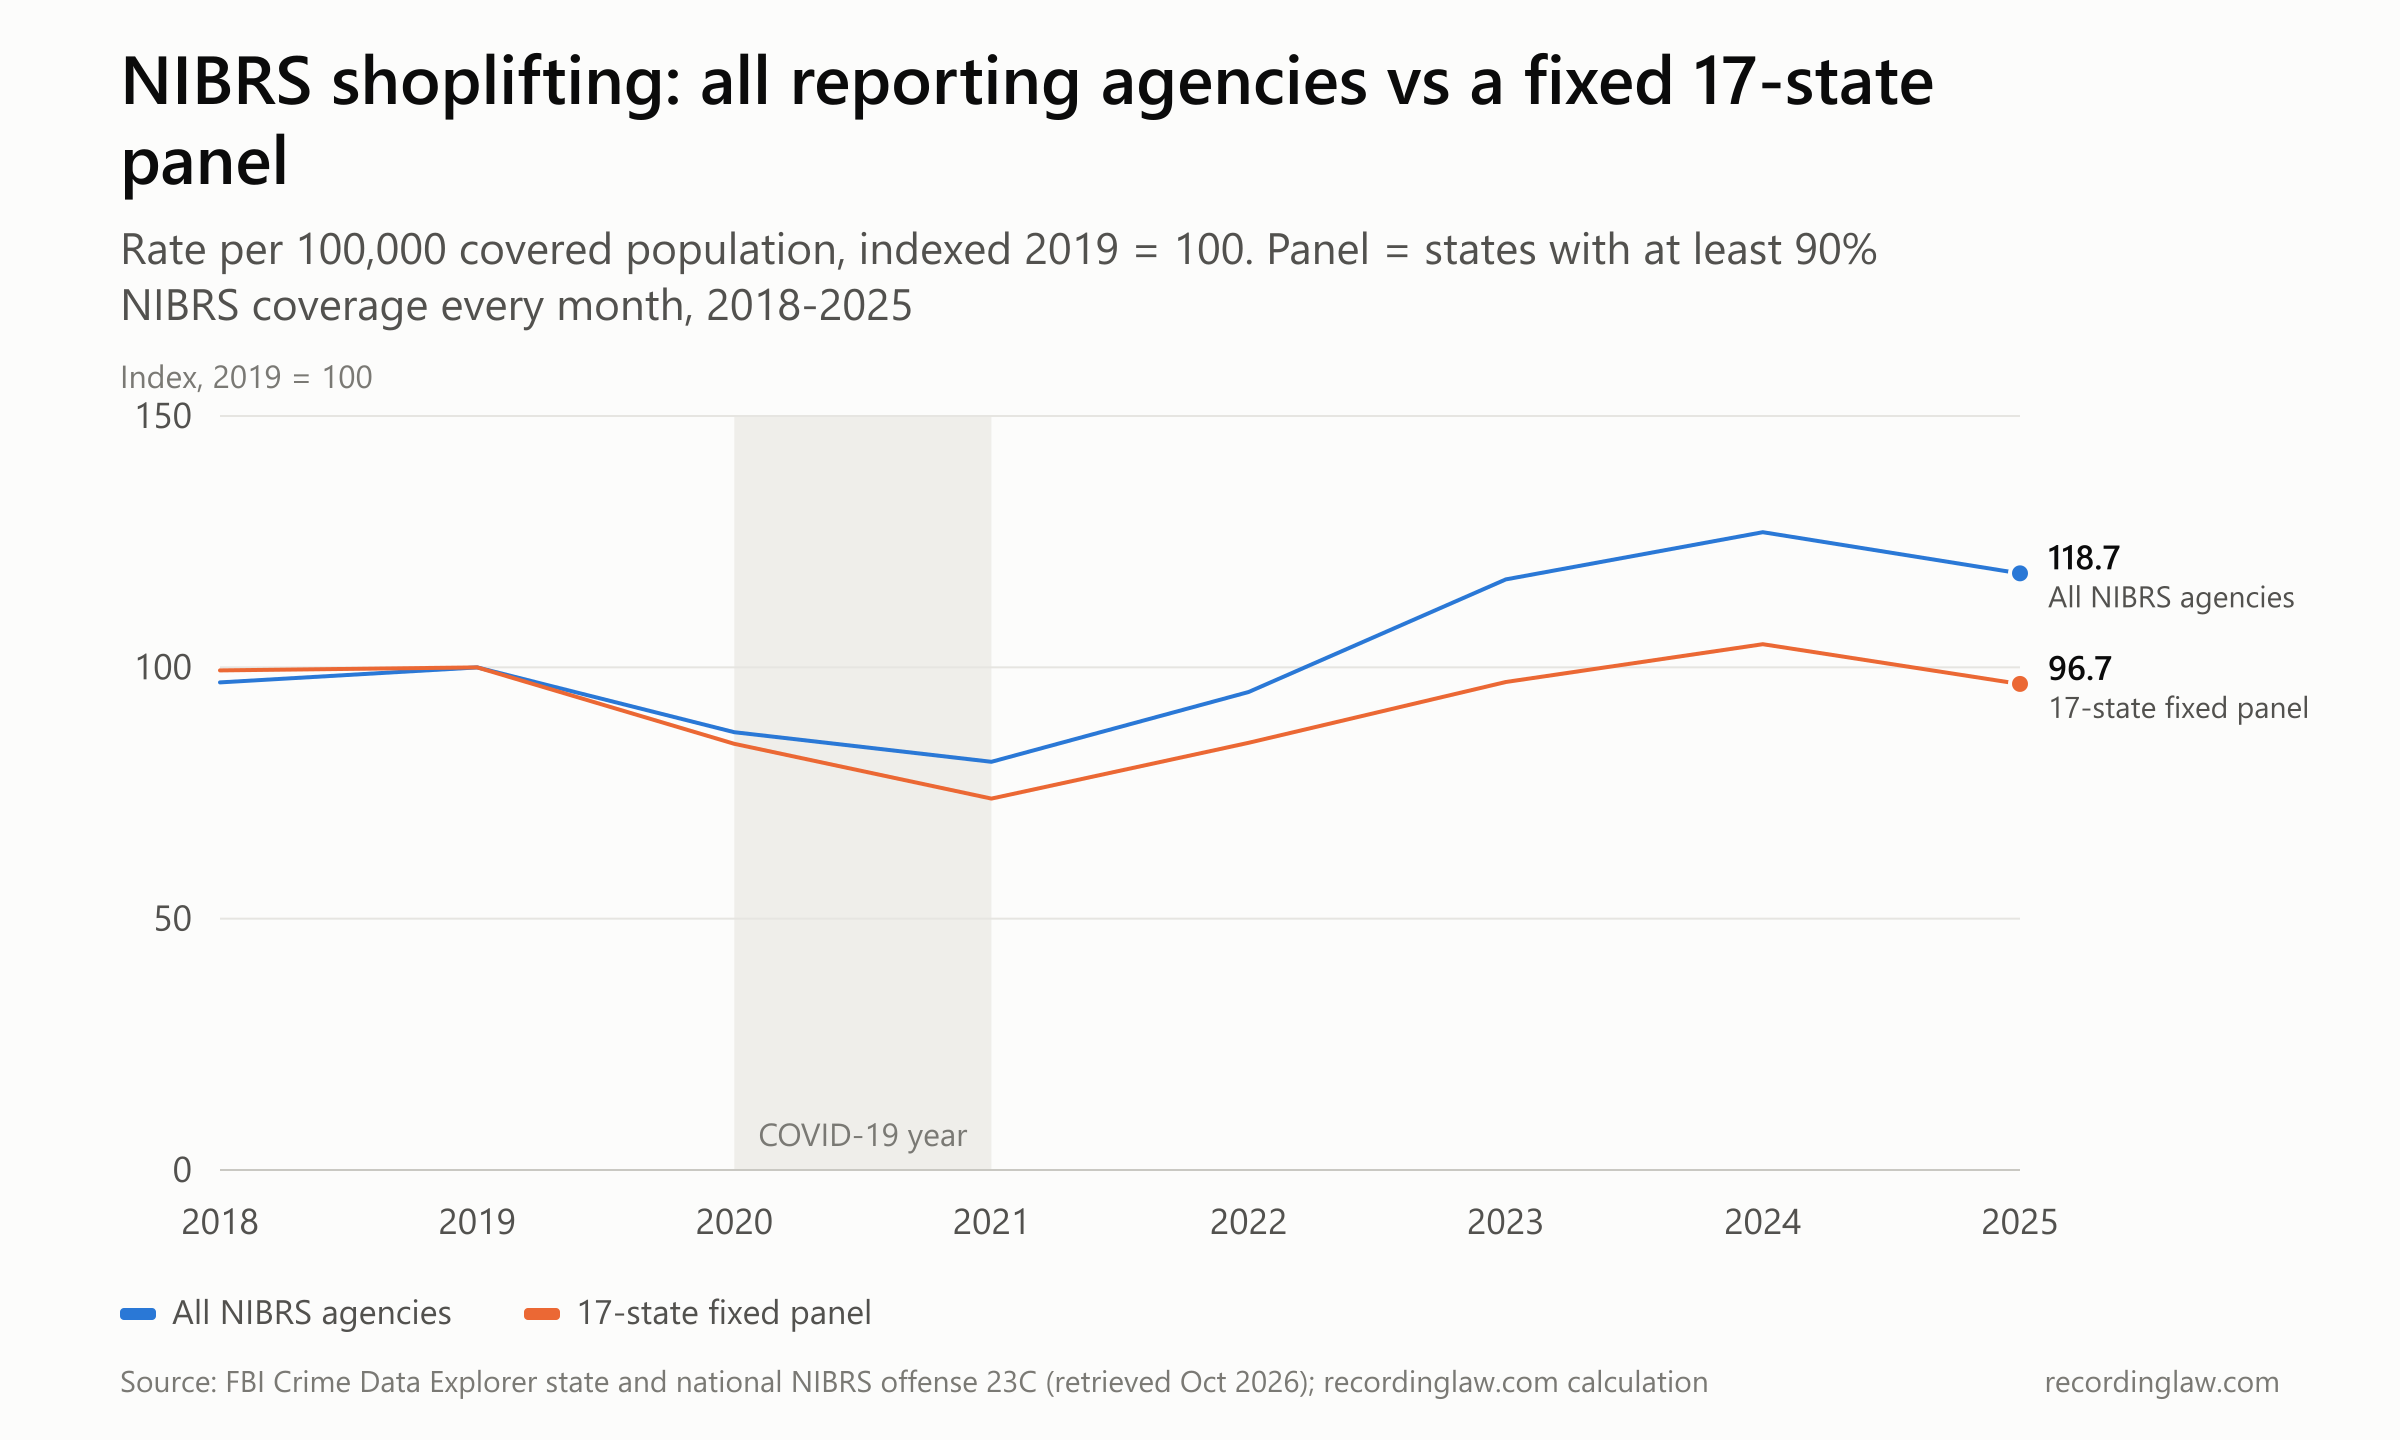
Source: FBI Crime Data Explorer, NIBRS offense 23C, national and state data, retrieved October 2026; panel calculated by RecordingLaw.
| Year | 17-state panel rate per 100,000 | Panel index (2019 = 100) | All NIBRS agencies index (2019 = 100) |
|---|---|---|---|
| 2018 | 388.1 | 99.4 | 97.0 |
| 2019 | 390.5 | 100.0 | 100.0 |
| 2020 | 331.3 | 84.8 | 87.1 |
| 2021 | 288.5 | 73.9 | 81.2 |
| 2022 | 331.8 | 85.0 | 95.1 |
| 2023 | 379.1 | 97.1 | 117.5 |
| 2024 | 408.5 | 104.6 | 126.9 |
| 2025 | 377.8 | 96.7 | 118.7 |
In the panel, the rate fell to 288.5 in 2021, returned to 379.1 in 2023 (2.9% under 2019), reached 408.5 in 2024 (4.6% over 2019) and was 377.8 in 2025 (3.3% under 2019). Its path from 2019 to 2023 is similar to the SRS estimate's. Over the same years, the all-agency NIBRS index rose to 117.5 in 2023 and 126.9 in 2024, then stood at 118.7 in 2025.
The panel has limits. It holds states constant, not individual agencies, so agencies inside a panel state can still join or drop out within the 90% to 100% band. The 17 states are not a random sample of the country, and their trend may differ from states with large cities that joined NIBRS later.
Three cities, three paths
City police departments publish their own incident data. The chart below indexes each city's yearly count of reported shoplifting to 2019. These are counts, not rates, because city population figures were not part of this analysis.
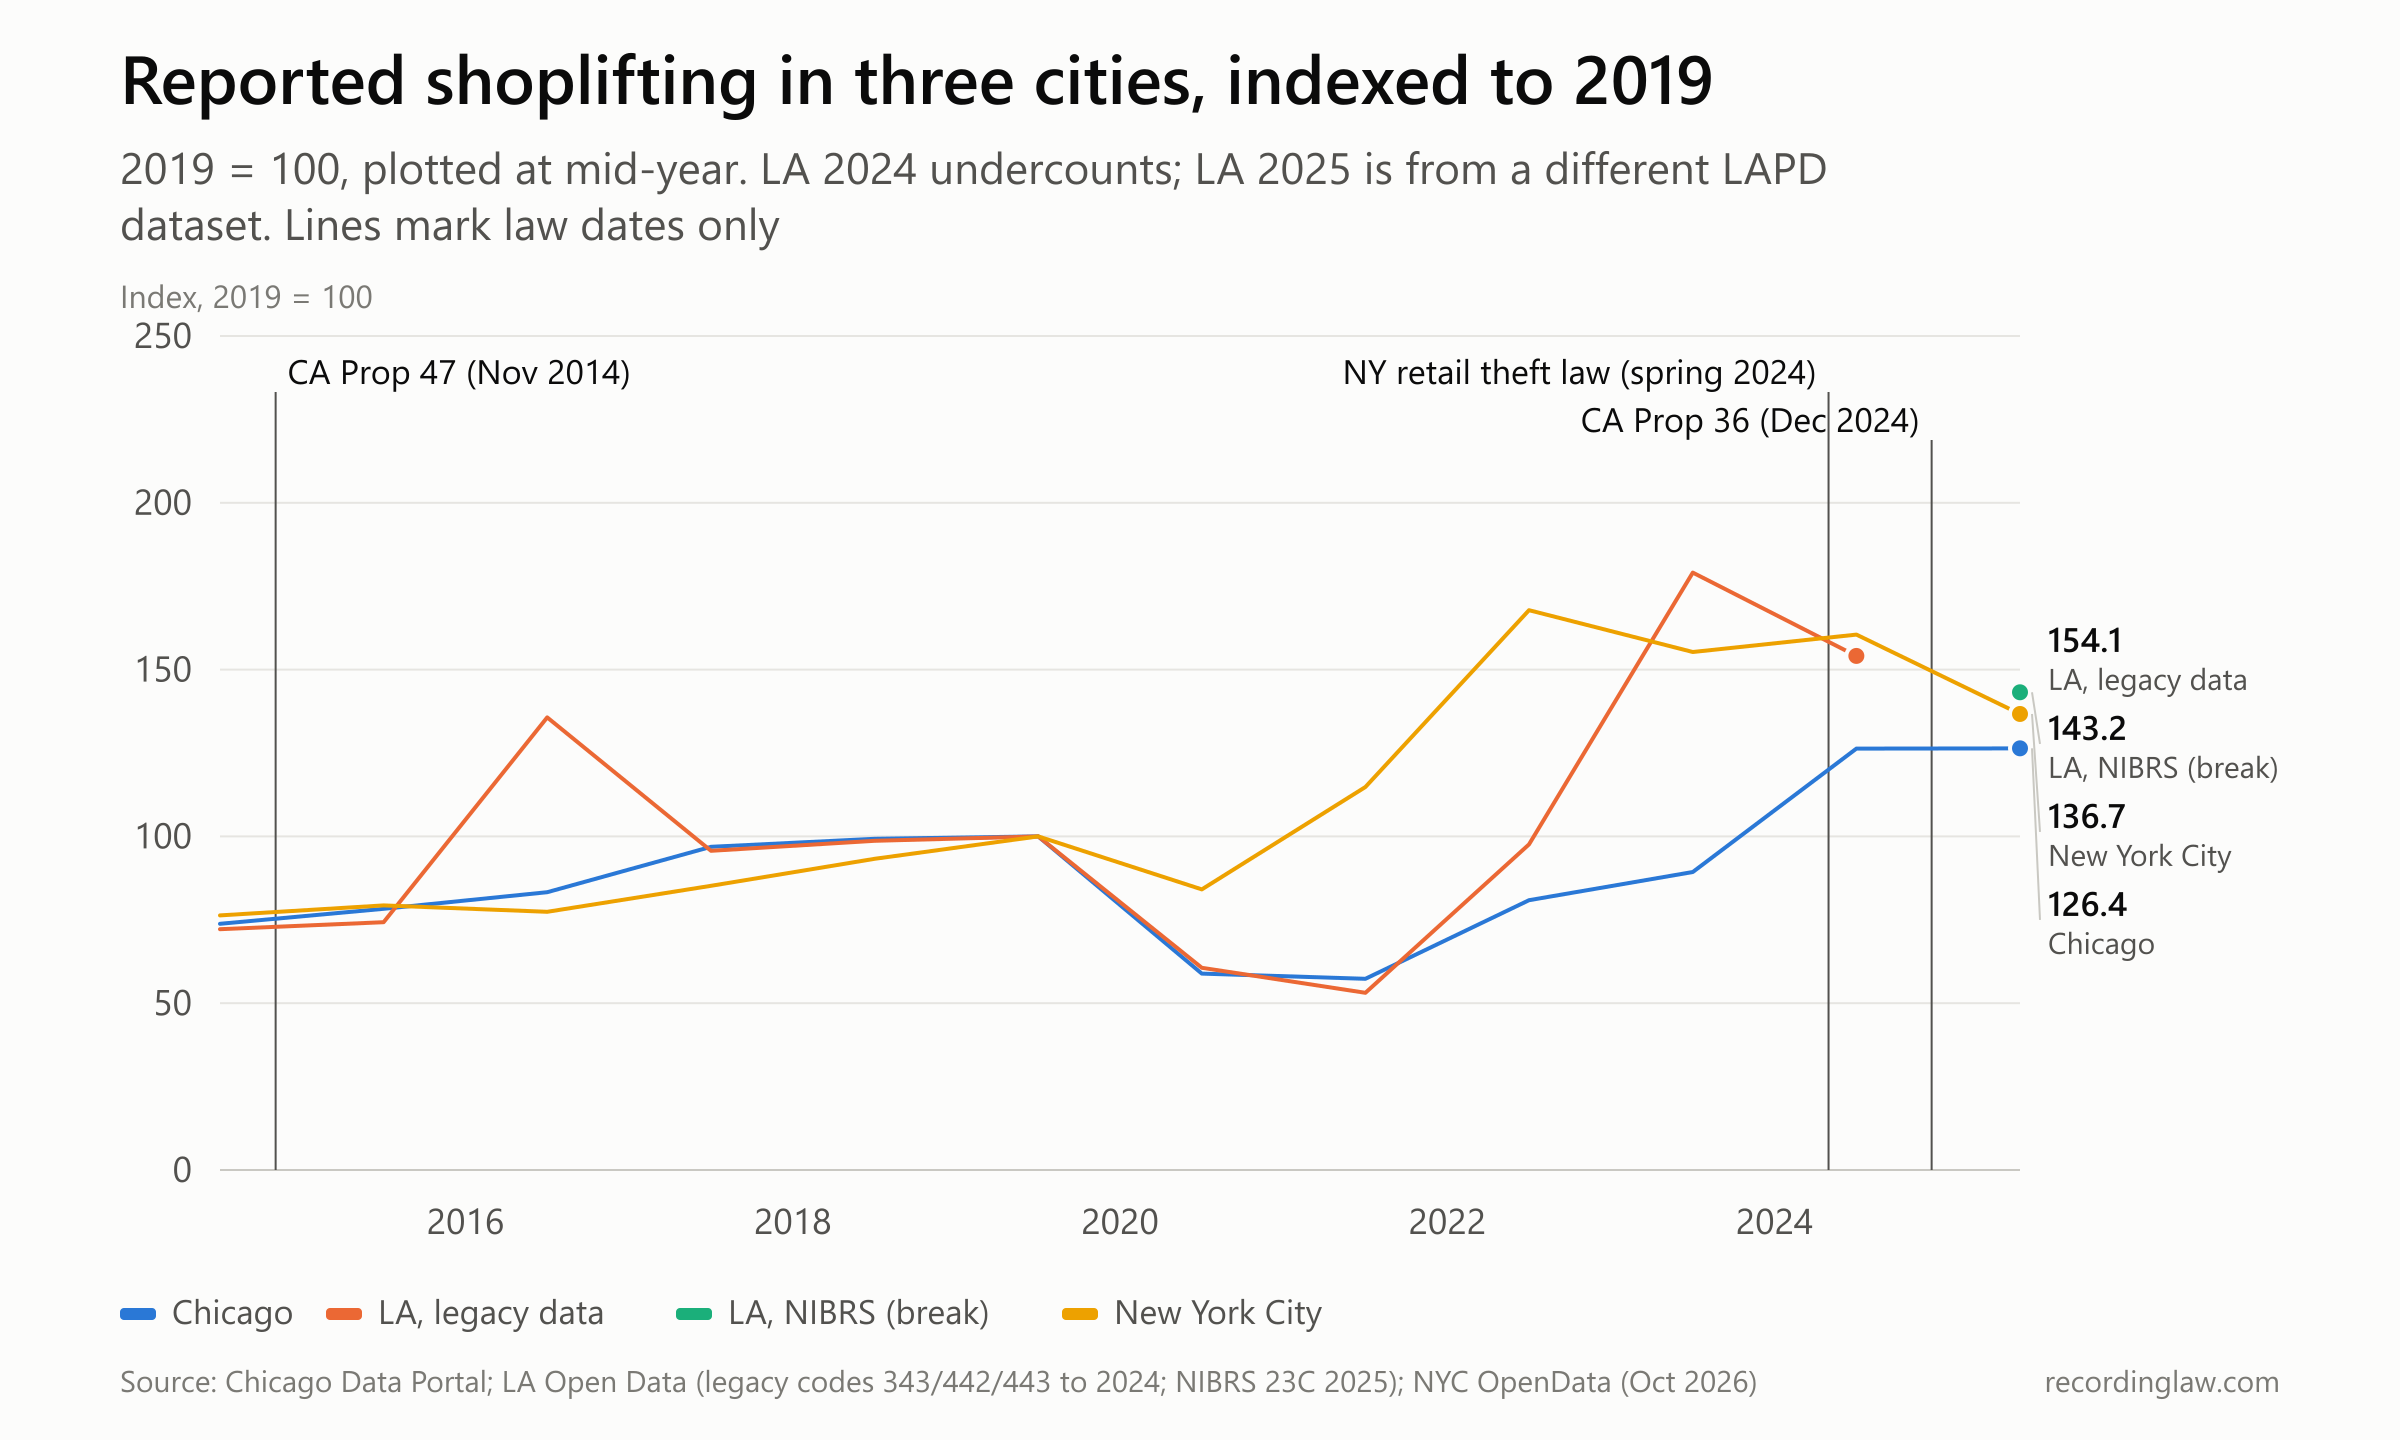
Source: Chicago Data Portal (Chicago Police Department, retail theft); Los Angeles Open Data (LAPD crime codes 343, 442 and 443 through 2024; LAPD NIBRS Offenses Dataset, offense 23C, for 2025); NYC OpenData (NYPD complaints, larceny from store, shoplifting). Retrieved October 2026. Each year is plotted at mid-year. The vertical lines mark law dates only; this analysis does not test their effects.
| City | 2019 | 2021 | 2023 | 2024 | 2025 | Change 2019 to 2023 |
|---|---|---|---|---|---|---|
| Chicago | 10,792 | 6,182 | 9,639 | 13,627 | 13,645 | -10.7% |
| Los Angeles | 6,762 | 3,588 | 12,108 | 10,418 (undercount) | 9,683 (NIBRS dataset, series break) | +79.1% |
| New York City | 36,736 | 42,177 | 57,057 | 58,944 | 50,236 | +55.3% |
Chicago's 2023 count was below 2019, and its 2024 and 2025 counts were about 26% above it. New York City's count was above 2019 from 2021 onward, peaking at 61,629 in 2022, and stood 36.7% above 2019 in 2025. Los Angeles fell to 3,588 in 2021 and rose to 12,108 in 2023.
CCJ reported city rates per 100,000 residents for the same comparison: Chicago 10% lower in 2023 than in 2019, Los Angeles 87% higher and New York City 55% higher. CCJ's figures are rates per resident and ours are counts, and CCJ does not list the LAPD crime codes it used, so the two Los Angeles changes (87% and 79.1%) are not directly comparable.
The city series carry their own breaks:
- Definitions. Chicago counts reports described as retail theft. Los Angeles counts LAPD codes 343, 442 and 443 (shoplifting grand theft over $950, shoplifting petty theft of $950 and under, and attempted shoplifting) through 2024, and NIBRS offense 23C for 2025. New York counts petit and grand larceny complaints from stores classed as shoplifting. None of these matches the FBI's shoplifting offense (23C) exactly.
- Los Angeles 2016. The LA count jumped to 9,174 in 2016, 35.7% above 2019, and fell back to 6,473 in 2017. We did not find an explanation for that one-year spike in the data.
- Los Angeles 2024. CCJ reports that the LAPD adopted a new records management system on March 7, 2024, and that the number of offenses in the city's incident-level dataset dropped substantially after the transition. Treat the 2024 figure as an undercount. LAPD's NIBRS dataset separately holds 2,103 shoplifting offenses dated 2024; we did not add the two because we could not check for records that appear in both.
- Los Angeles 2025 (series break). The legacy dataset, "Crime Data from 2020 to 2024," ends on December 30, 2024. The 2010-2019 and 2020-2024 legacy datasets are joined at the start of 2020. For 2025, LAPD publishes the "LAPD NIBRS Offenses Dataset," which holds records entered in its new records system since March 7, 2024, and, as retrieved in October 2026, showed 9,683 shoplifting offenses (NIBRS 23C) in 2025. LAPD notes that NIBRS reports each offense in an incident separately, which may raise counts. The 2025 figure is therefore not comparable with earlier years and appears in the chart as a separate point (143.2 on the 2019 scale), not a continuation of the line.
The laws in the background
Shoplifting thresholds and penalties changed during and before these years. They are listed here as context. This article does not test whether any of these laws changed shoplifting levels.
California. Proposition 47, approved November 4, 2014, added Penal Code 459.5, which defines shoplifting of property worth up to $950 and generally treats it as a misdemeanor. Penal Code 490.4 defines organized retail theft, which includes acting in concert with others to steal merchandise to sell, exchange or return, knowingly receiving or possessing such merchandise in concert with others, and acting as an agent of others in an organized plan. When those acts occur on two or more occasions within 12 months with an aggregated value over $950, they can be punished as a felony. Organizing or directing others to commit them can be punished as a felony regardless of value.
Proposition 36, approved November 5, 2024 and effective December 18, 2024, added Penal Code 666.1, which allows felony punishment for petty theft or shoplifting by a person with two or more prior theft-related convictions. More detail is on the California theft laws page.
Illinois. Under 720 ILCS 5/16-25, retail theft of property worth up to $300 is a Class A misdemeanor, and retail theft above $300 is a Class 3 felony. Retail theft of $300 or less is a Class 4 felony for a person previously convicted of any type of theft or certain other offenses, such as robbery, burglary or forgery. The section's current text dates from Public Act 97-597, effective January 1, 2012. See Illinois theft laws.
New York. Under Penal Law 155.30, theft of property worth more than $1,000 can be grand larceny in the fourth degree, a class E felony. The state's FY2025 budget, announced by the governor's office on May 1, 2024, made assault on a retail worker a felony and allowed retail thefts to be aggregated. See New York theft laws.
Felony lines for every state are on the theft laws by state page.
Separating any effect of these laws from the data would first require removing the coverage changes, definition differences and records-system breaks described above. The 2020 pandemic year also affected every series. Los Angeles figures for 2025, the first full year after Proposition 36 took effect, come from a different LAPD records system than the 2019 baseline.
How we measured
SRS. SRS shoplifting estimates for 2019 to 2023 come from the data behind Figure 3 of CCJ's November 2024 report "Between the Aisles: A Closer Look at Shoplifting Trends." CCJ explains that the FBI generated these numbers from the share of larceny incidents that were shoplifting, as reported by agencies that sent supplemental larceny-type data, so they are estimates rather than direct counts. We could not retrieve an SRS shoplifting series from the FBI's CDE, so no SRS figures are shown for 2018 or for 2024 onward.
NIBRS as CCJ published it. These rates come from the data behind CCJ's Figure 4 (2019 to 2023). Where CCJ's text and its chart data differ, we use the chart data.
NIBRS on the CDE. National figures are for NIBRS offense 23C (shoplifting), retrieved October 26, 2026, from a CDE data refresh dated October 15, 2026. Each year's rate is the sum of the 12 monthly rates, per 100,000 people in reporting agencies' areas. Coverage is participating population divided by total population, averaged over 12 months.
The FBI's annual national release for 2025 came out in August 2026, so 2025 is the latest full year; 2026 months were left out as incomplete. Later FBI revisions could change these figures again.
Fixed panel. State-level CDE data for offense 23C, January 2018 to December 2025, for the 17 states listed above. Selection was based only on monthly population coverage, not on shoplifting levels.
Cities. Chicago: City of Chicago crimes dataset, description "RETAIL THEFT," by year of incident. Los Angeles: LAPD legacy crime data, codes 343, 442 and 443, from the 2010-2019 and 2020-2024 datasets; for 2025, the LAPD NIBRS Offenses Dataset, offense 23C, by year of occurrence, shown separately as a series break. New York City: NYPD historic complaint data, the two store-shoplifting descriptions, by year of complaint start date. All indexed to 2019.
What the data cannot show. All of these figures count shoplifting that was reported to police and recorded, not all shoplifting. Changes in how stores report thefts or how departments record them move the numbers too. We did not collect retailer loss or store-closure figures, which measure different things.
None of the comparisons here is designed to show what caused a change. For how incidents become police records, see police reports by state.
Frequently Asked Questions
Is shoplifting up since 2019?
It depends on the dataset. SRS-based FBI estimates published by the Council on Criminal Justice were about the same in 2023 as in 2019. CCJ's published NIBRS rate was 93% higher, a figure CCJ notes the FBI later revised. The FBI Crime Data Explorer's current NIBRS rate was 17.5% higher in 2023 and 26.9% higher in 2024. A fixed group of 17 states with steady NIBRS coverage was 2.9% lower in 2023, 4.6% higher in 2024 and 3.3% lower in 2025.
Why do the FBI-based numbers disagree?
They measure different things over different sets of places. SRS figures are FBI estimates of incident counts, derived from larceny shares. NIBRS figures are rates for the areas whose agencies report to NIBRS, and that coverage rose from 51.9% of the US population in 2019 to 84.9% in 2023. CCJ also notes that the FBI revised its NIBRS rates after CCJ published them.
Where did the 93% figure come from, and is it still current?
CCJ reported in November 2024 that the NIBRS shoplifting rate went from 159.3 to 308.8 per 100,000 between 2019 and 2023, 93% higher. CCJ notes the FBI later revised those rates. The Crime Data Explorer, retrieved in October 2026, shows 295.7 and 347.5 for the same years, 17.5% higher.
Did Proposition 47 or Proposition 36 change shoplifting in California?
This analysis does not answer that. The Los Angeles police data used here has a 2016 spike, a records-system change in March 2024 after which its legacy counts dropped substantially, and 2025 figures that come only from the new NIBRS-based dataset, which is not comparable with earlier years. Every series is also affected by 2020 pandemic disruptions.
What are the felony thresholds for shoplifting in California, Illinois and New York?
In California, shoplifting of property worth up to $950 is generally a misdemeanor under Penal Code 459.5, and Penal Code 666.1, added by Proposition 36, allows felony punishment with two or more prior theft-related convictions. In Illinois, retail theft above $300 is a Class 3 felony under 720 ILCS 5/16-25, and retail theft of $300 or less is a Class 4 felony for a person with a prior theft-type conviction. In New York, theft of property worth more than $1,000 can be grand larceny in the fourth degree, a class E felony, under Penal Law 155.30.
Why are the city figures counts rather than rates?
City population figures were not part of this analysis, so each city's yearly count is indexed to 2019 instead. CCJ's own city rates show a similar pattern: Chicago 10% lower in 2023 than 2019, Los Angeles 87% higher and New York City 55% higher.
Updates
Independently fact-checked against the cited primary sources
Sources and References
- Council on Criminal Justice, Between the Aisles: A Closer Look at Shoplifting Trends (November 2024)(counciloncj.org)
- FBI Crime Data Explorer, NIBRS offense 23C (shoplifting), national and state data, 2016-2025 (data refresh October 15, 2026)(cde.ucr.cjis.gov).gov
- FBI, UCR Summary of Reported Crimes in the Nation, 2025 (released August 2026)(cde.ucr.cjis.gov).gov
- City of Chicago Data Portal, Crimes - 2001 to Present (retail theft)(data.cityofchicago.org).gov
- Los Angeles Open Data, LAPD Crime Data from 2010 to 2019(data.lacity.org).gov
- Los Angeles Open Data, LAPD Crime Data from 2020 to 2024(data.lacity.org).gov
- Los Angeles Open Data, LAPD NIBRS Offenses Dataset (records since March 7, 2024)(data.lacity.org).gov
- NYC OpenData, NYPD Complaint Data Historic(data.cityofnewyork.us).gov
- California Penal Code 459.5 (shoplifting, added by Proposition 47)(leginfo.legislature.ca.gov).gov
- California Penal Code 490.4 (organized retail theft)(leginfo.legislature.ca.gov).gov
- California Penal Code 666.1 (added by Proposition 36)(leginfo.legislature.ca.gov).gov
- 720 ILCS 5/16-25 (Illinois retail theft)(ilga.gov).gov
- New York Penal Law 155.30 (grand larceny in the fourth degree)(nysenate.gov).gov
- Office of the Governor of New York, retail worker and retail theft protections in the FY2025 budget (May 1, 2024)(governor.ny.gov).gov