Powerball Jackpots Are Won About Half as Often as Before 2015, and Eight Have Topped $1 Billion

Independently fact-checked against primary sources (last audited November 10, 2026). · 8 primary sources cited on this page. How we verify our legal content
On Christmas Eve 2025, a Powerball ticket sold at Murphy USA 7879, at 208 S. Rockwood in Cabot, Arkansas, won a jackpot of $1.817 billion. It was the 47th drawing since the jackpot had last been won, a game record for the most drawings in one jackpot run. The store received a $50,000 retailer commission.
In the Powerball draw records from February 2010 to the start of October 2015, no jackpot had reached $600 million by the drawing where someone won it. From January 2016 to August 2026, eight winning jackpots passed $1 billion.
Bigger jackpots were the goal. In October 2015, the state lotteries that jointly run Powerball changed the game so the jackpot became harder to win. The Louisiana Lottery's announcement said the new set of numbers was "designed to create larger average jackpots and more winning experiences."
Since then, Powerball has produced jackpot winners about half as often, roughly seven times a year instead of 14. What did the states get when they made their best-known jackpot harder to win, and who buys the tickets that pay for it? The public numbers answer most of that. They leave a gap where Powerball's own sales should be.
From fiscal 2008 to fiscal 2024, years that span the change, state lottery ticket sales nationwide nearly doubled, reaching $104.7 billion, according to the U.S. Census Bureau. Prizes grew faster than sales, though, so the share of each dollar the states had left after paying winners fell, from 39 cents to 33 cents.
Most of that money does not come from the jackpot games. More than two-thirds of lottery spending went to instant scratch-off tickets rather than to drawing games such as Powerball, according to industry almanac figures that the University of Maryland's Howard Center for Investigative Journalism published in 2022. The stores that sell lottery tickets sit disproportionately in poorer neighborhoods, the Howard Center's investigation found.
Where the billion-dollar jackpots fall
If the 2015 change mattered for jackpot size, the winning jackpots should look different on either side of October 2015. Do they, across every drawing where someone won from 2010 through October 2026? Each drawing without a jackpot winner rolls the jackpot over to the next one, so it keeps growing until someone wins. A run is the string of drawings from one jackpot win to the next.
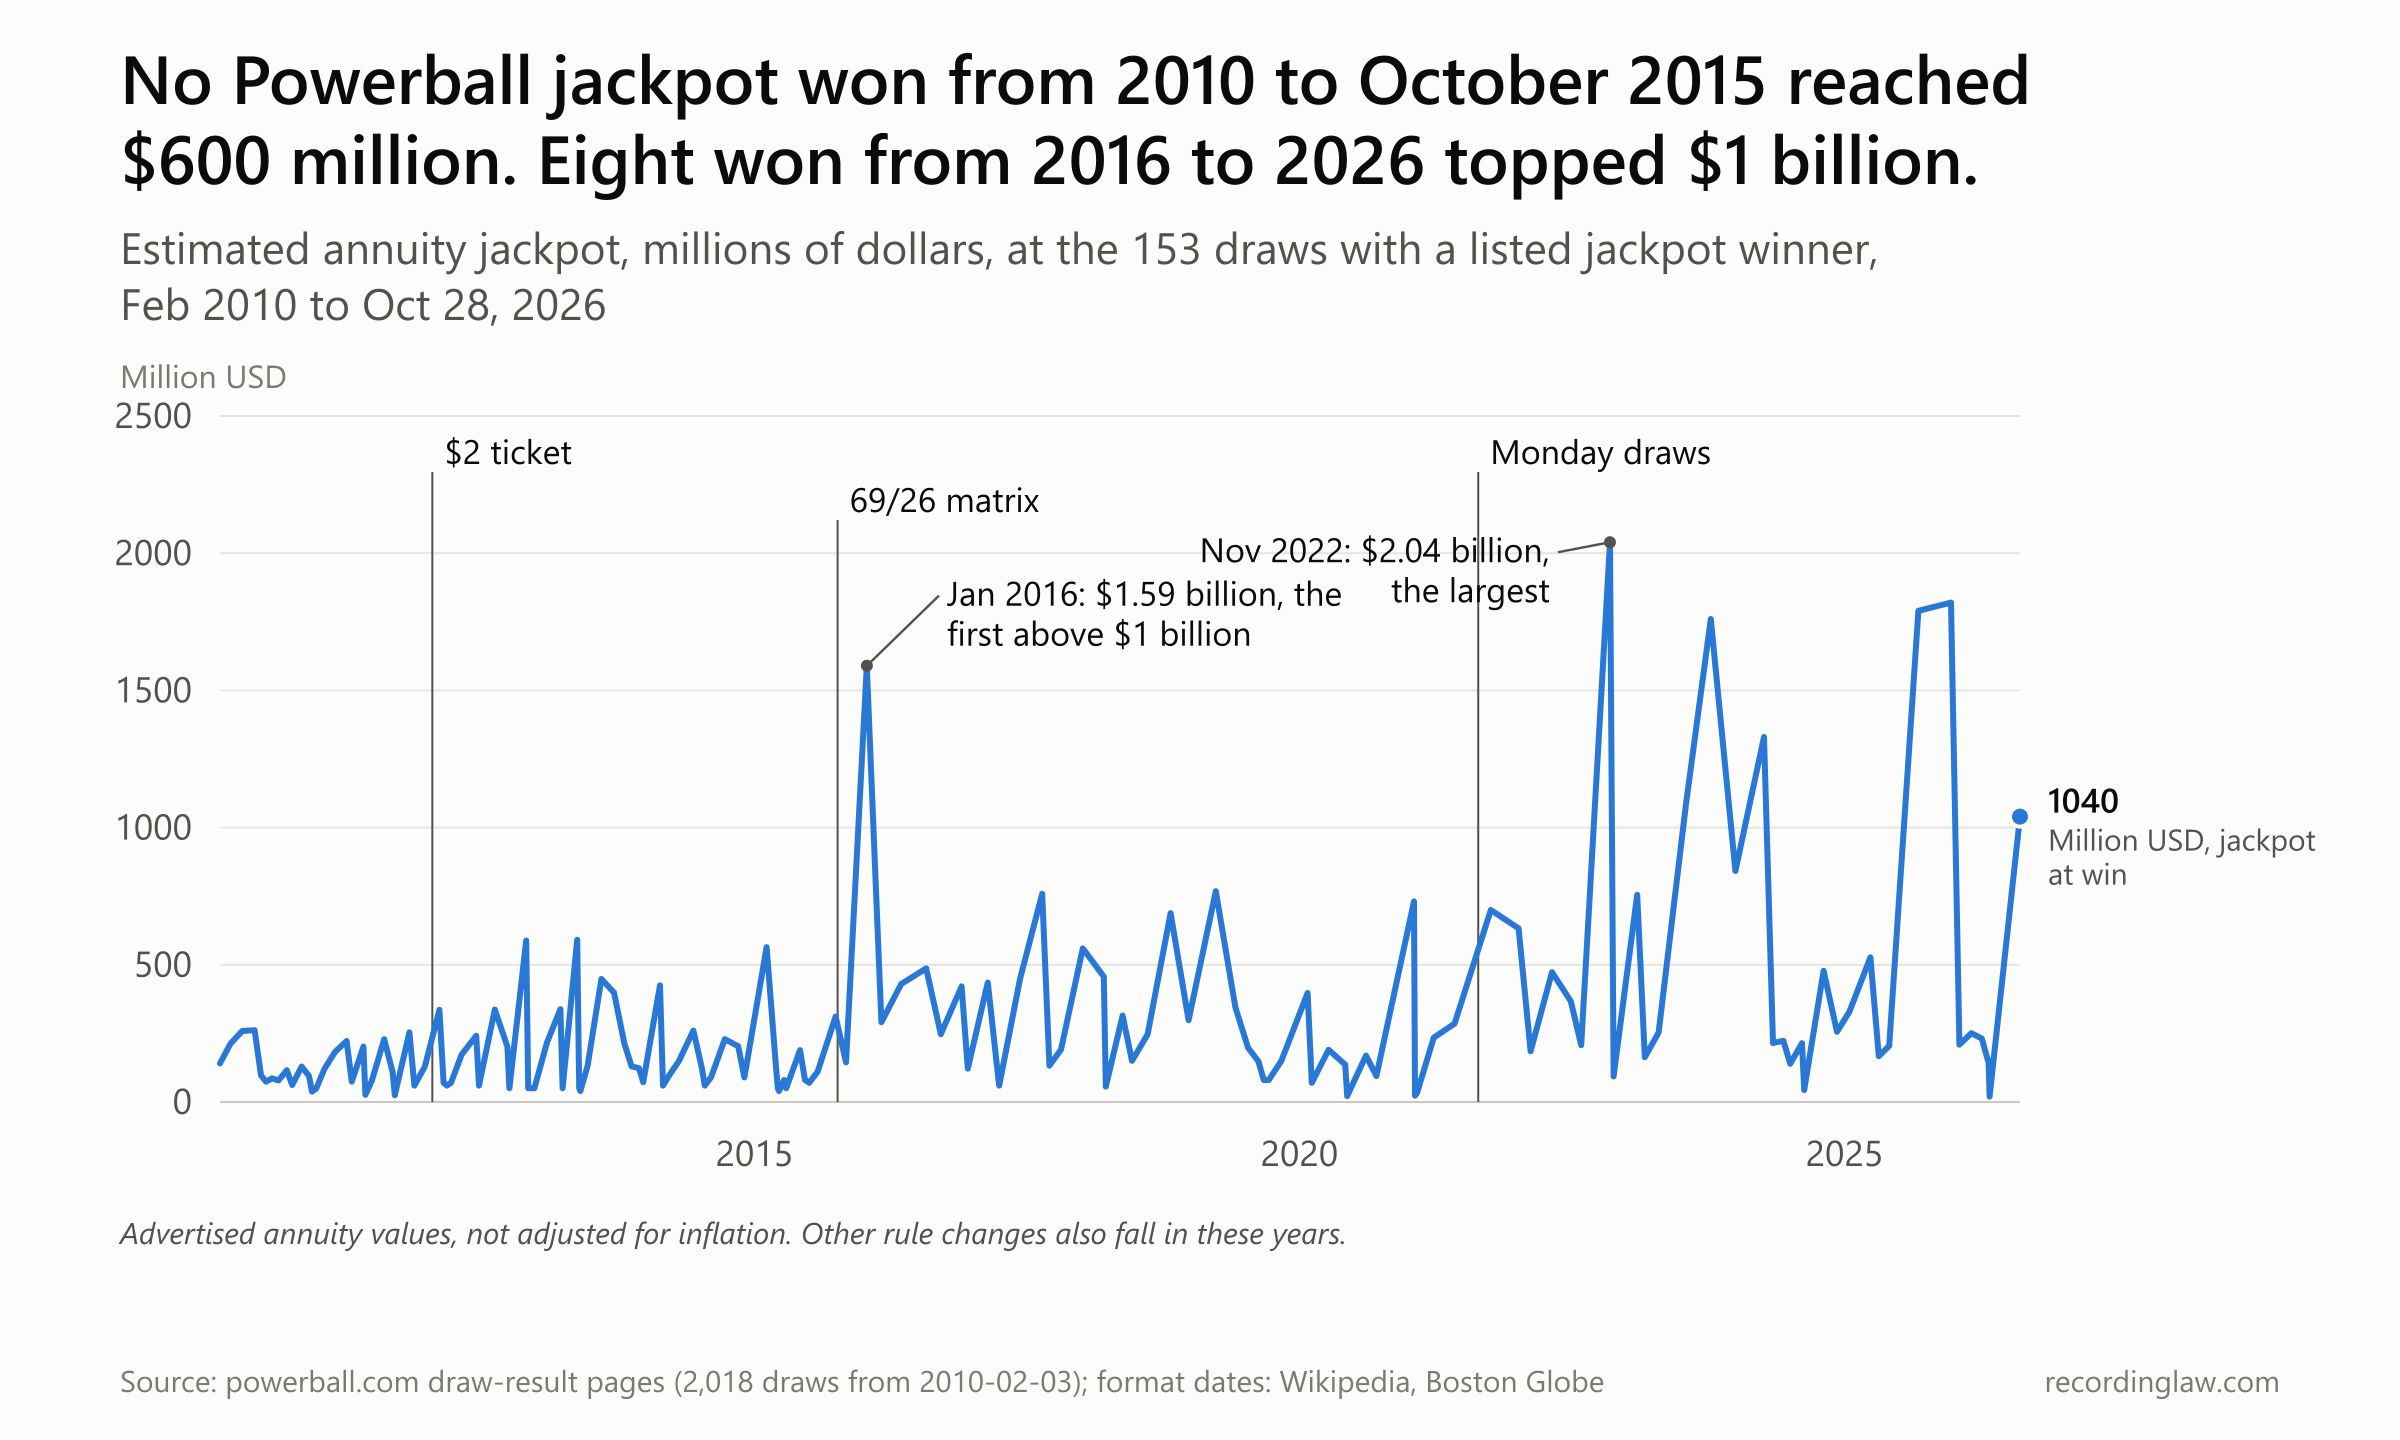
Estimated annuity jackpot at each of 153 Powerball draws with a listed jackpot winner, February 2010 to October 28, 2026, with format-change dates. Source: powerball.com draw pages.
| Draw date | Estimated jackpot at win | Drawings in the run |
|---|---|---|
| Jan 13, 2016 | $1,590M | 20 |
| Nov 7, 2022 | $2,040M | 41 |
| Jul 19, 2023 | $1,080M | 39 |
| Oct 11, 2023 | $1,760M | 36 |
| Apr 6, 2024 | $1,330M | 41 |
| Sep 6, 2025 | $1,790M | 42 |
| Dec 24, 2025 | $1,820M | 47 |
| Aug 12, 2026 | $1,040M | 44 |
Every winning jackpot above $600 million sits to the right of the October 2015 line. The largest, $2.04 billion, was won by a single ticket in California on November 7, 2022.
In September 2025, in the run just before Cabot's, two tickets sold in Missouri and Texas split $1.787 billion. Powerball's operators later called that run and Cabot's the game's largest back-to-back jackpot runs.
The new odds were not the only rule the operators changed before and after October 2015. The first of the other changes came in 2012.
Why would a lottery make its jackpot harder to win?
The 2015 change was the second time in four years that Powerball's operators reworked the game to reach big jackpots faster. Powerball is run by the Multi-State Lottery Association (MUSL), a non-profit group of state lotteries based in Iowa, and its members vote on the rules.
The first rework came on January 15, 2012, when a Powerball ticket went from $1 to $2. The starting jackpot doubled to $40 million, and the jackpot odds improved slightly, from 1 in 192 million to 1 in 175 million. "We're repackaging and freshening up the product and enriching the product," Terry Rich, MUSL's spokesman, told the Associated Press.
Rich said sales might dip at first but would likely climb as jackpots grew. "We wouldn't be doing it if we didn't think more money would be coming back to the states and help them with revenues during these tough economic times," he said.
Clyde Barrow, a gambling expert at the University of Massachusetts-Dartmouth, explained the idea in the same story. "The idea is that at $12 million people don't get too excited but when it crosses $140 million, more people will play and by increasing the price level of tickets you will reach that prize level much faster," he said.
For a while the jackpots did come faster. By September 2013, the Philadelphia Inquirer reported, Powerball's three biggest jackpots ever had all come since the start of 2012. In the paper's account, a $317 million jackpot had also crossed the $300 million mark "in a record fewest 10 rollovers."
Then, by the trade press's account, the game stalled. "The lack of a huge jackpot led to a decline in Powerball sales of 19 percent in 2014," The Fiscal Times reported in July 2015. Global Gaming Business, a trade magazine, wrote that "Sluggish PowerBall sales spurred changes." We could not check either account, because we found no published MUSL sales series.
On July 7, 2015, Louisiana Lottery President Rose Hudson announced the fix and explained the problem as the lotteries saw it. "The last time Powerball's game matrix changed was in 2012," she said. "Since then, the game's playing population has grown to include 47 lottery jurisdictions, and jackpots are consequently hit faster. This change will help produce those eye-popping jackpots that players have come to expect with Powerball."
A player picks five white-ball numbers and one Powerball number. The new game added 10 numbers to the white balls, for a total of 69, and removed nine Powerball numbers, leaving 26.
The odds that a single ticket matched all six numbers and won the jackpot went from 1 in 175.2 million to 1 in 292.2 million. That cut each ticket's chance at the jackpot by about 40%. The odds of winning any prize improved, from 1 in 31.8 to 1 in 24.9, and the price stayed at $2.
Tickets on the new design went on sale October 4, 2015, and the first drawing was October 7. "These improvements will allow for even bigger jackpots and better odds of winning – both of which will create more New York Lottery millionaires," said Gardner Gurney, acting director of the New York lottery.
Leading with the jackpot was not new. In a 1999 report to a federal commission, Duke University researchers who reviewed state lottery marketing plans found "Size of the prize or the jackpot" as a theme in 56% of them. "Odds of winning" appeared as a theme in 16% of them.
The 2015 announcements paired bigger jackpots with better odds of winning something. Other coverage looked at what got harder.
What got harder
The jackpot's share of the prize money went down. "The new Powerball rules will increase the odds of winning any prize and decrease the odds of winning the big jackpot, effectively reducing the money for the top prize from 68 percent to 64 percent," The Fiscal Times reported. That figure is the paper's own.
The second prize got harder too. "It's now much harder to win the massive, life-changing jackpot," CNN Money wrote in January 2016. Matching all five white balls for $1 million had become a 1 in 11.7 million chance, "more than twice as tough as they used to be." Under the old design it was 1 in 5.2 million.
CNN Money also spelled out the logic. "Powerball hopes that having less frequent jackpot winners means there will be more rollover pots and thus larger top prizes," it wrote. By the time that ran, the first test was a week away.
Three months later, $1.6 billion
On January 13, 2016, three tickets, sold in California, Florida and Tennessee, split a $1.586 billion jackpot. It was the 20th drawing of the run and, MUSL later said, the first time any national draw game had reached $1 billion.
The same day, The Washington Post wrote: "If you think the Powerball jackpot soaring to $1.5 billion is just a pleasant surprise, think again: This was by design." It went on: "But a rule change in October made it much easier for the lottery jackpot to reach these world-record heights by making it a lot harder for players to win it."
"The strategy quickly paid massive dividends for state lotteries, leading to soaring ticket sales," the Associated Press wrote the next month. That is the AP's characterization. Like the 19 percent drop in 2014 Powerball sales that The Fiscal Times reported, it could not be checked, because we found no published MUSL sales series.
The same AP story disclosed a plan players never saw. MUSL had voted in September 2014 for a different overhaul, set to start in April 2015. Compared with the design later adopted, it would have given players "better odds to win the jackpot (1 in 286 million, instead of 292 million) and $1 million prizes (1 in 9.2 million, instead of 11.7 million)."
According to the AP, a February 2015 report "summarizing extensive polling and focus groups" touted it. That report, labeled "restricted confidential," was "inadvertently posted on the public portion of a website for association members and downloaded by The AP."
The association "later shelved the concept amid concerns that it was too complicated," the AP reported. Global Gaming Business added that directors were worried after the Monopoly Millionaires' Club game "was dropped by lotteries in 2014 due to poor sales and player confusion."
Gary Grief, the Texas Lottery executive director who chaired MUSL's Powerball group, said finding consensus among 37 member lotteries "takes significant time and effort." He said the January frenzy showed the group had made the right call. "The litmus test for any game change, regardless of the research that may be conducted in advance, lies in acceptance by the playing public," he said. "Our players speak with our dollars."
A single record could be luck. The draw records show how often anyone won over the next decade.
How often does anyone win now?
Before the change, the Powerball jackpot was won at about 14 drawings a year. Afterward it was about seven.
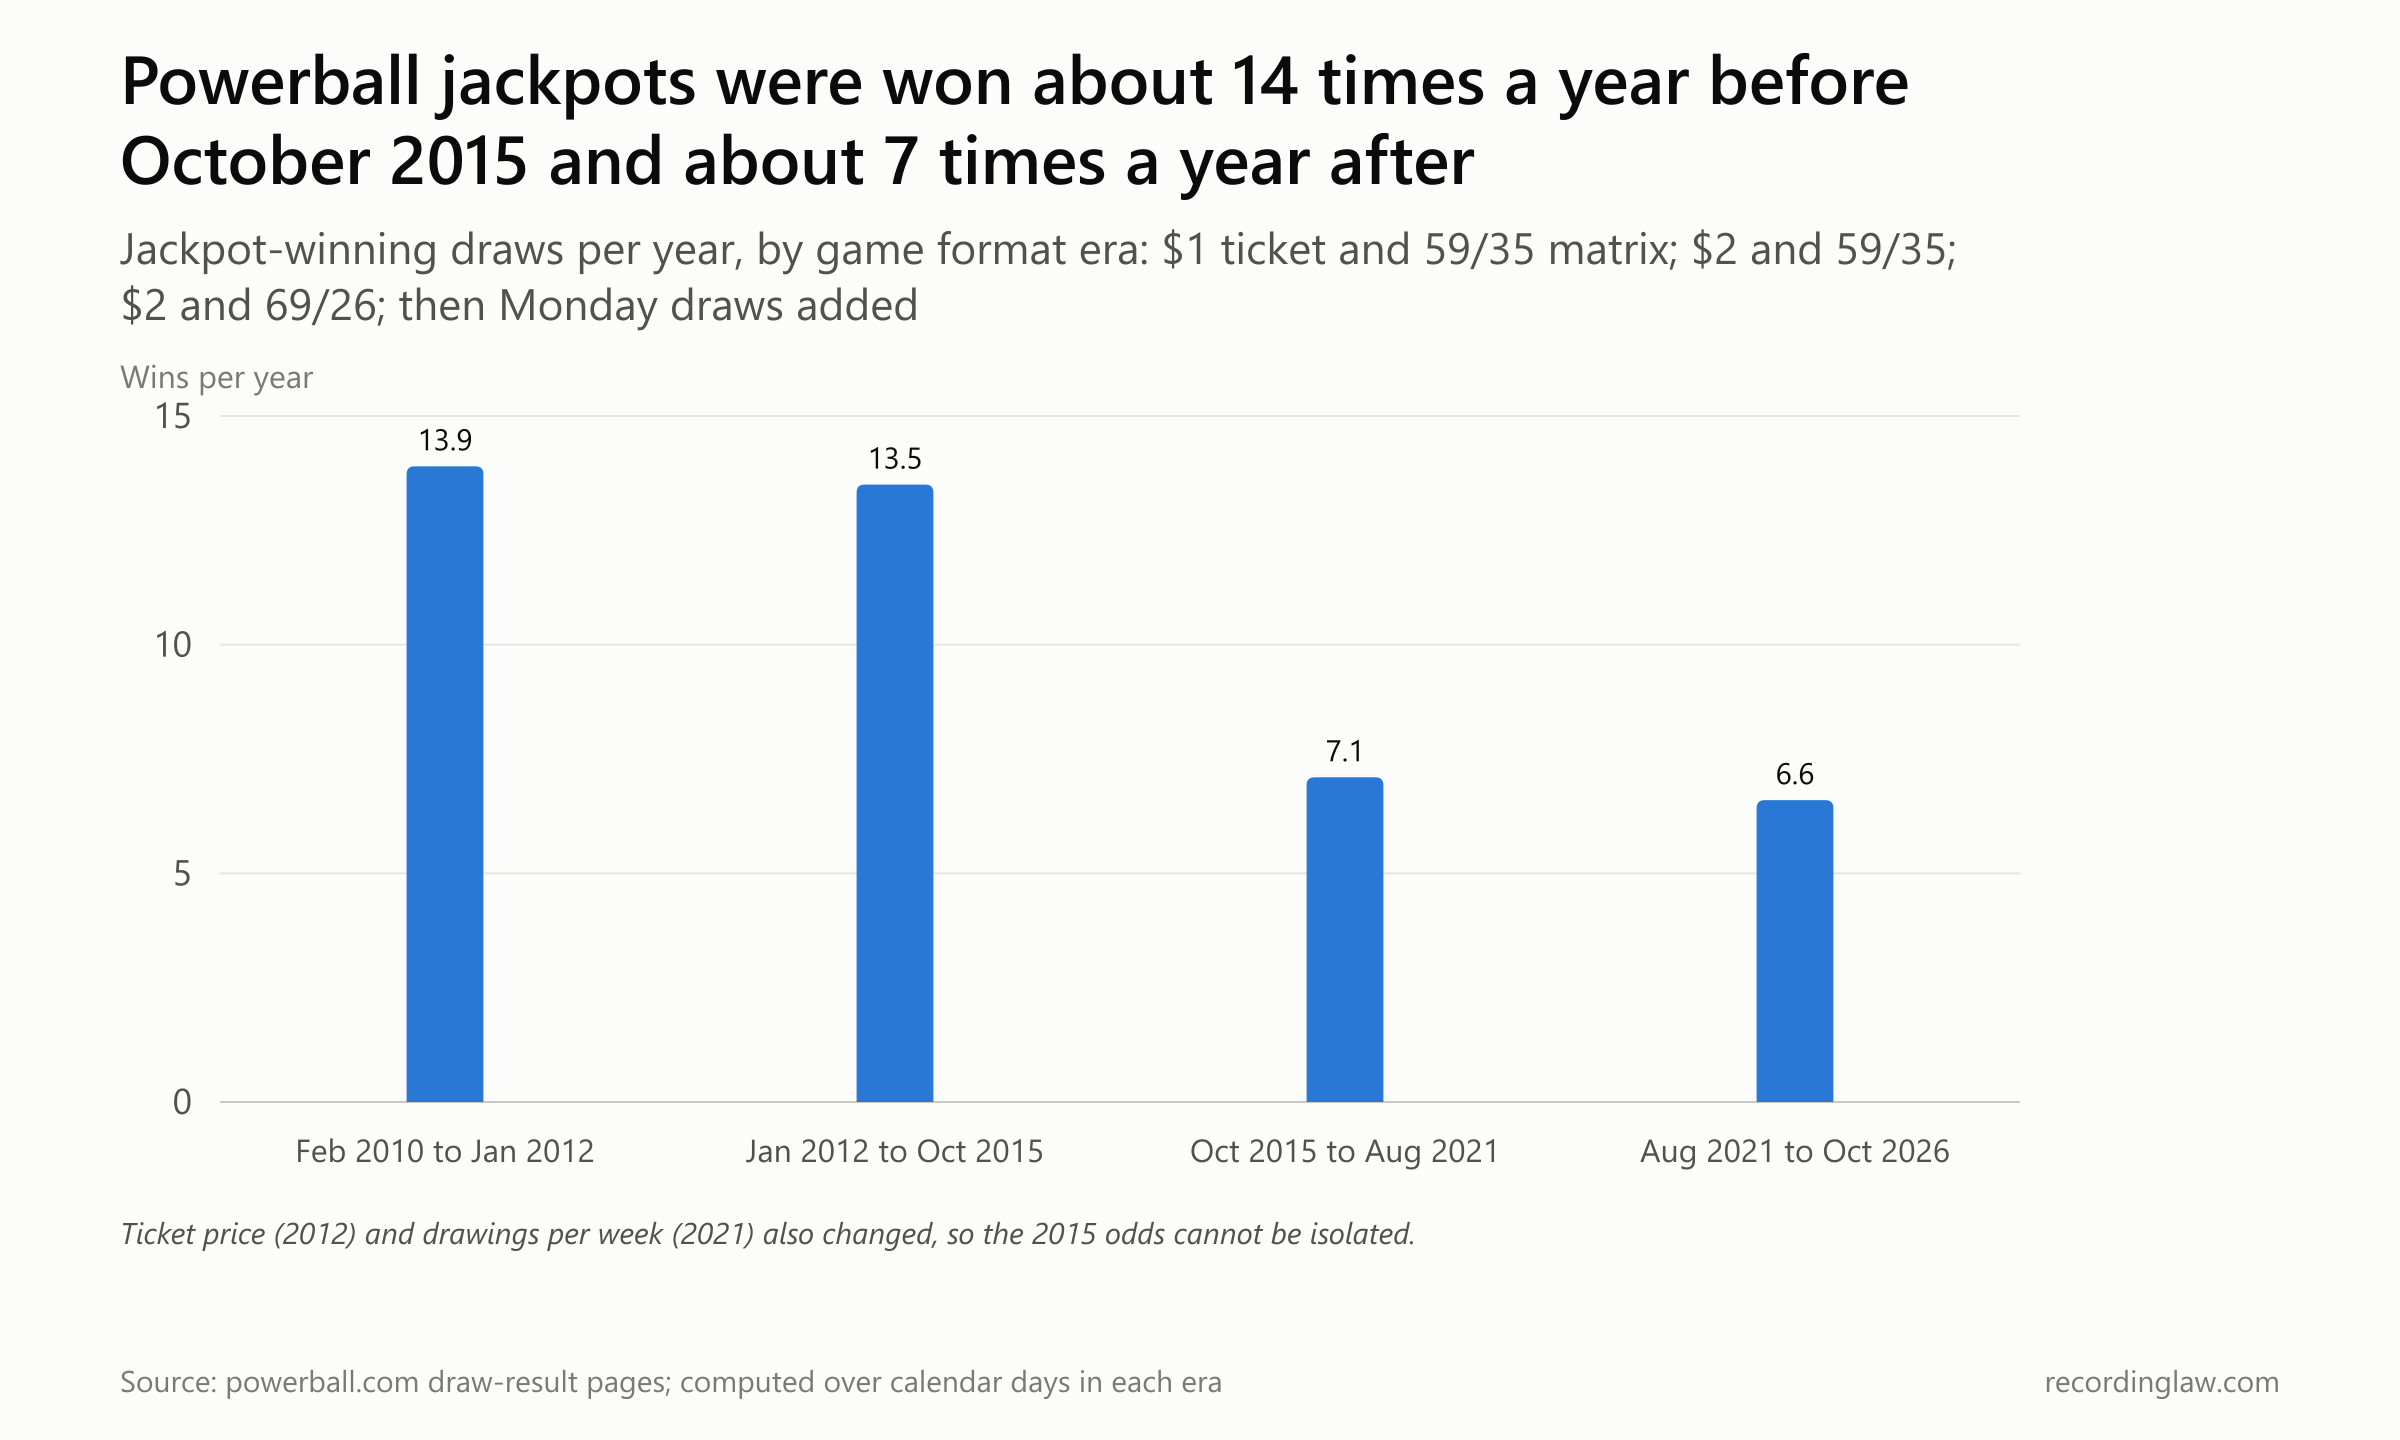
Powerball jackpot-winning draws per year by game-format era. Source: powerball.com draw-result pages, 2,018 draws from February 3, 2010 to October 28, 2026 (computed).
| Era (first to last draw) | Game format | Jackpot wins | Wins per year | Median draws per run | Median jackpot at win | Wins at $400M or more | Wins at $1B or more |
|---|---|---|---|---|---|---|---|
| Feb 3, 2010 to Jan 14, 2012 | $1, 5 of 59 + 1 of 35, Wed and Sat | 27 | 13.9 | 7 | $109.0M | 0 | 0 |
| Jan 18, 2012 to Oct 3, 2015 | $2, 5 of 59 + 1 of 35, Wed and Sat | 50 | 13.5 | 7 | $116.5M | 5 | 0 |
| Oct 7, 2015 to Aug 21, 2021 | $2, 5 of 69 + 1 of 26, Wed and Sat | 42 | 7.1 | 15.5 | $216.5M | 12 | 1 |
| Aug 23, 2021 to Oct 28, 2026 | $2, 5 of 69 + 1 of 26, Mon, Wed and Sat | 34 | 6.6 | 18.5 | $254.5M | 14 | 7 |
With fewer winners, runs got longer. A run is the string of drawings from one jackpot win to the next.
Under the same two-drawings-a-week schedule, the median run went from seven drawings before the change to 15.5 after it. Both figures are the median, the middle value when all are lined up in order. The median jackpot at the drawing where someone won rose from about $117 million to about $217 million.
Neither chart can say how much of that the 2015 odds did alone, because the operators kept changing the game. The 2012 price change had already sped up big jackpots. In April 2020, the operators, citing the coronavirus pandemic, halved the starting jackpot from $40 million to $20 million and cut the minimum rise between drawings from $10 million to $2 million. A third weekly drawing, on Mondays, began August 23, 2021, and UK players joined the jackpot pool in July 2026.
The jackpot figures themselves also drift. The advertised jackpot is an annuity value, which MUSL says rises with interest rates, and none of these figures is adjusted for inflation.
The cash value of January 2016's $1.59 billion jackpot was $983.5 million, about 62% of the advertised figure. The cash value of August 2026's $1.04 billion jackpot was $450.5 million, about 43%. That share was smaller for the August 2026 jackpot than for the January 2016 one.
The jackpots grew, as the lotteries said they wanted. Whether the states' money grew with them is harder to see.
Nearly twice the sales, a smaller share
The 45 state lotteries sold $104.7 billion in tickets in fiscal 2024, by the count of the Census Bureau, which adds all lottery games together. That is about $287 million a day, and it was nearly double the $52.8 billion of fiscal 2008.
The figures are not adjusted for inflation. A fiscal year here is each state's budget year, and state fiscal years end on different dates.
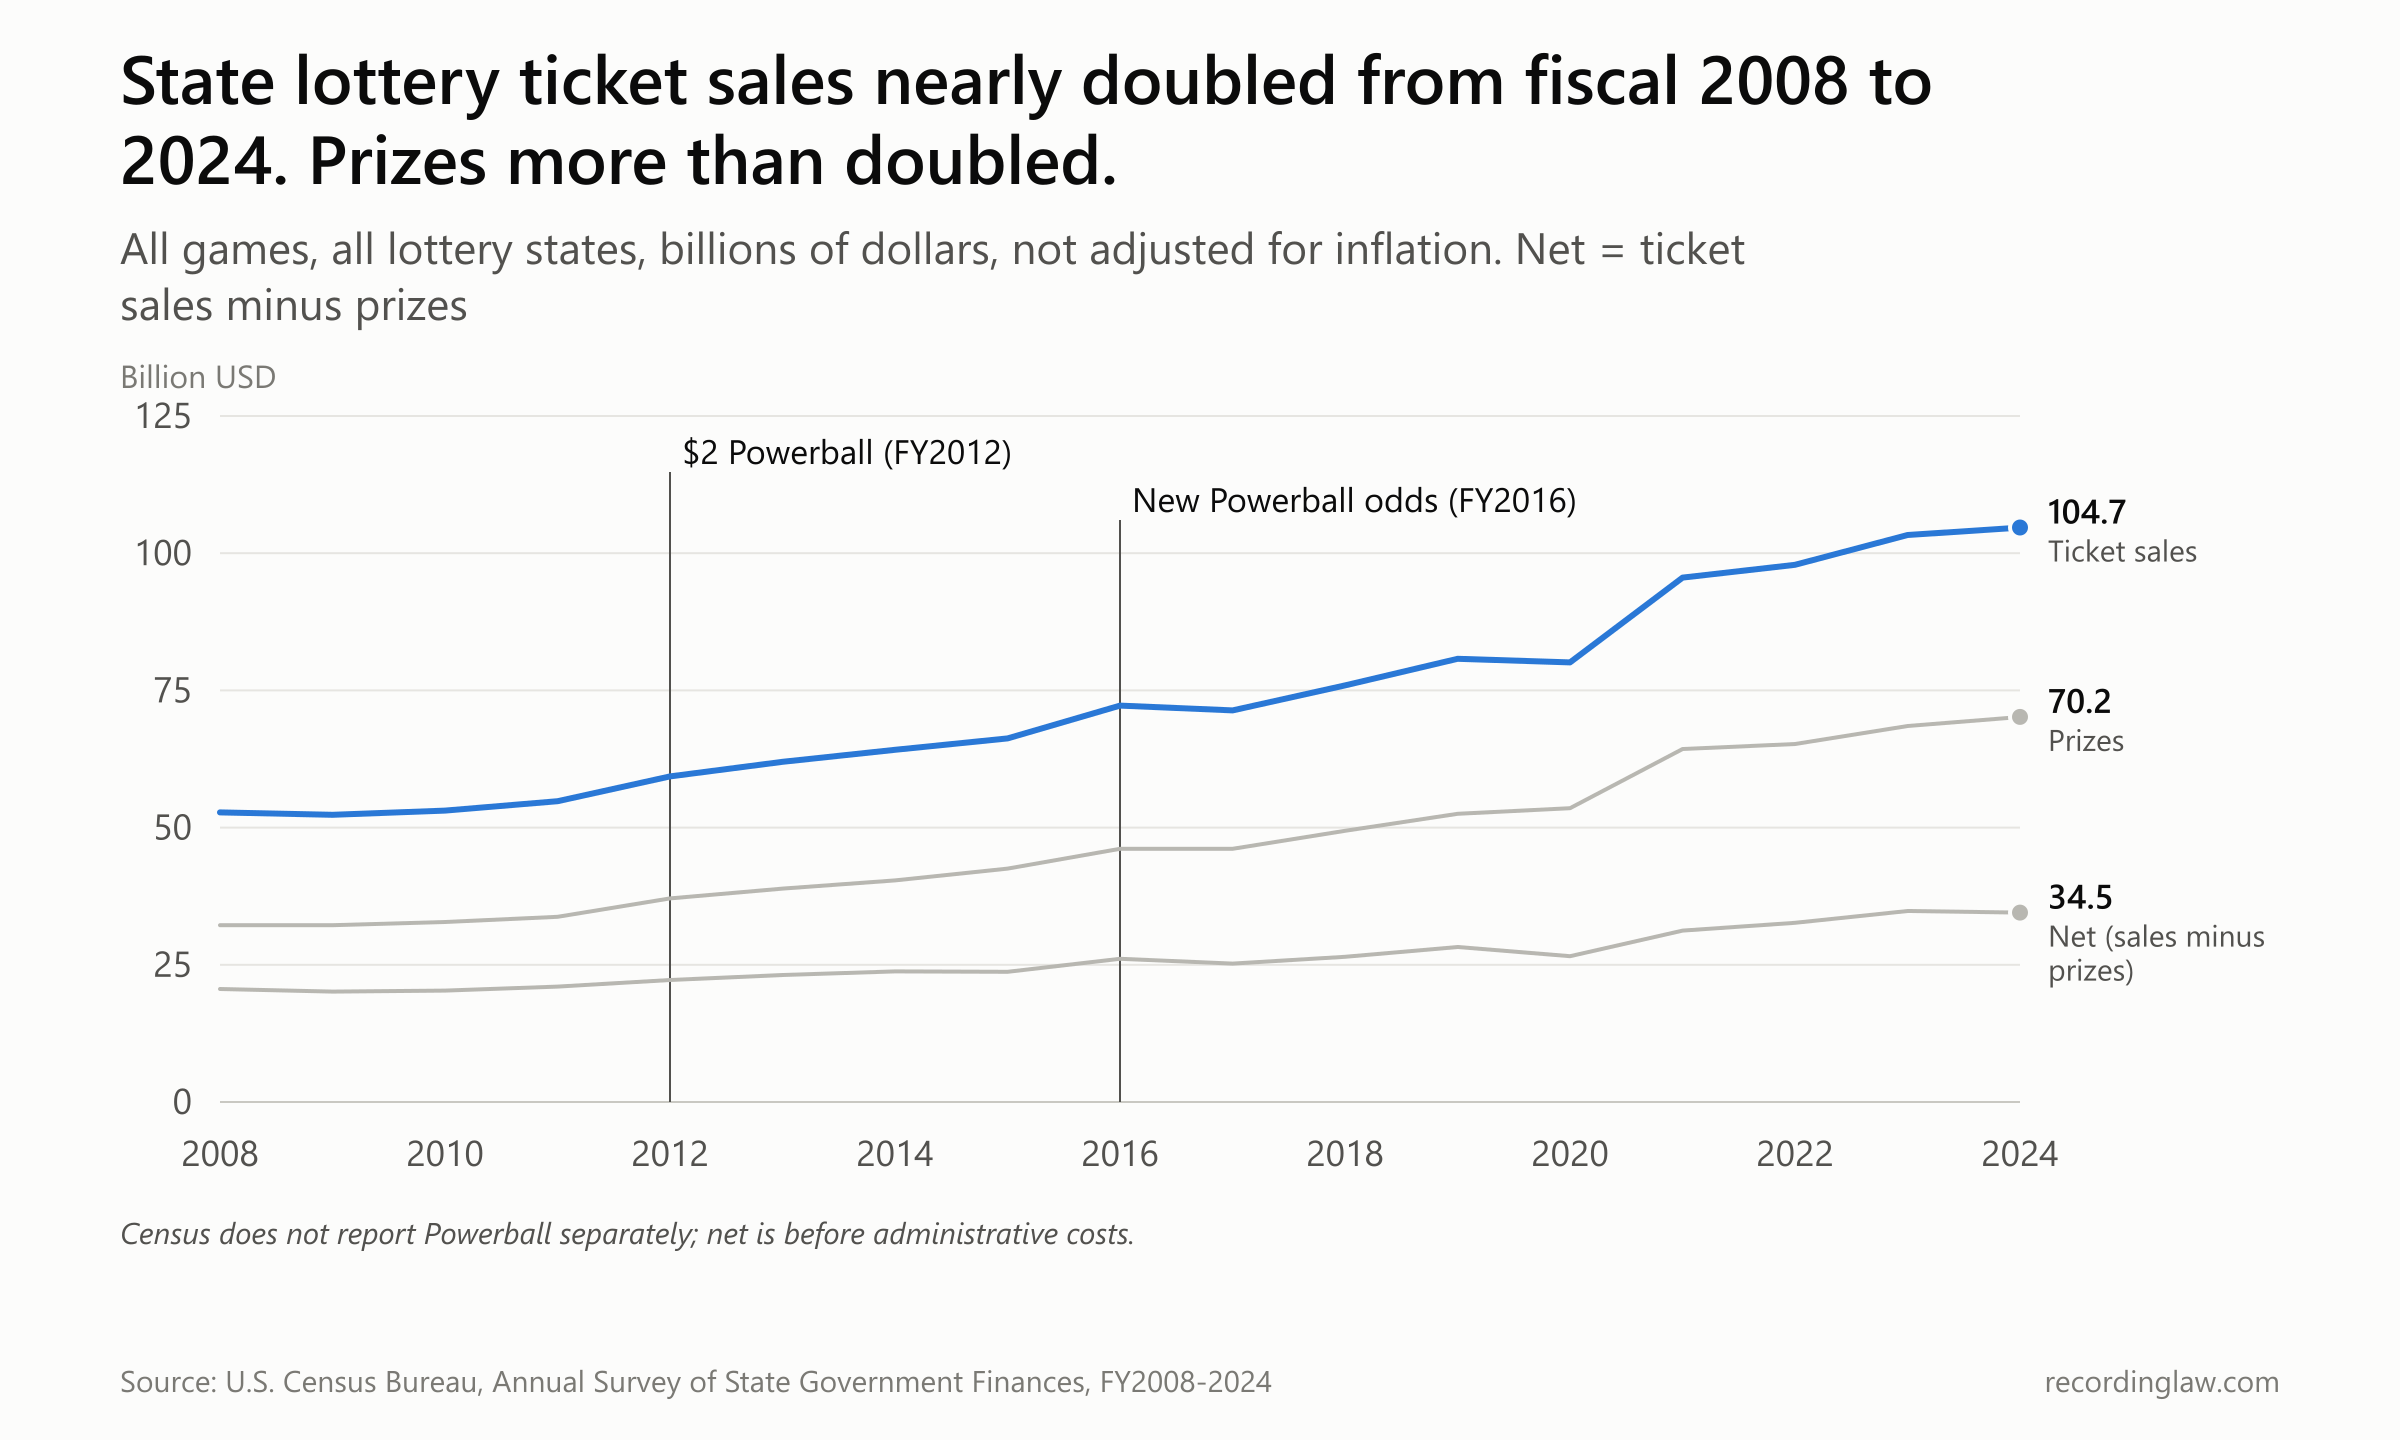
State lottery ticket sales, prizes and net (sales minus prizes), FY2008-2024, nominal dollars. Source: Census ASFIN.
| Fiscal year | Ticket sales ($B) | Prizes ($B) | Sales minus prizes ($B) |
|---|---|---|---|
| 2008 | 52.786 | 32.211 | 20.575 |
| 2012 | 59.314 | 37.084 | 22.230 |
| 2015 | 66.268 | 42.527 | 23.741 |
| 2016 | 72.224 | 46.143 | 26.080 |
| 2020 | 80.108 | 53.524 | 26.583 |
| 2021 | 95.553 | 64.334 | 31.219 |
| 2023 | 103.305 | 68.514 | 34.790 |
| 2024 | 104.681 | 70.170 | 34.510 |
Prizes grew faster than sales. Over those years, prizes rose 118%, the bureau found. Net revenue, the bureau's name for what the states had left after prizes, rose 68%, it found. "States gradually paid out larger prizes and kept a smaller portion of revenues for themselves between fiscal years 2008 and 2024," it wrote.
How large was the shift in each dollar of sales?
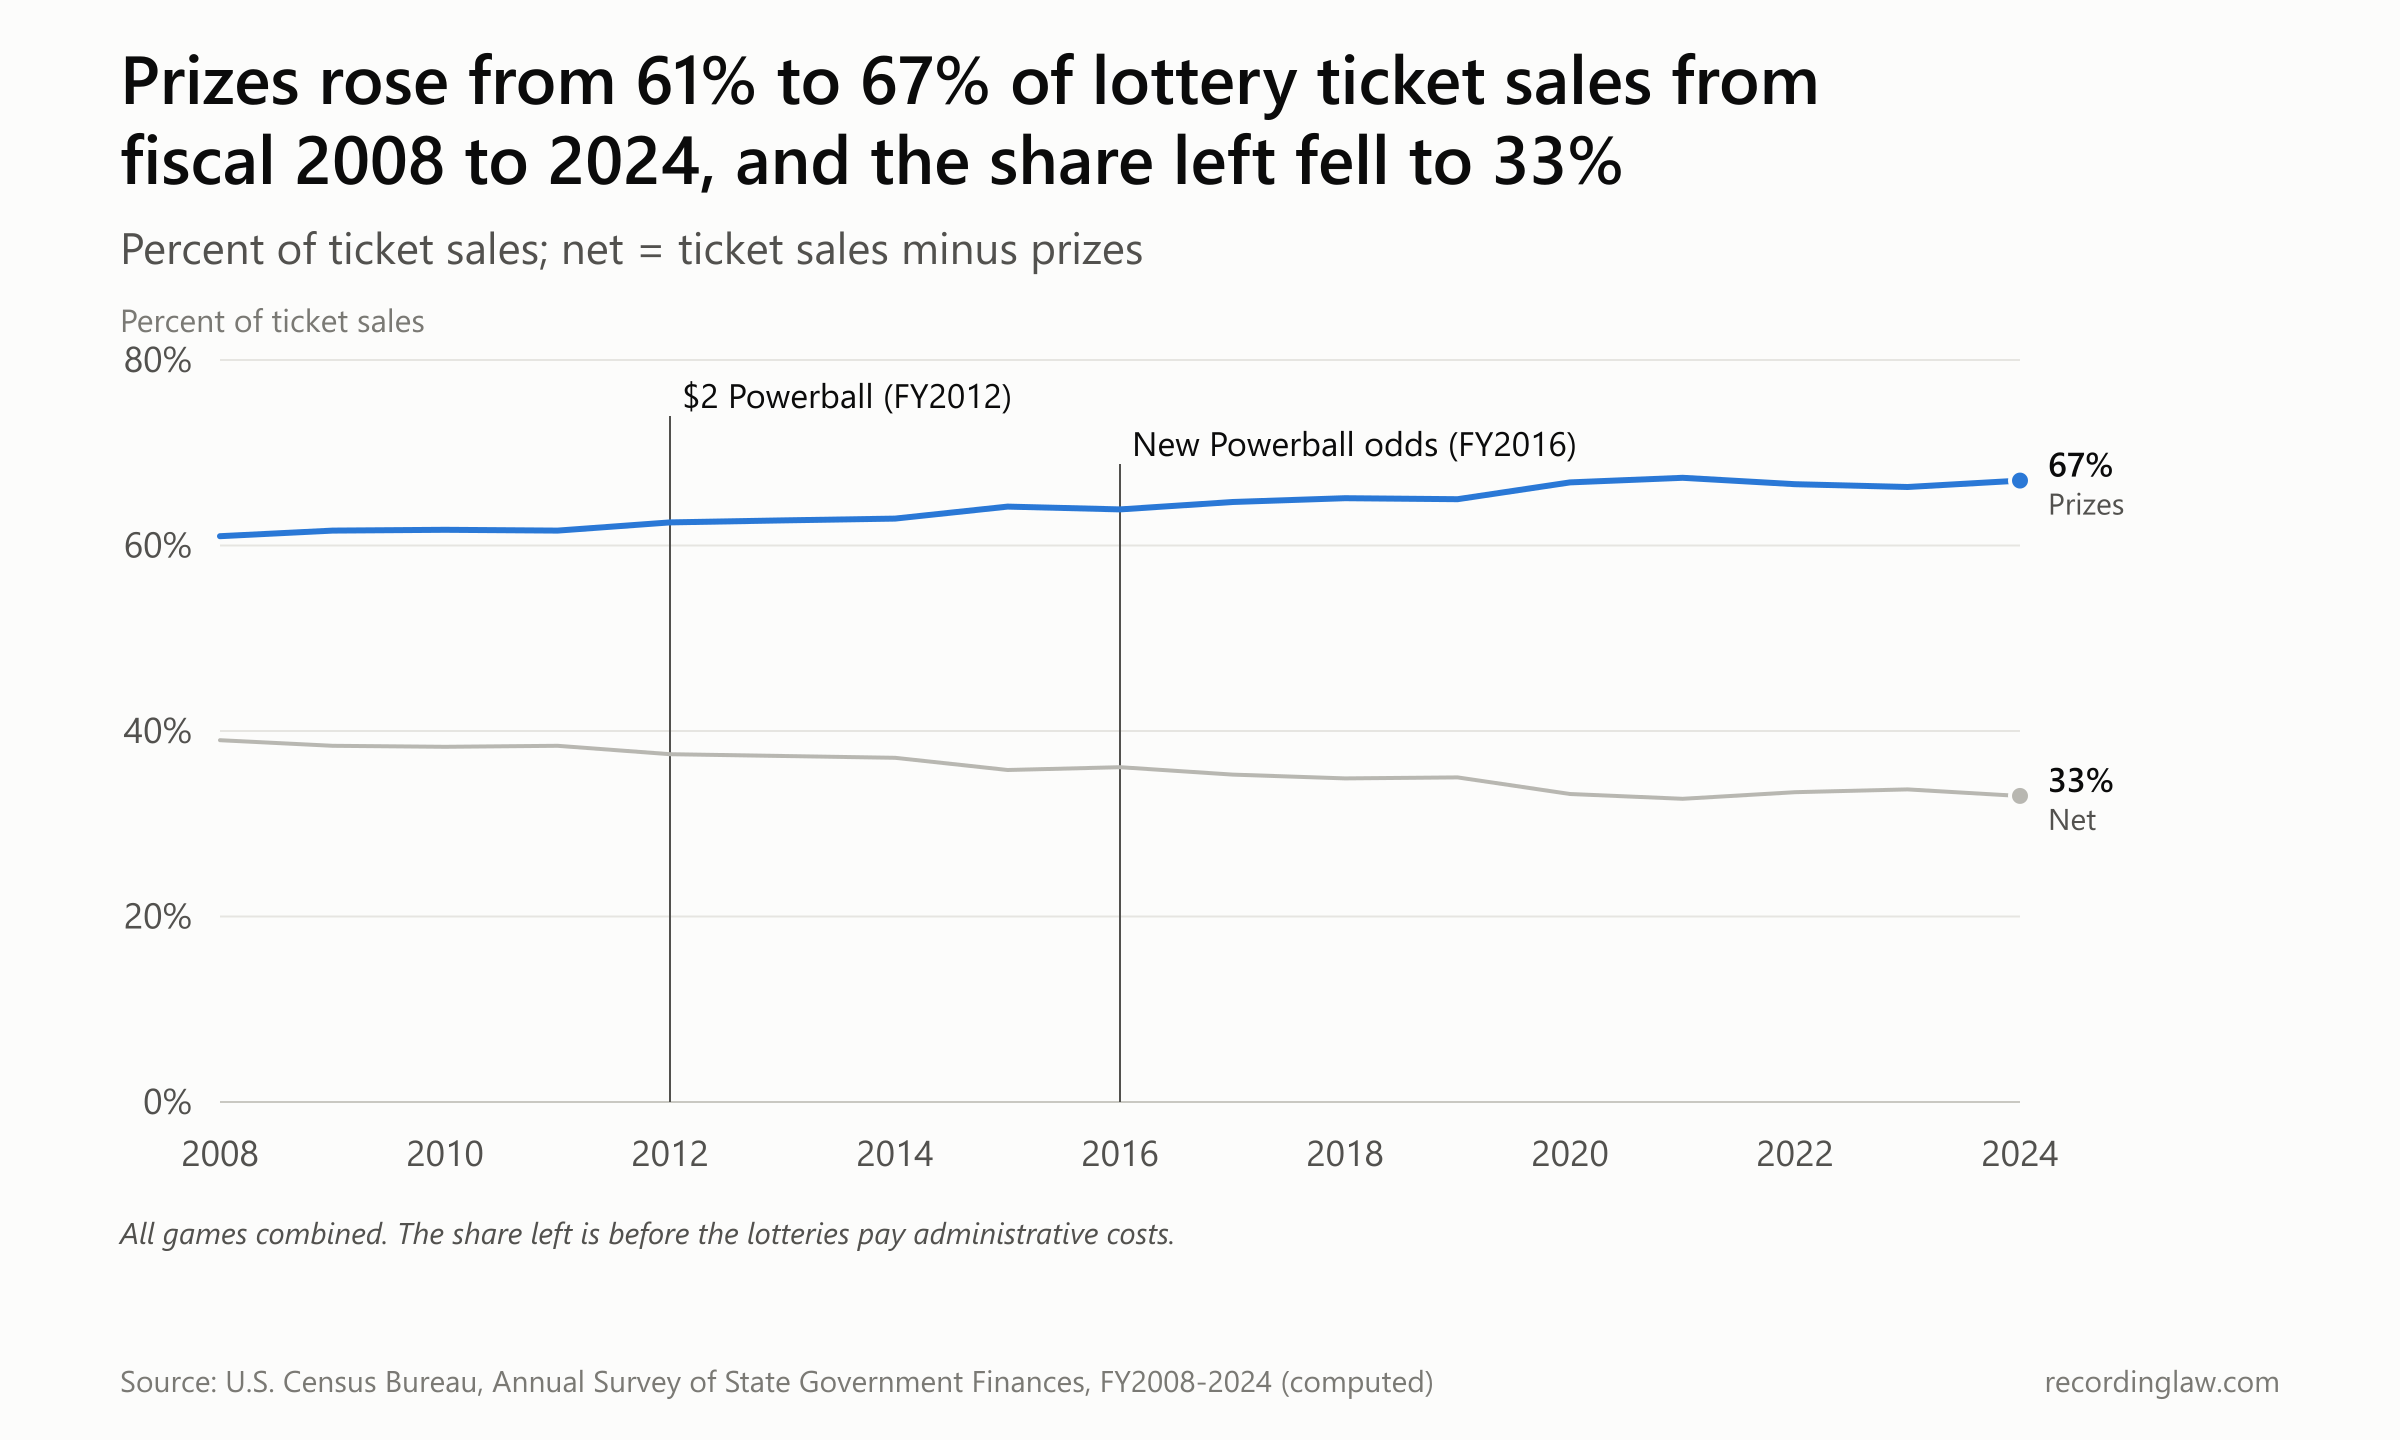
Prizes and net as a share of ticket sales, FY2008-2024. Source: Census ASFIN (computed; Census Table 1 rounds to whole percent).
| Fiscal year | Prizes, % of sales | Sales minus prizes, % of sales |
|---|---|---|
| 2008 | 61.0 | 39.0 |
| 2012 | 62.5 | 37.5 |
| 2015 | 64.2 | 35.8 |
| 2016 | 63.9 | 36.1 |
| 2020 | 66.8 | 33.2 |
| 2024 | 67.0 | 33.0 |
Prizes went from 61 cents of each dollar to 67. Virginia paid out 80% of its ticket sales in prizes in fiscal 2024, the largest share of any state. Had the states kept 39 cents of each dollar in fiscal 2024, sales minus prizes would have been about $6.3 billion higher.
The 33 cents is before the lotteries pay their own running costs. After those administration costs, the Census Bureau counts $29.7 billion in what it calls proceeds available for fiscal 2024. That is about 28 cents of each dollar of sales.
None of this isolates Powerball. With scratch-offs taking more than two-thirds of spending, most of it is not jackpot money. "In the popular imagination, the lottery is funded by people who spend a few dollars on a Powerball ticket when the jackpot gets big," the AP's version of the Howard Center investigation said. "This is not reality."
MUSL's own accounts of what a Powerball ticket leaves behind do not agree with each other. Its website FAQ says "On average, 35% of every $2 Powerball ticket stays in the jurisdiction where it's sold to support public programs and services."
"More than half of every $2 Powerball ticket stays in the jurisdiction where the ticket is sold," its April 2026 release says. The AP's 2012 story on the $2 price, reporting Rich's case for it, said "Half of ticket sales are returned to the states." The pages we read do not explain the difference.
In its April 2026 release, MUSL said the game had generated an estimated $38 billion for good causes over 34 years. Who supplies the ticket money is a different question, and the answer changes from state to state and from neighborhood to neighborhood.
Who sells the tickets, and to whom?
Sales per resident in the top state were almost 18 times those in the bottom one. Massachusetts sold $859 in lottery tickets per resident in fiscal 2024, and North Dakota sold $48. The national figure was $308.
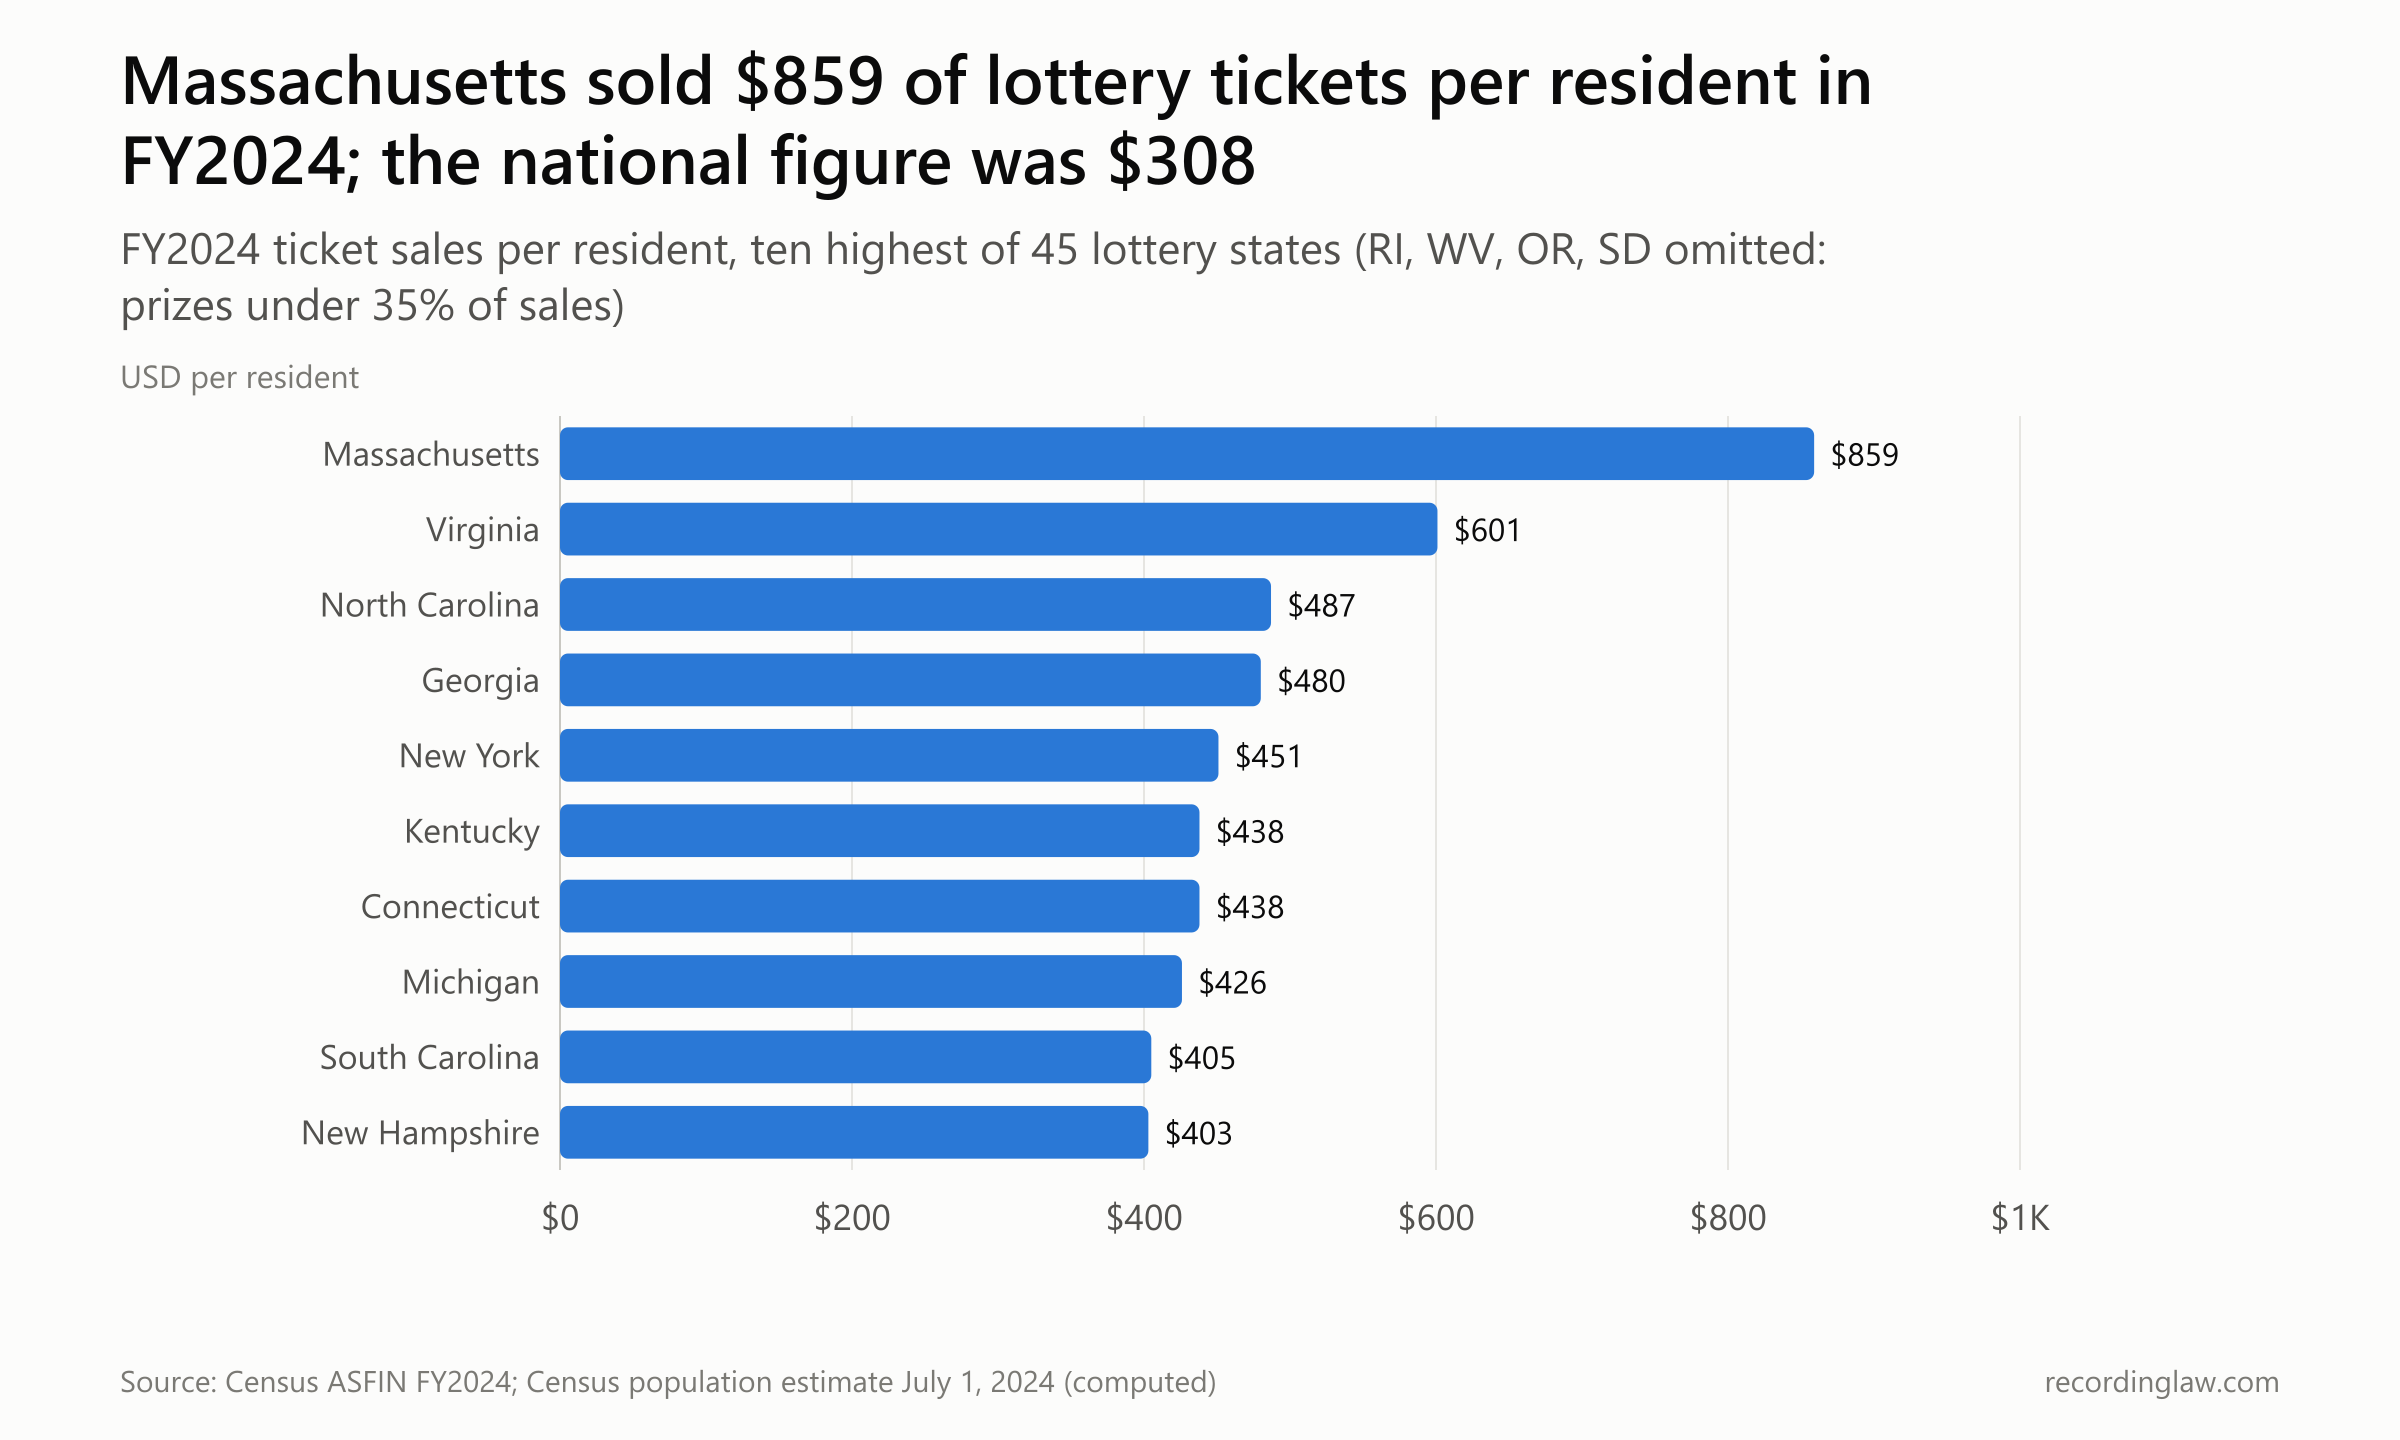
FY2024 lottery ticket sales per resident, ten highest of 45 states (Rhode Island, West Virginia, Oregon and South Dakota omitted; see How we measured). Source: Census ASFIN, Census population estimates (computed).
| State | FY2024 ticket sales per resident |
|---|---|
| Massachusetts | $859 |
| Virginia | $601 |
| Rhode Island (not charted) | $538 |
| North Carolina | $487 |
| Georgia | $480 |
| New York | $451 |
| Kentucky | $438 |
| Connecticut | $438 |
| Michigan | $426 |
| West Virginia (not charted) | $407 |
| South Carolina | $405 |
| New Hampshire | $403 |
| All 45 lottery states | $308 |
| North Dakota (lowest) | $48 |
Five states had no lottery in fiscal 2024: Alabama, Alaska, Hawaii, Nevada and Utah. The newest three, Arkansas, Wyoming and Mississippi, started in fiscal 2010, 2015 and 2020.
Inside the states, the Howard Center mapped where the tickets are sold. The 2022 investigation, by reporters and students at the University of Maryland and Boston University and funded by the Scripps Howard Foundation, compared lottery retailer lists with census data. "In neighborhoods with lottery retailers, the percentage of the population that lives in poverty is higher than in neighborhoods without lottery retailers in all 44 states analyzed and in Washington, D.C.," it found.
In Michigan, the analysis found, neighborhoods with a lottery retailer had a median poverty rate nearly double that of neighborhoods without one. Their median household income was $16,000 lower, it found. The Black population was higher in neighborhoods with retailers in 35 states and D.C., and the Hispanic population in 37 states and D.C.
The industry disputes what a store's address shows. The North American Association of State and Provincial Lotteries (NASPL), the trade group, says people "don't always buy their lottery tickets in the neighborhoods where they live. They purchase them on their way to or from work, while shopping or running other errands, or even at the airport."
The Howard Center tested that with mobile-phone location data from SafeGraph at nearly three-quarters of U.S. lottery retailers. At a Marathon gas station in Warren, Michigan, which sold more than $725,000 in lottery tickets in 2020, the average customer lived within 1.1 miles of the store. "In all but Arizona and Washington, D.C, a majority of lottery retailers had a customer base that mainly came from local neighborhoods," the analysis found.
States pick retailers on business grounds. The Howard Center found they "recruit retailers based on factors like store security, the ability to hit sales targets and compliance with in-store advertising requirements," and found "no evidence that states consider racial or economic inequity."
Stores earn about 6% of what they sell, the Howard Center reported, "but also earn substantial bonuses when a customer wins big." Retailers took in $5 billion in 2020, according to the La Fleur's almanac.
Big's 103 in Fredericksburg, Texas, which sold one of the two winning tickets for September 2025's jackpot, received a $250,000 ceremonial check. "Behind every winning ticket is a network of dedicated retailers who help make these historic moments possible," said Courtney Arbour, executive director of the Texas Department of Licensing and Regulation, which took over the Texas Lottery after the legislature abolished the Texas Lottery Commission in 2025.
Who plays which game differs too. A 2023 working paper by Paul Parker, Paulo Albuquerque and Yakov Bart, built largely on California Lottery data, found that players in low-income areas "lose 10% more per ticket than those in high-income areas because of when and how they choose to play." It also found that "people in low-income areas are less likely to switch between games when the jackpot increases." Put the other way, in their data it was players in higher-income areas who were more likely to move to a game as its jackpot grew.
Melissa Schettini Kearney found in a 2005 study in the Journal of Public Economics that household lottery spending "crowds out approximately $38 per month, or two percent, of other household consumption, with larger proportional reductions among low-income households." She also found that demand responds to a ticket's expected value, which "suggests that consumers of lottery products are not simply uninformed, but are perhaps making fully-informed purchases."
Critics from different directions read the same pattern. "Poor people are collateral damage to a cause of raising money for what the legislators feel is good purposes," said Gregory W. Sullivan, a former Massachusetts inspector general and research director at the Pioneer Institute, a free-market think tank. Les Bernal, national director of Stop Predatory Gambling, an advocacy nonprofit, told NPR in 2022: "You have low-income people, essentially paying for college scholarships for middle-class and upper-class families to go to college."
NASPL answers that no one is made to play. "Playing the lottery is entirely voluntary," it wrote in its published lottery-myths material. "In our stressful world, the ability to dream is well worth the price of a lottery ticket."
Riley Sullivan, a senior policy analyst at the Federal Reserve Bank of Boston, summarized what earlier studies found. "People who live in lower-income areas spend much more on lotteries, especially when you adjust for income," he said. "So, while these people are opting into playing and spending that money, you just don't want these things to be exploitative."
None of this is new to regulators. A federal commission, the National Gambling Impact Study Commission, found in 1999 that "lottery play is heaviest among economically disadvantaged populations," but that "it is not clear that these have been deliberately targeted by lottery officials."
It recommended that regulators ban aggressive advertising strategies, especially those "that target people in impoverished neighborhoods." State lotteries are also exempt from Federal Trade Commission rules against misleading and deceptive advertising. "The FTC does not regulate state lotteries because they are regulated at the state level," an FTC spokesperson told the Howard Center, adding that "the most important part is that we do not regulate them because they are not interstate commerce."
The money the players leave behind goes to the state. What it buys was the central promise of North Carolina's lottery campaign.
Does lottery money add to school budgets?
North Carolina, fourth-highest in sales per resident in fiscal 2024, shows how that promise was tested. Gov. Mike Easley signed its education lottery in 2005. "This is a win for our schoolchildren across the state," he said.
The law carried its own promise. When the lottery bill first passed, WRAL later reported, it stated that lottery revenue should supplement the education budget rather than substitute for money already allocated.
Opponents doubted the money. "But it's still a tax; it still results in revenues being taken from people that would have been spent on other consumer goods," said David Mills of the Common Sense Foundation, a Raleigh think tank that opposed a lottery. The foundation pointed to research suggesting lottery money had replaced regular education aid in California, Florida and Michigan.
In August 2006, WRAL reported, the language barring lottery money from replacing other education spending was struck from the lottery law. "They struck that language out of the lottery altogether," said John Rustin of the N.C. Family Policy Council, a conservative nonprofit. "There's the concern the big shell game is going to take place," he said.
On December 12, 2006, the AP reported: "About half the revenues from the $400 million that a new lottery is expected to generate in North Carolina will replace current education spending, Gov. Mike Easley's administration says." Elaine Mejia, director of the N.C. Budget and Tax Center, which had opposed the lottery, said, "In all likelihood, the public was hoodwinked."
Late that day, Easley issued a statement. "Education lottery money will supplement, not supplant existing spending for education and I will not recommend nor sign legislation that reduces the state's spending for education," he said. He added that since 2001 he had "consistently said that once an education lottery was enacted, we would use the proceeds to fund these priorities permanently," meaning the pre-k and class-size programs.
Later accounts split the same way. Carolina Journal, published by the John Locke Foundation, a free-market think tank, reported in 2010 that Gov. Bev Perdue "emptied $50 million from lottery reserves" to balance a budget. It also reported that $69 million "slated initially for school construction" went to the general fund.
In 2018, EdNC reported that lottery sales and education funding had "increased every year," according to the legislature's Program Evaluation Division. But EdNC also reported that whether the lottery "has produced additional funds for education is not as clear cut."
The national research does not settle it either. "At the K-12 level, where almost all of the research on earmarks has occurred, scholars have come to very different conclusions on whether lottery earmarks end up replacing education funding," three researchers wrote for Brookings in 2018. The studies compare different things:
- An earmarked dollar against other lottery dollars.
- Earmarking states against states whose lotteries feed the general fund.
- States before and after a lottery arrived.
| Study | What it compared | Finding |
|---|---|---|
| Novarro (2002, Stanford working paper) | Earmarked vs non-earmarked lottery dollars | About 36 cents more education spending per earmarked dollar |
| Pantuosco, Seyfried and Stonebraker (2007, Review of Regional Studies) | K-12 earmark states vs general-fund lottery states | "Little or no impact" of K-12 earmarks on K-12 funding (no single figure given) |
| Jones (2013, CMPO working paper) | States introducing education lotteries | "No evidence" of significantly higher education spending (no single figure given); donations to education groups fell |
| Bell, Stucky and Wehde (2018, Brookings summary) | All 50 states, 1990-2009, higher-education earmarks | About 5% higher higher-education appropriations; need-based aid down about 12% |
Only Novarro and Bell, Stucky and Wehde give figures, in different units (cents per earmarked dollar; percent change in appropriations), and Pantuosco and Jones give none, so the four are compared in this table rather than on one estimates chart. Sources: the studies' abstracts, the Pantuosco article and the Brookings article.
Neva Novarro, comparing earmarked and non-earmarked lottery dollars in a 2002 Stanford working paper, found that "a dollar of lottery profits earmarked for education increases current educational spending by roughly 36 cents more than a non-earmarked dollar." A 2007 study by Louis Pantuosco, William Seyfried and Robert Stonebraker, which compared K-12 earmark states with states whose lotteries feed the general fund, found that earmarking lottery money for K-12 schools has "little or no impact" on state K-12 funding. By contrast, in that study, lotteries that feed the general fund did seem to raise K-12 funding.
Daniel B. Jones, in a 2013 working paper on states introducing education lotteries, found "no evidence that states significantly increase their education expenditures" and found that donations to education groups fell after a lottery arrived. The three Brookings writers, Elizabeth Bell, Madeleine Stucky and Wesley Wehde, wrote about their own study of all 50 states from 1990 to 2009. In that period, 25 states earmarked lottery money for higher education. The writers found about a 5% increase in higher-education appropriations.
Merit-based aid rose, but after the earmarks began, states reduced need-based aid by about 12%. None of the pages we read named a funder for these studies. Meanwhile, both national jackpot games kept changing.
A $5 rival and players in the UK
Powerball's rival made a similar bet in 2025, at a higher price. Mega Millions went to $5 a ticket in April 2025, with jackpot odds of 1 in 290.5 million. "We expect more billion-dollar jackpots than ever before," said Joshua Johnston, lead director of the Mega Millions consortium, when the change was announced in October 2024.
Powerball stayed at $2, and it was still $2 a play as of November 2026. Instead of changing the odds again, it added players. UK ticket sales began on July 21, 2026, and UK players joined the same jackpot from the July 22 drawing.
"This is a win for Powerball players – as more people play, the faster jackpots grow, all while keeping odds the same for every Powerball drawing, wherever a player buys their $2 ticket," said Matt Strawn, the Powerball Product Group chair and Iowa Lottery CEO, in April 2026. In July, Tennessee Lottery CEO Rebecca Paul said, "Every Powerball ticket sold in the U.S. will continue to support programs and services right here at home."
The first run with UK players ended on August 12, 2026, when a single ticket sold in Illinois won $1.04 billion on the 44th drawing. The next run rolled through Halloween. "In the last week, this jackpot has gained momentum, and we've recorded an uptick in ticket sales across all participating lotteries," Stephen Durrell, the Powerball Product Group chair and Kansas Lottery executive director, said before the October 31 drawing.
No one won that night or on November 2. On November 4, 2026, a single ticket sold in New Jersey won $847 million, with a cash value of $363.1 million, on the 36th drawing of the run. MUSL ranked it the ninth-largest Powerball jackpot.
What the jackpot runs mean for the states shows up in the Census Bureau's ledger, which comes out once a year. Census says it releases these figures in the first quarter of each year, so the fiscal 2025 numbers are expected in early 2027. They will show whether prizes kept taking a larger share of each dollar.
They will not show Powerball on its own line, or the $50,000 commission that went to Murphy USA 7879 in Cabot, Arkansas. The run that ended there on Christmas Eve 2025 lasted 47 drawings. As of November 10, 2026, none of the seven runs since then had lasted as long; the longest ended after 44 drawings in Illinois, and the most recent after 36 in New Jersey.
How we measured
State lottery money. Ticket sales, prizes, administration and proceeds come from the U.S. Census Bureau's Annual Survey of State Government Finances (ASFIN): the GS00STATEFIN02 time-series file for fiscal 2012 to 2024 and the per-year lottery tables for fiscal 2008 to 2011. Fiscal 2024 is the newest year. Census published its summary in April 2026 and says these data are released yearly in the first quarter. Figures are nominal dollars, not adjusted for inflation, and state fiscal years end on different dates.
"Net" here, as in the Census Bureau's own story, is ticket sales minus prizes; it still includes the lotteries' administrative costs. Census's "proceeds available" after administration is a separate, smaller figure ($29.66 billion in fiscal 2024). Census revised fiscal 2023 administration and proceeds between releases. Sales and prizes did not change.
Arithmetic shown in the text. About $287 million a day: $104.681 billion divided by 365. About $6.3 billion: 39% of $104.681 billion is $40.83 billion, minus the actual $34.51 billion. About 28 cents: $29.66 billion divided by $104.681 billion. Prize and net shares are computed to one decimal; Census Table 1 rounds them to whole percents (61 and 39 in 2008, 67 and 33 in 2024).
Sales per resident. Fiscal 2024 sales divided by the Census Bureau's July 1, 2024 resident population estimate (all ages, Vintage 2024). Massachusetts: $6.127 billion over 7.14 million residents. North Dakota: $38.3 million over 797,000. The ratio between them, $859 to $48, is about 18 to 1.
Rhode Island, West Virginia, Oregon and South Dakota report prizes at 21% to 34% of sales, far below other states. Census does not explain this, and we could not confirm their figures are comparable, so they are left off the chart. Rhode Island and West Virginia appear in the table where they rank in the top ten.
Powerball draws. We read the powerball.com result page for each of 2,018 drawings from February 3, 2010 to October 28, 2026 (draw dates from New York's open-data draw file). A jackpot win is a drawing where the page lists a jackpot-winning ticket. In all, 153 drawings did. The jackpot figure is the "Estimated Jackpot" printed on the page, the advertised annuity value, not the cash value and not necessarily the final amount. MUSL's releases give some of these with more precision ($1.586 billion for January 2016, $1.787 billion and $1.817 billion for 2025, $1.04 billion for August 2026). The cash shares in the text are the printed cash value over the estimated jackpot: $983.5 million over $1.59 billion and $450.5 million over $1.04 billion. The November 4, 2026 jackpot win falls after this window and is not in the era figures.
Eras. Each era starts at the first drawing under a new format: January 18, 2012 ($2 ticket), October 7, 2015 (69 white balls and 26 Powerballs), August 23, 2021 (Monday drawings). Wins per year are jackpot wins divided by calendar days in the era, times 365.25.
Run lengths in drawings are not comparable across the 2021 break, because a third weekly drawing adds drawings without adding days. The first run in the file is cut off at its start. "About 40%" is 1 minus 175,223,510 divided by 292,201,338, the before and after jackpot odds.
Education studies. Novarro's and Jones's findings come from their abstracts, Pantuosco, Seyfried and Stonebraker's from the published article, and Bell, Stucky and Wehde's from their Brookings summary of their study. The studies measure different outcomes in different units, so the page sets them side by side in a table instead of on one estimates chart.
Chart markers. The two Census charts mark fiscal 2012 (the $2 Powerball ticket, January 2012) and fiscal 2016 (the new odds, October 2015). State fiscal years end on different dates, so the markers are approximate.
What the data cannot show. It cannot separate the effect of the 2015 odds from the 2012 price change, the 2020 cut in the starting jackpot, the 2021 Monday drawings, the 2026 UK pool, changes to Mega Millions, general sales trends, or the interest rates and inflation that move the advertised annuity jackpot. We found no public national Powerball sales series, so we cannot say whether the 2015 change raised Powerball sales or how much of the $104.7 billion is Powerball. The retailer and poverty findings are the Howard Center's 2022 analysis of 2020-era data for all lottery games. We did not have retailer files to re-run them. The North Carolina "non-supplant" history rests on news accounts from WRAL and the Associated Press, not on the statute text.
Frequently Asked Questions
What are the odds of winning the Powerball jackpot?
As of November 2026, and since October 2015, the odds are 1 in 292,201,338, because players pick five of 69 white balls and one of 26 Powerballs. From 2012 to 2015 they were 1 in 175.2 million. The odds of winning any prize are 1 in 24.9.
When did Powerball change its odds, and why?
The change was announced in July 2015. Tickets on the new design went on sale October 4, 2015, and the first drawing was October 7. Lottery officials said it was designed to create larger average jackpots and more winning experiences.
How often is the Powerball jackpot won?
Based on powerball.com draw pages, there were about 13.5 jackpot-winning drawings a year from 2012 to 2015. From October 2015 to August 2021 there were about 7.1 a year, and from August 2021 to October 28, 2026 there were about 6.6.
How many Powerball jackpots have topped $1 billion?
As of November 2026, eight jackpots won from January 2016 to August 2026 were advertised at more than $1 billion: January 2016, November 2022, July 2023, October 2023, April 2024, September 2025, December 2025 and August 2026. The largest was $2.04 billion in California on November 7, 2022.
How much money do states make from the lottery?
In fiscal 2024, state lotteries sold $104.7 billion in tickets and paid $70.2 billion in prizes, leaving $34.5 billion, or 33% of sales, before administrative costs. After administration, Census counts $29.7 billion in proceeds available. These figures cover all games, not just Powerball.
How much of a $2 Powerball ticket goes to the state?
The Multi-State Lottery Association gives two figures. Its FAQ says 35% of every $2 ticket stays in the jurisdiction to support public programs, and its 2026 releases say more than half stays in the jurisdiction. It does not explain the difference on the pages we read.
Which state spends the most on lottery tickets?
Per resident, Massachusetts sold the most in fiscal 2024, about $859 per resident, against a national figure of about $308. In total dollars, California sold the most, $9.28 billion, followed by New York, Florida and Texas.
Which states do not have a lottery?
In the Census Bureau's fiscal 2024 data, Alabama, Alaska, Hawaii, Nevada and Utah had no lottery. The newest lottery states are Arkansas, Wyoming and Mississippi, which started in fiscal 2010, 2015 and 2020.
Are lottery retailers concentrated in poorer neighborhoods?
A 2022 Howard Center for Investigative Journalism analysis found higher poverty in neighborhoods with lottery retailers in all 44 states it analyzed and in Washington, D.C. The industry group NASPL says people often buy tickets away from home. The Howard Center's phone-location data found most retailers' customers came from nearby neighborhoods in every analyzed state except Arizona and D.C.
Does lottery money increase education spending?
Studies disagree. One estimated that an earmarked dollar raises education spending about 36 cents more than a non-earmarked dollar. Others found little or no effect for K-12. One found higher-education appropriations up about 5%, while need-based aid fell about 12%.
How much does a Powerball ticket cost?
As of November 2026, Powerball costs $2 per play. In Idaho and Montana it is bundled with Power Play for a minimum of $3. Mega Millions, a separate game, went to $5 in April 2025.
Updates
Reworded for readability. No figures, quotes, sources or findings changed.
Restructured as a feature: chart titles state the finding, side details moved to How we measured. Every figure and quote was re-checked against its source.
Independently fact-checked against the cited primary sources
Independently fact-checked against the cited primary sources
Sources and References
- U.S. Census Bureau, "Sales of Lottery Tickets Nearly Doubled and Prizes More Than Doubled From 2008 to 2024" (April 2026)(www.census.gov).gov
- U.S. Census Bureau, Annual Survey of State Government Finances time-series file GS00STATEFIN02 (FY2012-2024)(www2.census.gov).gov
- U.S. Census Bureau, state government lottery finances table, FY2008 (and FY2009-2011 equivalents)(www2.census.gov).gov
- U.S. Census Bureau, 2023 state lottery table(www2.census.gov).gov
- U.S. Census Bureau, state population estimates, Vintage 2024(www2.census.gov).gov
- Powerball.com (Multi-State Lottery Association), previous draw results and per-draw result pages, 2010-2026(www.powerball.com)
- Powerball.com, draw result, January 13, 2016(www.powerball.com)
- Powerball.com, draw result, November 7, 2022(www.powerball.com)
- Powerball.com, draw result, October 28, 2026(www.powerball.com)
- New York State open data, Powerball winning numbers (draw dates)(data.ny.gov).gov
- Wikipedia, "Powerball" (format-change dates)(en.wikipedia.org)
- Boston Globe, "Powerball game restructured to change odds of winning" (October 1, 2015)(www.bostonglobe.com)
- KLFY, "Powerball changes coming October 4" (Louisiana Lottery announcement, July 7, 2015)(www.klfy.com)
- Talk of the Sound, New York Lottery announcement on the October 7, 2015 drawing(talkofthesound.com)
- CBS Baltimore / Associated Press, "Pricey Picks: Powerball Tickets Doubling To $2" (January 2, 2012)(www.cbsnews.com)
- Philadelphia Inquirer, "Powerball jackpot is fastest ever to top $300 million" (September 13, 2013)(www.inquirer.com)
- The Fiscal Times, "New Powerball Rules Make It Harder to Win Big" (July 2015)(www.thefiscaltimes.com)
- Global Gaming Business, "New Powerball odds" (October 2015)(ggbnews.com)
- Global Gaming Business, "Original Powerball changes called too complex" (February 2016)(ggbnews.com)
- WTVR / CNN Money, "Why the odds of winning Powerball jackpot are even worse than you think" (January 6, 2016)(www.wtvr.com)
- Washington Post, "How Powerball manipulated the odds to make a $1.5 billion jackpot happen" (January 13, 2016)(www.washingtonpost.com)
- CBS News / Associated Press, "Powerball dropped revamp that gave better odds to win" (February 23, 2016)(www.cbsnews.com)
- Fox Business, "Powerball cuts jackpot amounts amid coronavirus sales drop" (April 2, 2020)(www.foxbusiness.com)
- Powerball news release, "$36 billion generated for good causes over 33 years" (April 22, 2025)(www.powerball.com)
- Powerball news release, "$1.817 billion Powerball jackpot won in Arkansas" (December 2025)(www.powerball.com)
- Arkansas Scholarship Lottery release, "Winning Powerball ticket worth $1.817 billion sold in Cabot" (December 2025)(www.powerball.com)
- Texas Lottery / TDLR release, "$250,000 bonus awarded to Texas retailer for selling Powerball jackpot-winning ticket" (October 2025)(www.powerball.com)
- Powerball news release, "Powerball Jackpot Crosses $700 Million, Approaches Rare Back-to-Back Major Jackpot Runs" (October 28, 2026)(www.powerball.com)
- Powerball news release, "Powerball jackpot set to grow faster with expansion to the UK this summer" (April 14, 2026)(www.powerball.com)
- Powerball news release, "Powerball launch set in the UK for July 21, first drawing to follow" (July 6, 2026)(www.powerball.com)
- Powerball news release, "$1.040 billion Powerball jackpot won in Illinois" (August 13, 2026)(www.powerball.com)
- Powerball news release, "Powerball Jackpot Reaches $760 Million for Halloween Drawing" (October 30, 2026)(www.powerball.com)
- Powerball.com FAQs (Multi-State Lottery Association)(www.powerball.com)
- Powerball.com home page (price and jackpot estimate, October 31, 2026)(www.powerball.com)
- ABC13 Houston, "Mega Millions tickets will climb to $5, but officials promise bigger prizes and better odds" (October 2024)(abc13.com)
- ABC7 San Francisco, "It will cost a bit more to get lucky with Mega Millions" (April 2025)(abc7news.com)
- Texas Legislature Online, bill history for SB 3070 (89th Legislature)(capitol.texas.gov).gov
- Howard Center for Investigative Journalism, "State lotteries transfer wealth out of needy communities" (Capital News Service, July 2022)(cnsmaryland.org)
- Howard Center, "About Mega Billions: The great lottery wealth transfer" (July 2022)(cnsmaryland.org)
- Howard Center, "State lottery advertising tells players half of the story" (July 2022)(cnsmaryland.org)
- Associated Press version of the Howard Center investigation, via KVIA (July 11, 2022)(kvia.com)
- Searchlight New Mexico, syndicated Howard Center investigation (July 2022)(searchlightnm.org)
- Parker, Albuquerque and Bart, "The Lottery Gap" (working paper, SSRN 3660130, 2023)(cssh.northeastern.edu)
- Melissa Schettini Kearney, "State Lotteries and Consumer Behavior" (NBER Working Paper 9330; Journal of Public Economics, 2005)(www.nber.org)
- NPR, "'Predatory gambling' has helped the lottery reach sky-high jackpot, critics say" (November 2, 2022)(www.npr.org)
- Alabama Political Reporter, quoting NASPL lottery-myths material (September 26, 2017)(www.alreporter.com)
- Federal Reserve Bank of Boston, interview with Riley Sullivan on lottery trends(www.bostonfed.org)
- National Gambling Impact Study Commission, Final Report (1999), Chapter 3(govinfo.library.unt.edu).gov
- WRAL / Associated Press on North Carolina lottery proceeds (December 12, 2006)(www.wral.com)
- WRAL on removal of North Carolina lottery non-supplant language (August 3, 2006)(www.wral.com)
- Education Week, "N.C. Backs Lottery to Fund School Projects" (September 13, 2005)(www.edweek.org)
- Carolina Journal (John Locke Foundation), on North Carolina lottery fund diversions (August 25, 2010)(carolinajournal.com)
- EdNC, "AskNC: What percentage of lottery money goes to education?" (April 23, 2018)(www.ednc.org)
- Neva Novarro, "Does Earmarking Matter? The Case of State Lottery Profits and Educational Spending" (SIEPR working paper, 2002)(siepr.stanford.edu)
- Pantuosco, Seyfried and Stonebraker, "The Impact of Lotteries on State Education Expenditures: Does Earmarking Matter?" (Review of Regional Studies, 2007)(rrs.scholasticahq.com)
- Daniel B. Jones, "Education's gambling problem" (CMPO Working Paper 13/307, 2013)(www.bristol.ac.uk)
- Bell, Stucky and Wehde, Brookings Brown Center Chalkboard (May 9, 2018)(www.brookings.edu)
- Powerball news release, "Single Ticket Wins $847 Million Powerball Jackpot in New Jersey" (November 5, 2026)(www.powerball.com)
- Powerball.com, draw result, November 4, 2026(www.powerball.com)
- Powerball.com, draw result, August 12, 2026(www.powerball.com)